






















![Tableau LOD Expressions [Overview of Tableau Level of Detail Calculation]](https://i.ytimg.com/vi_webp/IvZd1L9zWxo/maxresdefault.webp)


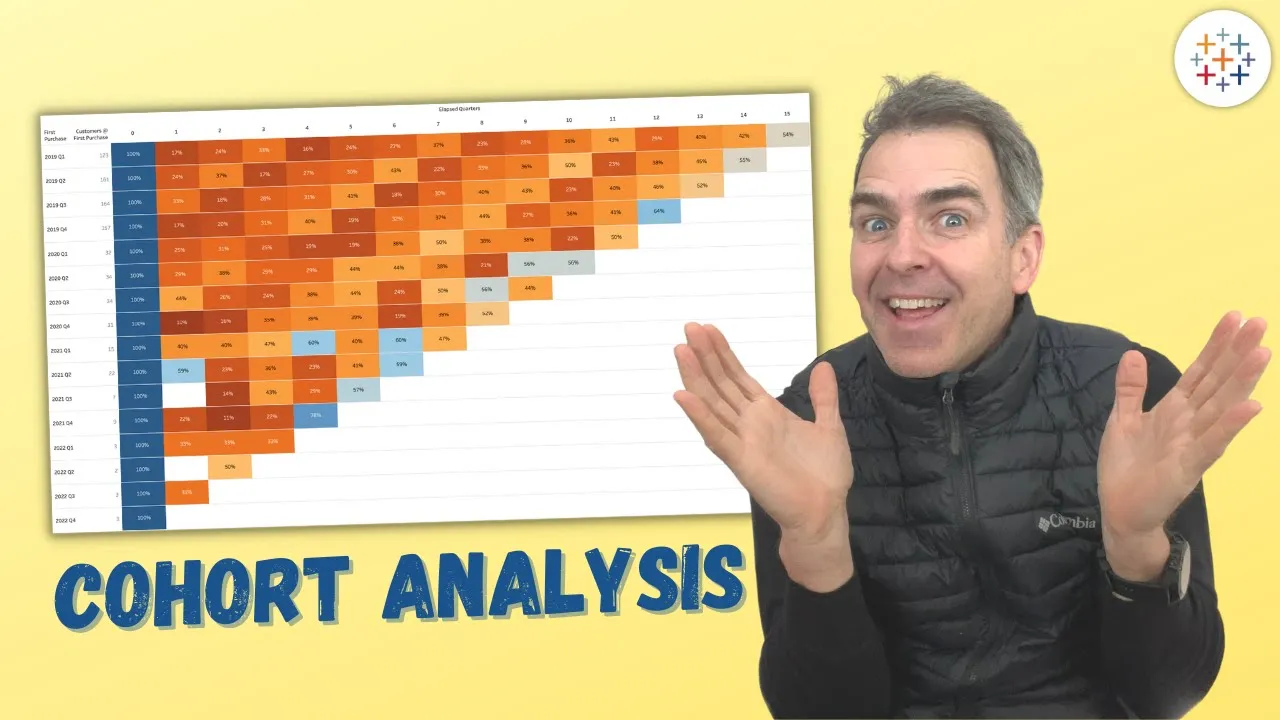
Cohort retention analysis is a method to track customer behavior patterns by grouping users based on shared characteristics (such as their first purchase date) and measuring how many return for subsequent purchases over time; this involves cleaning transaction data, creating cohort groups, calculating cohort indexes to represent months since first purchase, and visualizing retention rates using tools like SQL and Tableau to interpret customer loyalty trends.
Cohort Retention Analysis in SQL & Tableau | Data Analyst Tutorial
Added:Fundamental SQL querying skills, including the use of JOINs, GROUP BY clauses, and Common Table Expressions (CTEs).
Basic understanding of relational database structures and data cleaning concepts, such as handling null values and formatting date datatypes.
Familiarity with Tableau's interface, including connecting data sources, creating basic visualizations, and writing simple calculated fields.
The conceptual definition of a 'cohort' and the business significance of measuring customer retention rates over time.
Calculating Customer Lifetime Value (CLV) by integrating cohort retention metrics with revenue and average order value data.
Advanced behavioral cohorting, which groups users based on specific actions and feature adoption rather than simple acquisition dates.
Utilizing Tableau's Level of Detail (LOD) expressions to build highly dynamic and interactive user retention dashboards.
Applying predictive analytics (such as survival analysis or logistic regression) to forecast churn and retention rates for active cohorts.
23.1K views835likes59:00Original Release: 2022-05-12
[Music] hello friends this is angelina and welcome back to my channel it's been a while but i'm back with another video today we are going to do a cohort analysis in sql and then we are going to visualize the results in tableau at the end of this video you're going to understand what a cohort analysis is how to handle missing values in a data set how to extract date parts from a date field in your data set how to create a cohort and assign the cohort index to each transaction and how to create a cohort table for retention rate and visualize that in tableau and finally how to interpret the cohort retention rate table so at the end of this video you should come up with a cohort retention table dashboard like this and understand how to interpret or what these values in here mean okay so at the end of this video i hope that we can all achieve this together okay so with all that said let's get started by getting our data set the data set for today's demo will come from uci's machine learning ripple okay i'll share the link in the description below once you're on the website take note of a few things uh they show the number of attributes in this case the number of columns in the data set there are eight they also give you a brief information about the data set the time periods in the data set and what the data is about some something about a uk based online retail store or something and then the description of the attributes okay we have eight attributes and what each column here means all right so take a look at this but the data itself you want to click on data folder here once you click on data folder it takes you to this page with two links you want to click on the second link which is the online retail it's a spreadsheet once you click on that it's going to download for now i already have this downloaded in my data set okay so all that you have to do is to click on that make sure the file gets downloaded now that you have the file downloaded let's import the data into our database for this demo we are going to use uh sql server database sql server management studio so you want to create a connection to your database i am using localhost and the database i'm going to use for today's demo is db if you toggle up in the tables you see that i don't have this file already imported i'm going to use a tool called sorry sql server integration services to import the data so i'm going to go to visual studio 2019 and i'm going to create a new project now with this project i'm going to create an integration services project because i already have been creating such projects is here on my recent templates but if you don't see it you just want to type in integration services or just integration now you see the integration services pop up here so select that and go to next give it a name and you see as i type in the name the solution name also changes it's okay to leave both of them the same for this demo you can choose to rename it it's just a preference i'm just going to leave them as this so i'm going to hit create so if you're wondering why i just didn't do the import like this go to task and then you know use the import flat file or import data i tried this and it kept failing so i just decided to use a tool that i'm familiar with and just quickly import it okay that's why i'm using the visual studio tool here so go back here and as it create it opens the package you see under ssis packages under that folder there is a package here if you don't see that just right click on here create a new ssis package and now we have another one called package1 but we don't need that so i'm going to right click on that and i'll hit delete okay now that i have this all that i'm going to use is a data flow task you can drag and drop it onto the canvas like that or you can double click on it to just you know let it pop up here like that double click and there it is i'm just going to remove that i just want to rename this quickly to online retail probably data import how about that okay so now that i have renamed this i'm just going to configure it quickly go to other sources go to flat file now the main reason why i saved a copy of the data as a csv was to use the flat file source anytime i use the excel there was too much work that you needed to do to make it work all right and i didn't want all of you to go through that so just open the file save the copy as the csv and it's easier to work with that okay so i'm just going to copy this path here and i'm going to configure the flat file new connection and i will put my path here like that with the backslash and i'll still click on the browse because i need to pick the file now you don't see the file because of this section here i need to change it to csv select the file that i need open and then just put your uh double quotation back here for the test qualifier you know and i'll call this flat file manager or connection manager whatever you want to call it it's fine so over here remember remember column names are in the first row so you want to leave this checked okay so go to next the data looks good go to advanced okay so now everything here says it's a string and it's 50 even for the quantity how about the price customer id all right so what we want to do is that we want to um even the date is a string so click on suggest types and just hit ok all right it says now a customer number is an integer uh date is so say date now the quantity is now an integer and even the invoice has reduced in terms of the strength the length of the string to seven all right i think this is good so i hit okay here and now the main reason why i'm using the ssis tool is to leverage the error output section here i'm going to select all of this and i'm going to toggle this down here and i'll say ignore failure and i'll apply okay hit okay here this is all that you need to do that is the main reason why we are using ssis for this input now because we are ingesting this into a sql server database i'm going to use the oledb destination i'm going to configure it as new i already have a connection manager created however if you don't have that all you have to do is to click on new and then under the new you can either type in the dot which is your local host and then it will give you access to all the databases you have and you select one of them and you have to test the connection if it's successful you hit okay and then you hit ok or you can just type here local host okay it will give you the same results as the dot select the database you want to use it could be something different okay select that again test the connection hit okay and hit ok however i already have this created so i'm going to cancel it i'm just going to select one of my existing database connectivities so i'm going to go with the portfolio db and i hit ok now i'm going to change the data access mode to fast load we need this asap okay now i'm going to create a new table select an existing table or create a new table on the fly because i don't have any uh table called online retail i'm going to create one and i'm going to rename the table from here like that online retail okay it looks good i'll hit ok so once we run this we would realize that a new table will be created here from the tool so i'll hit mappings and go to output and everything is okay it looks good so hit save and then all that i have to do next is to execute the task this should look pretty quickly look at that fast pass fast perfect okay so now we stopped this job and then because it didn't fill i presume there is a file sorry a table already created here so let me refresh my tables all right so now that we see our data uh sorry our table here online retail we can we can inspect the data by right clicking on that and selecting the top 1000 rows and over here um we are going to inspect the data and decide what type of cleaning we are going to do on the data set so i think at this stage i'll just give it a further cleaning data and then let me remove the top 1000 here because we want to see the total number of records that we are working with i mean we saw that from the ssis 2 but um we're just going to do this here total reference it's 541 909 okay now as we inspect the data we have eight columns one two three four five six seven eight now from here we just wanna make sure that all the records have a customer id if not we would remove those you'll see here we have some customers without an id remember this is a numeric field let's see here the columns customer ids and numeric field hence if there's no value it evaluates it to zero okay so all the ones where the the customer id 0 means the the record do not have a customer id associated with it so we're going to remove those from our data set we can also see that at the quantity and the unit price level we have some quantities that are negative and from the description i'm seeing that means it was a return like a negative quantity maybe somebody bought an item with 160 quantity and return them back to the company all right that's what i'm assuming that's how probably there is no unit price so maybe after we remove the customer id as part of the cleaning of the data we would also remove all the records where the quantity and the unit price are not greater than zero okay so let's let's get started so first of all i would just say where customer id you know let's see how many of those records have customer equal to zero 135 okay so one three five zero eight zero records have no customer id and we do not want those in our data set so now i'm going to say where is not equal to and that should give me about about what four zero six eight two nine records have customer id so those are the ones we are going to focus on for now and now that we have this i'll put this record set into a common table expression okay i'll put that in the cte because we're going to keep working on that ct to get a refined data and then put that data in the time table so i'll start with a width class like a regular ct with and i'll just call it the same name as the table name for now and i say as i'll open parenthesis and i'll close parentheses here let me just select all my query and hit the tab once so now this ct can be called like this select star from let's run that great so it's working okay now what we want to do like we like i stated earlier on i want to remove all the records where the quantity is not greater than zero so i say where quantity is greater than zero and uh unit price is also greater than zero these are the records that i want to continue to work with so if i run this by just writing this query we have reduced the data from four zero six eight to nine to three nine seven eight and two okay so these are the records with a quantity and the unit price so now i'm going to pass this result set to another ct and um because i already started with clause i'm just going to do just a comma here and pass another name i don't know what to call it i'm just going to call it quantity you need price license i don't know how it sounds but hey that's what i'm going to call it as so i'm going to pass this query down here to the ct that i just created okay so now i can call this here and i'll call that as so now this city that i have created is based on the very first city i created again so if i call this quantity okay i should get my how many nine three nine seven eight e2 perfect the next thing i want to do is i want to do a duplicate check okay i want to do duplicate check next so i put this here duplicate check now to do the duplicate check i'm just going to use a function uh the row number and i'll do it over and i'm going to partition the data by some specific data points uh let me do the invoice partition by actually invoice number and i will do the stock code the description i think the stock code equates um the stock code gives the description i can just use this and skip this one so i'm going to do quantity uh probably i could add the unit price maybe quantity and just do order buy order by uh invoice invoice date and i'll call this deep flag because this is what is going to help me remove the duplicate all right so let's see what we have done here oops i think i saw okay so what this query is doing is that is uh taking the data set the results that we have here and it's selected some specific data points the invoice number the stock code and then the quantity okay and let's say that if i group the data pair these three data points do i have a duplicate so now obviously row number three zero six and three zero seven we see that it's identical row and hence the second one is a jeep let's see another one well this one here yep i think my duplicate check is working so i have three records and i think they are the same so i'll just focus on you know the records where their flags this is equal to one anything above one is a duplicate so i'm going to pass this okay to another cte and i'll call it deep check you can call it whatever you want but uh this is the name i can think of at this moment now i'm going to select the data from here select from here i'm going to do select star where this deep flag okay first of all let me run it on remember we are we are working with the cte i have cte1 cte2 and now ct3 and i'm selecting from cte3 as long as you are calling this ct in one of those um you know queries you've written it's going to be okay because with the city you have to make sure that you you pass the name of the city in your next select statement okay so now i'm going to say select all of this where the jeep flag this flag is equal to one because those are the unique records okay now my data set is now down to 392 six six seven okay so this is what i'll consider my clean data for the cohort analysis you know what let me see where the record sorry where the d flag is greater than one i have about five two one five duplicate records by the data points i used in checking the duplicates okay so right now with this result set sorry let me take it back to go to sign this is what i want i'm going to hold this result set into a temp table because now i don't want to keep calling uh the ct is like that because with the city you just can't run the select statement it's going to fail okay so i have to you know run everything together in one select before i can you know see my results i'm going to pass this into a temp table and i'm going to call the time table online retail probably made remember this is just a local time table if i want it to be global time table i'll just patch double um what is it called hash sign okay so i'm going to pass the data of the clean data set into a time table i'm going to call that online retail name okay so let's run this all right so this clean data can be seen here you see 3926x7 rules are connected so now i can just select from this temp table without writing all the query on the top all right so let's see perfect so now we have a simple clean data set to be working with clean data begin cohort analysis now to create a cohort analysis the following data points or labels are required right you need uh the unique identifier unique identifier for the group that you're about to make the analysis on right for example it's our unique identifier so in this case our unique identifier is the customer id okay these are required data cohort analysis you also need the initial start state initial start date in this case since we are doing a retention cohort analysis we are going to use the first invoice date okay wow what am i typing first invoice date first invoice date ask the initial start date you can remove this okay now this is um going to help us come up with a cohort group like this is that the first of the first month or the first day that the customer initiated a transaction on your site okay then we also have to see um you know the revenue data typically that's what you need for the cohort analysis so any data that is linked to the patches like any data length of the pages whether it's the quantity the price or the amount whatever but in this case i think i'm going to focus on the uh on the on the initial start date because we are trying to see uh the retention rate but yeah typically these are the data points required for the quote analysis so with that said we will start by creating our you know some labels so i want to see for this data set that we have when was the first time that a certain or a specific customer made a patches so now i'm going to create a cohort group for that so i'm going to select sorry i already have this listing here but let me just retype it okay from this table and i'm going to see for a given customer for a given customer when did they make their first batches so in this case the invoice date would be the fetches date because um i mean that is when you know the transaction was started so i'll say first purchase date of first invoice date okay and then um because i want to group the cohort i'm going to do this analysis per month so i don't care about the day the purchase was made i only care about the month the year and month so what i'm going to do is i'm going to do um create a derived column like a date function here in sequel to create a derived column what i'm going to do is i'm going to get the year of the first patches the month of the first pages and then i'm going to pass one as uh the day of the purchase so in this case the main date i need the year and then the main date i need a month and i'm going to call this the cohort date okay and let me write well because i did the aggregate function here i need to put the customer id into a group by so i do buy that and let's see what we get perfect so this customer made the first species in december 2010 okay and this is just the derived column i created the only thing that is different is the day instead of 20th i said this first because i'm just going to group the data per month and yeah okay all right so it's looking good i just want to put this whole result set into another 10 table and i'll call it i mean the name doesn't matter i call it cohort so i'll create this perfect so right now i have two tab tables i have um my cohort uh temp table and i also have the online retail so let me see how that looks quickly i'll do star and execute okay so again why would you want to do a cohort analysis right the main reason why you probably want to do a cohort analysis is to understand the behavior of the customers that um you know do business with you you want to see the patterns and the trends of uh you know uh of a group now when we say a cohort a cohort is basically a group of people with you know common characteristics if a cohort is a group of people with a common characteristics or something in common then what is a cohort analysis okay a cohort analysis is simply an analysis on several different cohorts so in this case a group of customers that i have here i just want to better understand their behaviors their patterns and their choice so in this case the type of cohort analysis that i'm trying to do on this um you know demo is um a retention based analysis okay because depending on the type of cohort you have your analysis will be different because with a cohort you can have a time-based cohort a size based cohort and then a segment-based cohort whatever we are doing right now is a time-based cohort i'm just looking at the first uh the time that um certainly for people you know purchased or did something on my work on my on my site on my product and see their behavior after that first instance of activity okay so i'm using the time but you can also do a size based cohort you group your customers or your you know yeah your customers into the bucket where you're looking at these customers with the higher patches these customers with smaller patches you see their trends so they can understand their lifetime value what we call the ltv okay so in that case you want to be doing some cumulative you know analysis on them right now we are trying to do retention analysis so with cohort you can do a retention analysis cumulative analysis you can even do i think uh survivorship analysis and all that okay so whatever we're about to do is just retention analysis now that we have our uh our uh cohort group okay the the the date here is giving us the court uh month right the next thing we want to do is to create the cohort index now what is this cohort index basically is an integer representation of the customer stage in the lifetime of the of the process basically a number that represents the number of months that has passed since the customer's fast patches okay the integer represents the number of months that has passed since the customer's first patches that is what we're about to create as an index okay so to do that i'm going to join two tables i'm going to join my online table i'm going to join the the cohort table because i need the invoice date from this table and i need the course date from this table to to come up with a cohort index okay so what i'll do is that i'll just copy this line here i'll just select from here and i'll call this name and i'll do a left join to this table here this is a temp table and i'll call it c and i'll say join on m.customerid sorry n dot customer id is equal to c dot customer id so what i can do is in place i'll do m dot star i want everything from the m table but from the c table do i want everything c dot i just need a cohort date and then everything else i'm about to derive it so what i want from here is that i need the year and the month from two different dates so this is what i'm there's what i mean m.year from oops end of year from the invoice date okay and i'll call it invoice yeah invoice here and then i need sorry what have i done here interesting i thought okay now over here i did month into bracket and dot uh invoice date and i'll call this invoice month and then now i need to use my c table here i call it c dot i think it's cohort date sorry i need a yeah yeah and this is cohort yeah and this is going to be month c dot co hard to work for date and that would be just this okay let me run this and see all right so i see that the query is done running and we are still returning our original records 3926 okay all that we have done is that we have just joined the data and we have calculated a few things we have derived like i said we we use the date part function and uh we took the year and the month from some specific date so from here we took the year we took the month now taking the year from the cohort and the month from the co-work the next thing that i want to do is that i need the the year difference in the month difference to get me to the formula where i can you know create a cohort index so what i will do is that i will select all of this and i'll create a safari i could have done this simply in this uh you know inner query here but i just want it to be much cleaner that's what i'm doing this upgrade here but you can do whatever you want whichever way is easier for you so right now i'm going to select this i'll call it mm you can call it anything at this point nm.star sorry and then i'm going to do um um a year death year difference okay year difference and that is going to be equal to the invoice year minus the cohort here okay and then i'm also going to do a month difference month if okay that's also going to be the invoice month okay the invoice month minus the cohort mark over this part okay all right let's see how the data looks now all right so all that we have done now is that we are taking the the year from here and you are subtracting this year from that again we are taking this month and we are subtracting it from that okay it is getting us closer to the you know the all the data points or variables that we need to calculate our index okay so i think the final piece is uh here in terms of getting the cohort index i'm going to hit ctrl r just to remove the you know the message sorry just to remove this uh message pane here at the bottom ctrl r so now i'm going to go back to another subquery okay it all come together nicely so i'm going to say that for this query here don't miss yup sorry did i do from don't miss any parentheses what else is going to you know work out so here for lecture for mmm so select everything from mmm dot star that is everything and now this is the formula to create your cohort index cohort index i'm going to type call out index what you do is you take your year difference okay we have 12 months in the year so you take your year difference then you multiply it by 12 then you add your monthly difference and you add one okay plus one now this formula should give you your cohort index okay like i said the cohort index is basically an integer representation that helps you to determine the number of months that has passed since the customer first made a purchase offers did an activity or transaction from your site or from your you know business okay so now this is going to assign some index to each individual transaction in the data set so let's run this and see okay so whatever we are seeing here is saying that for this customer okay they appear to have made the index one okay the index one here means that this customer made their second purchase or their next pages in the same month they made their first pages we can prove it in a bit let's copy this uh let me go back to the main data source from what do we call it this table uh customer id is equal to select star and probably i have to order by followed by invoice date okay invoice date and let's take this copy that let's just focus on only that here for customer id let's go to this like i said the one here means that this customer made their list patches in the same month they made their first patches okay according to the data set they made their first purchase in december 2010 and then they made your second pages again in december 2010.
all right so since i did the order by invoice let's see their first purchase since i did the order by invoice date descending order then minimum purchases definitely this one december 2010 on the seventh if i keep scrolling down seven you see they made another purchase on december 13th okay and again on december 20th okay so this customer made multiple purchases in the same month that is what this index here is telling us and again they also made the pages in the next month after the you know first patches and we can see that clearly from here january 2011 okay so this is what the index has done it has given us the how many months that has before the customers first pages for this uh customer nothing passed they made the same uh their next pages in the same month they made their first patches all right so i'm going to comment this out because i want all the records because i'm going to put again all the results set into a temp table i'm going to call it cohort retention okay so i'm going to execute oops i didn't mean to do all that control r all that i want to run is this part of the query okay so now let's see how it looks i think we are the point where we can extract this data and make it ready for tableau okay exactly this because the necessary i'm going to perform here is just to show you how to do the cohort retention table in sql but i also want to demonstrate that in tableau so so with the tableau piece this is the final point where you want to extract the data so you want to right click on here and you say save results as now i'm going to save this results as um csv and i'll call it cohort retention okay csv and i'm saving it in my folder here so i hit save and i should get yep this is it callback retention so i have it here right now all right now that we have the file saved we are ready for the tableau piece because we're going to use tableau public but for now let's continue all we need to do next is to take this data set and find the unique or the distinct customers okay distinct customer id their cohort date or cohort month okay cohort month look over date and then your cohort index because we're about to pivot this data index okay if i run this okay so for giving this customer let me order by customer id not necessarily required but let's do this order by one here quickly so given this customer they made a purchase in the first month they made their first patches and then after that they came back after nine months i believe after eight months had passed whatever maybe not if i did the order buy i would see that it came back in the second month and the fifth month and all that all right maybe if i did the order by this i'll know i'll i'll be better i'll give it especially better all right so maybe this and three okay so all that we see here is we're giving this customer here okay they made a patches in the first month in which they made their very first matches they made it another purchase in the second month after their first purchase and they skipped the third and the fourth and they came back on the fifth one okay so they are kind of a returning customer all right now there are some of their customers they made their first pitches and never showed up yep all right so now let's pivot this and let's see how many customers returned in a given cohort month all right so what are these i remove the order by not required so i'll say select we are about to do a pivot so now just give a header favorite data to see here you see the overt table all right so i'll say select from this okay and that would be my uh t or whatever table i'll say tbl okay select star i'm trying to create a pivot so select style from tv and i'll say pivot if you're familiar with sql pivot you know you have to pass in an aggregate function here so in here i'm going to do a count of my customer id i'll say customer id for the index okay oh no it's customer id right for cohort index in first of all ctrl r yes in case you don't know how many records are in the course index how many distinct values make up the coverage index let's find out quickly we have 13 okay so i already have a i already wrote it down because i know this it is already there are 13 distinct cohort uh index so i'm going to pass that you need those unique ids for your pivot all right i'm going to say in this all right control sorry control r bring this back here just to organize the query simply i'm saying let me give this a name as a vegetable yep and uh i think i'm done with my pivot table i'm selecting from this table into uh this and run this part okay as i run that i'm saying that here is this data for this indexes here all right let's run this and see oops i want to have my results in a grid not as uh as a text see at the top here that's why my data is showing like this i have to click on this here and this again okay so given a a a cohort then well let me order by order by cohort date order by one okay so ctrl r this is the whole query for the pivot select all of this and execute okay so given the cohort month of december 2010 we said the base meaning uh the total number of customers that showed up in that month were 885. now out of the 885 324 returned in the next month okay and so on all right over here too we have uh december sorry um let's say july 2011 188 customers did a transaction and out of those 188 34 did transaction the next month again and so on okay so this is what this table here means within the 13 months okay here this 13 months that we have that is the cohort index that i have here within the 13 months we have customers that made the purchase for a given cohort so the number of uh customers that made their first purchase in december 2010 were eight eight five okay now out of the 885 we had a repeat customer of 324 for the next month that is what this means okay now i think i want to um convert this to ratios or to rates so i want to you know convert this to uh percentages just to know that okay if this represents 100 what is the percentage of customers that showed up the next month let's say 50 24 that makes it easier to you know you know read so what i want to do is i i want to pass i'm going to use the same results for that ratio so i'm going to pass this pivot into i've done a lot of time tables today into a time table called cohort pivot okay so if i run this there shouldn't be any no i don't have to run that with the order by clause then i can select this part here and it's a key all right i have 13 rules so now i can just select this instead of right running the whole pivot table again i'll just say select from here and now order by is the same data just making it easier on me perfect okay so now i have a query already prepared for this for the ratios all that i'm going to do is that i'm going to take given a particular you know cohort index okay the cohort period or index 1 and i'm going to divide by the base so for all the cohort ones the first period is considered the base because we consider those uh periods as the first time uh a transaction was initiated for that particular cohort month okay so for this let's say april 2011 one is the base because we are saying that 300 people showed up for this month and out of the 300 people that showed up 64 returned right 161 returned 63 came back again okay so one is going to be the base for all of these all right so i'm going to say divide this if you divide this you should get one i mean 100 okay it's over here but because i want to get it in a ratio format i'm just going to do 1 times 1.0 times that let me see what i get okay perfect and then i'm going to multiply this results by a hundred one is a whole number here but it's uh one here is representing hundred percent but i want to convert that to percentages so this is hundred percent and this is exactly what i want okay so i'm going to do repeat this okay for what was it called just change this to two okay but the base will always be one like i said the b so i'll take the second one and now we use the base as one to know how many records uh how many customers came back in terms of percentages so basically 36.6 36.6 percent came back uh then this month to make a purchase after the first month okay so since this is the base that's how come all of them a hundred percent it's like eight eight five divided by eight eight five right forty one divided by forty one so this represents one hundred percent that is the base all right i already have a query for that so um i'm only going to copy that part i don't need to type all of these out like that so i'm going to just um replace everything here ctrl r and then i'm going to remove the star and i'll put cohort 8 and that's basically it that's basically it so at first i had it as uh let me run these two together so let's now run these two together and i'll show you i had this as a just a table uh records here no ratios and now i have this in percentages so basically it's the same thing presented in different ways so now this is how you can you know so i hope you understand how to interpret this this is representing the base so this is the number of records that showed up for a given cohort month and how many of these numbers that showed up for a given cohort month came back the next month and the month after the next and all all that okay and this is uh you know the racist you see a lot of years here there was no customer returning on this month index here so there we go now this is the end of the sequel part the next thing we are going to do is that we are going to go to tableau public and then we are going to visualize this in tableau okay as we see this is a lot of numbers here it will be easier if you visualize it with tableau all right so the next thing we'll do is that we would minimize this and go to tableau public remember we already extracted the data we are going to use in tableau to a csv so i'm going to minimize this and if you do not have tableau public just go to i'll share the link in the description below just go to this link and you know download the app it would ask you for your email okay now once you pass in your email it should give you the opportunity to download tableau public it's free but just that it has limited data sources to to use you can also use tableau desktop okay but that would not give you access to you know publish it and share it with other people it would only remain on your desktop if you don't have it licensed okay so we are going to use tableau public i already have this installed and all that so if you don't have it downloaded install it and then follow along so if you are using windows type in your search tableau public i as i click on it it's loading on my other screen but i'll i'll bring it to my this is it this is how it opens it just shows some of your recent dashboards that you've worked on what i'm going to do is i'm going to click on the text and i'm going to go to my folder this is the file that i just saved okay cohort retention and i'm going to go to open let me minimize make this bigger so now that i have my cohort retention open let me just preview the data quickly all right so it says we have 392 666 records and then we have 17 fields okay all the fields that we have created it can be seen here here up to our cohort index column all right now let's go to the sheet that's where we're going to build a worksheet you know the first thing that we would do is that we are going to um create a calculated column and the calculated column just like i did in sql you know i did um what was it uh a distinct distinct um custom account right that is exactly what i'm going to do here so i'm going to do calculated field and it pops up on my other screen and i call it number of reverse and this number of records is just going to be account distinct count d of my customer ids and basically that's it and now i'm going to convert my cohort index to a dimension and then for the cohort date let me just create a copy duplicate that's what you call it and then i'm gonna make this sorry make this uh change the data type to string okay and i'll call this and i'll rename this rename to cohort code period how about that okay so i'm going to use the cohort period here in my rows and then i'm going to drag my cohort index where did i put that cohort index here to the columns nice so just like we saw in sql the only thing left is that i have to drag my number of records to the text look at that look at that it's looking good already so what i'll do next is that i'm going to duplicate sheet one so that i can use sheet one for my retention rates table and i'll keep sheet two as uh just the cohort table just like it is right now so i'm going to say uh duplicate and then i'll just focus on sheet one what i'll do next from here is that i'm going to drag and drop let me convert this to percentages now uh percent of total and then i'm going to drag and drop that onto color and i'll change the color to i'll change the the automatic to square and now i have to drag and drop the number of records back here but this time i'm going to convert it again back to present total okay this is looking good already all i have to do next is i have to change the color just like i demonstrated i think it was a red green or something i don't remember but um red red gold apply let me see yeah this is it this is what i had used so i'm going to change this to entire view i'll probably hide you know i'll keep it and call this uh cool port retention rate i'll hit apply and i hit okay and i just copy this for my sheet name as well i think if i had changed the sheet name i would probably get it as a sheet header as well all right so this is looking good let me probably enlarge this piece here so i can see the cohort period and if i should change anything here let me probably do a formatting and center my uh fault look at that it's looking good going to make anything bold um let's see let me keep it like that let me keep this all right let's go to the next one so over here this is just going to be the numbers i don't have to do much here i'm just going to i'm just going to convert this to percentages because i want sheet1 to look like this more red if i don't convert it to percentages it won't look more right because the numbers in various right so what i'm doing now is that i'm going to convert this to the send total i'm going to drag that to color again and now i'm going to go back to sorry sweep slip steps what did i do i'm going to close this now drag and drop numeric sorry number of records back into text oh what happened change this to square again and now i can change the color from here red gold is what i had used apply is looking good and again i'll do entire view and what did i call this let me just call this um cohort table all right so here too i just probably would want to center the uh the numbers how much go to text and i'm gonna go to center maybe i'll have to do the bold again like i did the other one yeah yep i think i don't want to hide this i'll keep this as this and i have two different tables now i can build a dashboard with this because now this is a worksheet if i want to present the two chats at the same time i want to click on dashboard and change the size to automatic and now i have to drag and drop these on here probably side by side this is good let me minimize this a little bit really what's going on here i'm not sure why i do not see you know what let me change this to two decimal one decimal place or probably no decimal places at all this is how to do that change this to percent no decimal place all right let me see how my dashboard looks all right this looks good well i could have given some color to the header or something but you know what this is not for you know the beauty of it i just want to show the rates and i already explained what the rates it means uh the number of people or the percentage of customers that returned to do business is what you see here so you have the actual number and you have the percentages as well so assuming let me just rename this to retention dash and as always now that you have this beautiful chat here if you want to um show this or present this to somebody else you can publish it to tableau public or you can change the color do whatever you want to do with it probably instead of using the red and gold for two different things maybe i could have used that yeah this is also not bad i don't know what you think but yeah we could do this too perfect i'll keep this now let's see how the chat looks yeah two different colors and if you wanted to publish it to tableau public you simply go to file and you say save to tableau public ask and if you have already signed in maybe i haven't let me just login quickly and then i hope it hides the password as i type it does all right stop signing out out look how about that so it's going to ask me to give it a a title i just want to call it cohort retention dash cohort 3 tension dash and i'll hit save all right so it's publishing i think once it's done it will open your your browser sorry i popped up my browser on another screen so this is it this is the link it's published yes and this is exactly what we had done in tableau you can give this header some background they could look prettier and nicer than i have but yeah this is our cohort retention dashboard i hope this session was useful or helpful to you uh if so please do like comment share and subscribe to my channel and i hope to catch you on my next video thank you for watching [Music]
Up Next

11:22
SaaS Onboarding UX Design: Key Strategies for Startups
@learnuxid
4.8K views•2024-09-15

12:54
Triumph of Orthodoxy Icon: Byzantine Art & History Explained
@BenCallan
2.1K views•2024-08-06

9:49
FastAPI vs Flask vs Django: Choosing the Right Python Web Framework
@TechWithTim
302.5K views•2024-05-26

1:42
Game of Thrones Opening Credits: A Cinematic Analysis
@gameofthrones
46.3M views•2011-04-18
Related Study Plans & Knowledge Roadmaps
Structured learning paths in General & Interdisciplinary Studies
general-studies
Elevator Engineering: History, Physics & Cities
01From Hoists to Safety Brakes: The Dawn of Vertical Lift
02Hydraulic vs. Traction: The Engineering Physics of Elevators
03Modern Speed, Safety, and Algorithms
+ 2 more learning modules
12h5 modules
Explore Roadmap
general-studies
Rubber: Material Science, History & Geopolitics
01Origins of Natural Rubber & Mesoamerican History
02The Chemistry of Natural Rubber & Vulcanization
03The Geopolitics of the Rubber Boom & Colonization
+ 2 more learning modules
12h5 modules
Explore Roadmap
general-studies
Containerization: Evolution, Logistics & Trade
01Ancient Trade & Bulk Cargo: Amphorae to Barrels
02The Industrial Revolution & Cardboard Packaging
03The Containerization Revolution: Malcom McLean
+ 2 more learning modules
12h5 modules
Explore Roadmap
general-studies
Textile Tech: Evolution, Labor & Global Impact
01Pre-Industrial Textiles: Handloom & Cottage Industry
02Mechanization: The Spinning Jenny to the Power Loom
03The Factory System & Global Labor Transformation
+ 2 more learning modules
10h5 modules
Explore Roadmap