To run a Celestia light node, first install Docker, then create a node store directory, initialize the node store and generate a key (with public address for identification and mnemonic for security), and finally start the node using the provided command, which may require retrying due to a known bug.
A Step-by-Step Guide to Running a Celestia Light Node with Docker
Added:Deep Dive
Basic understanding of containerization and Docker fundamentals, including images, containers, and volume mounting.
Learn Docker in 1 Hour | Full Docker Course for Beginners
728.3K
Docker was created in 2013 to solve compatibility issues like 'it works on my machine' problems and managing different Node.js versions. It's a platform enabling development, packaging, and execution of applications in a unified environment. Major companies like eBay, Spotify, and Uber adopted Docker, with Uber reporting developer onboarding reduced from weeks to minutes. Core concepts include images (lightweight standalone executable packages containing code, runtimes, libraries, and operating systems) and containers (runnable instances that execute image instructions). The architecture consists of three parts: client (user interface for issuing commands), host/Daemon (background process managing containers), and registry (centralized storage like Docker Hub). Volumes provide persistent data storage shared between containers and host machines, ensuring data durability even if containers are removed. Networks enable communication between containers and the external world while maintaining isolation. Key Dockerfile commands include: FROM (specifies base image), WORKDIR (sets working directory), COPY (copies files from build context), RUN (executes commands during build), EXPOSE (informs about network ports), ENV (sets environment variables), ARG (defines build-time variables), VOLUME (creates mount points for external storage), CMD (provides default command), and ENTRYPOINT (specifies default executable). Running containers involves pulling images with 'docker pull [image-name]' and running them with 'docker run [image-name]'. Port mapping allows exposing container ports to the host machine using the '-p' flag. Volume mounting allows changes made to files on the host machine to be reflected inside the running container using the '-v' flag.
Click to watch →

Introducción a contenedores con Docker + IA Generativa con Gisela Torres
52.2K
Containers are ephemeral by default, meaning all data stored inside them is lost when the container is stopped or removed. This is problematic for applications requiring persistent data like databases. Docker volumes solve this by providing storage that persists beyond container lifecycles. Volumes are mounted to specific directories using the `-v` flag: `-v [volume_name]:[container_path]`. Volumes are managed by Docker and stored on the host machine, separate from the container's file system. Volumes can be reused across multiple containers, allowing data to persist even when containers are recreated.
Click to watch →

Уроки Docker для начинающих / #3 – Контейнеры и образы
147K
In Docker, an image (or 'magic') is a ready-made solution containing specific functionality. Images cannot be modified directly; they must be downloaded from a registry. A container is created based on an image and represents your custom project built upon that pre-configured foundation. The image provides the necessary tools and environment, while the container holds your actual application code and configurations.
Click to watch →

Docker For Open Source Contributors - Part 2
117.8K
This section addresses the data persistence problem in Docker containers. When containers are destroyed, all data inside them is lost. The solution is Docker volumes, which provide persistent storage that survives container destruction. The instructor demonstrates volume mounting using the -v flag with the syntax -v <host_path>:<container_path>. This creates a bidirectional link between host and container directories. The instructor also shows how to create custom volumes using 'docker volume create' and explains that data stored in volumes persists even when containers are stopped or removed, allowing applications to resume their work after container restarts.
Click to watch →

Aprende Docker en 14 minutos 🐳
293.9K
When developing applications in Docker, use volumes to mount host directories into containers for automatic file synchronization. This allows code changes on the host to appear immediately in the container without rebuilding. The syntax is 'docker run -v <host_dir>:<container_dir> <image>'. Containers run application processes (like Apache), and if the process fails, the container stops. This workflow enables efficient development while maintaining containerization benefits.
Click to watch →
Deep Dive
Familiarity with command-line interface (CLI) operations, terminal navigation, and basic system administration.
เรียนรู้ Command Line คำสั่งพื้นฐานสำหรับผู้เริ่มต้น | 2024
33.6K
Command Line Interface (CLI) is a text-based user interface where users type commands to instruct computers. The shell acts as a translator between user commands and the operating system. Windows Command Prompt (cmd) and PowerShell are the primary interfaces, while Linux and macOS use Terminal. Basic navigation commands include 'dir' to list files, 'cd' to change directories, and 'cd ..' to move up one level. Users can navigate by drive letter (e.g., 'd:'). Tab completion helps auto-complete folder names.
Click to watch →

Basic Command Line Interface — Modul 5
111
Command Line Interface (CLI) is a text-based method for interacting with computer systems, valued for its speed and efficiency in Linux administration. The terminal prompt displays [email protected] directory structure. Essential commands include 'whoami' for current user, 'hostname' for system information including virtualization and kernel details, and 'pwd' for current directory. Linux systems have privilege levels: regular users for basic operations and root for administrative tasks. To perform admin tasks, use 'sudo' before commands or switch to root mode with 'sudo su'.
Click to watch →

Ask an Expert: How to use command line (basic tutorial)
2K
The command line (CLI) provides the most direct way to interact with computers across Windows, Mac, and Linux platforms. Unlike GUI interfaces that act as intermediaries, CLI allows direct communication with the computer, offering greater control and access to system capabilities. CLI is essential for developers regardless of their specialization, as it enables tasks like installing packages, cloning repositories, and setting up development environments. Access methods vary by OS: Mac users search for 'Terminal' in Spotlight, while Windows users can use PowerShell or CMD. Installing WSL (Windows Subsystem for Linux) provides a nearly identical experience to native Linux environments. Mastering file navigation is fundamental to CLI proficiency. Key commands include pwd (print working directory) to show your current location, ls (list) to view directory contents, and cd (change directory) to move between folders. The file system is organized hierarchically from the root directory (/), with the tilde (~) representing your home directory. Creating and managing files and directories forms the foundation of CLI file manipulation. Use mkdir (make directory) to create new folders and touch to create empty files. Tab completion automates filename entry by pressing Tab, cycling through matches when multiple possibilities exist. Shell scripts automate repetitive tasks by storing commands in text files with .sh extensions.
Click to watch →

Dear Newbz: Are You Ready For A Pinephone? Depends.
976
The command line interface (CLI) provides a powerful method for interacting with computer systems through text-based commands. Learning basic CLI operations enables more efficient system administration, software installation, and troubleshooting tasks compared to graphical interfaces.
Click to watch →

Introduction to Git | Workshop | Blueprint 2026
107
The Command Line Interface (CLI) allows computer interaction through text-based commands rather than graphical interfaces. Different OS provide different CLI tools: Mac/Linux use Terminal, while Windows offers PowerShell or Ubuntu (WSL). Essential commands include 'mkdir' to create directories, 'ls' to list contents, 'cd' to navigate folders, and 'pwd' to show current directory path. Navigation follows hierarchical paths, with 'cd ..' moving up one level and 'cd' with no arguments returning to home directory. The terminal provides error messages for invalid operations like non-existent directories. Avoid spaces and special characters in filenames since CLI treats them as command separators. Understanding these fundamentals enables efficient file management directly from the command line.
Click to watch →
Deep Dive
Fundamental concepts of blockchain architecture, specifically the functional differences between full nodes, validator nodes, and light nodes.
Ethereum для начинающих. Урок 1. Основы блокчейна.
71.2K
Blockchain networks have two types of nodes: (1) Full nodes store the complete blockchain including all transaction data from every block, providing a complete historical record of all transactions, and (2) Light nodes (or SPV nodes) only store block headers and Merkle tree roots, not the full transaction data. Light nodes are designed for devices with limited storage (like mobile phones) and can still verify transactions by requesting only the specific Merkle proof needed to confirm a transaction's inclusion in a block.
Click to watch →

Знакомство с Blockchain. | Amir Capital
14K
Full nodes are computers connected to the blockchain network that store the entire history of the blockchain, including all transactions since 2008. This data can be tens of terabytes in size. Full nodes verify all transactions and maintain the complete ledger. Light nodes (or simplified payment verification nodes) are devices like smartphones that store only the headers of blocks rather than the full transaction data. This makes them much smaller and more efficient while still allowing participation in the network.
Click to watch →

Михаил Рахманов – Blockchain simplified
1.5K
In blockchains like Bitcoin, full nodes store the entire blockchain and can validate all transactions independently. Light nodes (SPV nodes) only store block headers and rely on full nodes for transaction verification. Full nodes are necessary for mining and complete validation, while light nodes can participate in the network with less storage requirements.
Click to watch →

10 Academy Guest Talk - The Building Blocks of Web3 - Yabebal Fantaye
139
Blockchains support different types of nodes with different capabilities: (1) Full Nodes - store the entire blockchain history (can be terabytes in size), can verify all transactions independently, and participate in consensus; (2) Light Nodes (SPV - Simplified Payment Verification) - store only a small portion of the blockchain (like Merkle tree roots), can verify specific transactions without downloading the full chain, but cannot participate in consensus. Full nodes provide the highest level of security and privacy, while light nodes enable mobile and low-bandwidth access to the network.
Click to watch →
Blockchain Fundamentals by Prof Syed Imtiyaz Hassan I Part 1/3 I IMC MANUU
104
There are two types of nodes in a blockchain network: Full Nodes and Light Weight Nodes. Full nodes have the complete copy of the entire ledger. Light weight nodes only store the headers of blocks and are connected to full nodes. Light weight nodes are typically used on mobile devices where storing the complete ledger is not feasible. When verifying transactions, light weight nodes depend on full nodes.
Click to watch →
Deep Dive
An introduction to modular blockchain theory, specifically Celestia's role as a Data Availability (DA) layer and Data Availability Sampling (DAS).

Celestia (TIA) Analiz
8.5K
This comprehensive segment introduces Celestia, a modular blockchain project built on Cosmos SDK. The video explains that Celestia positions itself as the first modular blockchain, though other modular blockchains existed before. Key metrics include: total supply of 1 billion tokens, circulating supply of 270-280 million (30% circulating percentage), and a market cap of approximately 3.5 billion dollars. The project uses proof of stake with initial inflation around 10% decreasing to 11% annually. The four-layer blockchain architecture is explained: Transaction Layer, Communication Layer, Consensus Layer, and Data Layer. Celestia's core innovation is providing the consensus and data layers as a service to external developers, allowing them to build blockchains using any technology stack (EVM, Polkadot, Solana) without managing the underlying infrastructure. The data layer uses data availability sampling (DAS) and is currently stored on Amazon servers, which the video notes as a potential negative from a crypto philosophy perspective.
Click to watch →

Celestia (TIA) Crypto Overview: Data Availability Layer for Modular Blockchains
6.4K
Celestia is a modular blockchain infrastructure project that separates data availability and consensus from execution and settlement layers, enabling developers to build custom blockchains by selecting their preferred settlement layer, execution environment, and utilizing Celestia for data availability and consensus. This modular approach allows for dozens to thousands of specialized blockchains tailored to specific purposes, with the TIA token serving as the native currency for data publishing, staking rewards, and governance participation.
Click to watch →

Three Crypto Pioneers on Crypto’s Monolithic vs. Modular Debate - Ep. 589
17.1K
Celestia is the first modular blockchain network with a unique property: it can scale with the number of users and nodes. Its core value proposition is enabling anyone to deploy custom blockchains. The modular approach splits functions into component protocols optimized for specific tasks, enabling permissionless innovation where anyone can build custom execution or data availability layers.
Click to watch →

Modular Blockchains and Data Availability with Celestia
16.8K
Celestia is the first modular blockchain network that separates the four core components of blockchains—execution, consensus, data availability, and settlement—allowing developers to choose their own technologies for each layer. Unlike traditional monolithic blockchains where validators handle all layers, Celestia focuses exclusively on consensus and data availability, enabling sovereign roll-ups with custom execution environments and settlement layers. Celestia achieves data availability through erasure coding (using Reed-Solomon's algorithm) and data availability sampling, where light clients can verify data integrity by randomly sampling transactions, providing exponential security improvements while maintaining scalability regardless of block size.
Click to watch →

Celestia Airdrops Will Make You F*CKING FILTHY RICH In 2024!
28.2K
This segment introduces Celestia as a modular blockchain that makes it easier and cheaper for new projects to deploy rollups and blockchains. The video explains that Celestia provides data availability services, with Manta Network saving over 99% in fees by using Celestia instead of Ethereum. The speaker reveals that Celestia's founder was part of the LC hacking group that hacked the CIA when he was 16, demonstrating technical capabilities. The segment discusses the prediction that as EIP-4844 reduces gas costs for layer 2 networks by 90%, many layer 2 projects will migrate to Celestia for data availability, as projects competing for users will want the cheapest fees possible while maintaining security and interoperability.
Click to watch →
Prerequisite Knowledge
- Concept 01Basic understanding of containerization and Docker fundamentals, including images, containers, and volume mounting.
- Concept 02Familiarity with command-line interface (CLI) operations, terminal navigation, and basic system administration.
- Concept 03Fundamental concepts of blockchain architecture, specifically the functional differences between full nodes, validator nodes, and light nodes.
- Concept 04An introduction to modular blockchain theory, specifically Celestia's role as a Data Availability (DA) layer and Data Availability Sampling (DAS).
Subsequent Learning
- Step 01Monitoring and maintaining the light node's health, peer connectivity, and resource usage using tools like Prometheus and Grafana.
- Step 02Securing the node's environment, including private key management, wallet backup procedures, and configuring secure RPC endpoints.
- Step 03Integrating the running light node with modular rollups (such as OP Stack or Arbitrum Orbit) to submit and retrieve data from Celestia.
- Step 04Advanced container orchestration, such as deploying and scaling the light node within a Docker Compose multi-service architecture or a Kubernetes cluster.
Setup & Init
Start Node
Setup & Init
0:00Playing Section
- 1
Guide to run Celestia light node via Docker.
- 2
Create node store and initialize key with mnemonic.
- 3
Access official docs for prerequisites like Docker.
The Security, Performance, and Centralization Risks of Containerized Light Nodes
While running a Celestia Light Node via Docker simplifies deployment, critics highlight significant architectural and security trade-offs. First, containerization introduces overhead and supply chain vulnerabilities, as users often rely on pre-built images from centralized registries like Docker Hub. Second, hosting these nodes on centralized cloud providers (such as AWS or Google Cloud) undermines the core goal of blockchain decentralization. Finally, an over-reliance on light nodes can create a false sense of security. Light nodes only perform Data Availability Sampling (DAS) and cannot validate state transitions. If a network lacks a healthy ratio of independent, bare-metal full nodes and instead relies on identical Dockerized light clients hosted on centralized infrastructure, it remains highly vulnerable to systemic cloud outages and consensus-level attacks.
Deep Dive
Monitoring and maintaining the light node's health, peer connectivity, and resource usage using tools like Prometheus and Grafana.
Monitoring Linux Host Metrics with Prometheus | Node Exporter (Setup, Scrape, Query, Grafana)
32.5K
The Node Exporter is a Prometheus project that exposes Linux/Unix host metrics by running as a standalone binary, which Prometheus scrapes and visualizes in Grafana, enabling monitoring of CPU, memory, network, and disk usage through metrics prefixed with 'node_' and requiring the rate() function to calculate meaningful usage rates from cumulative counters.
Click to watch →
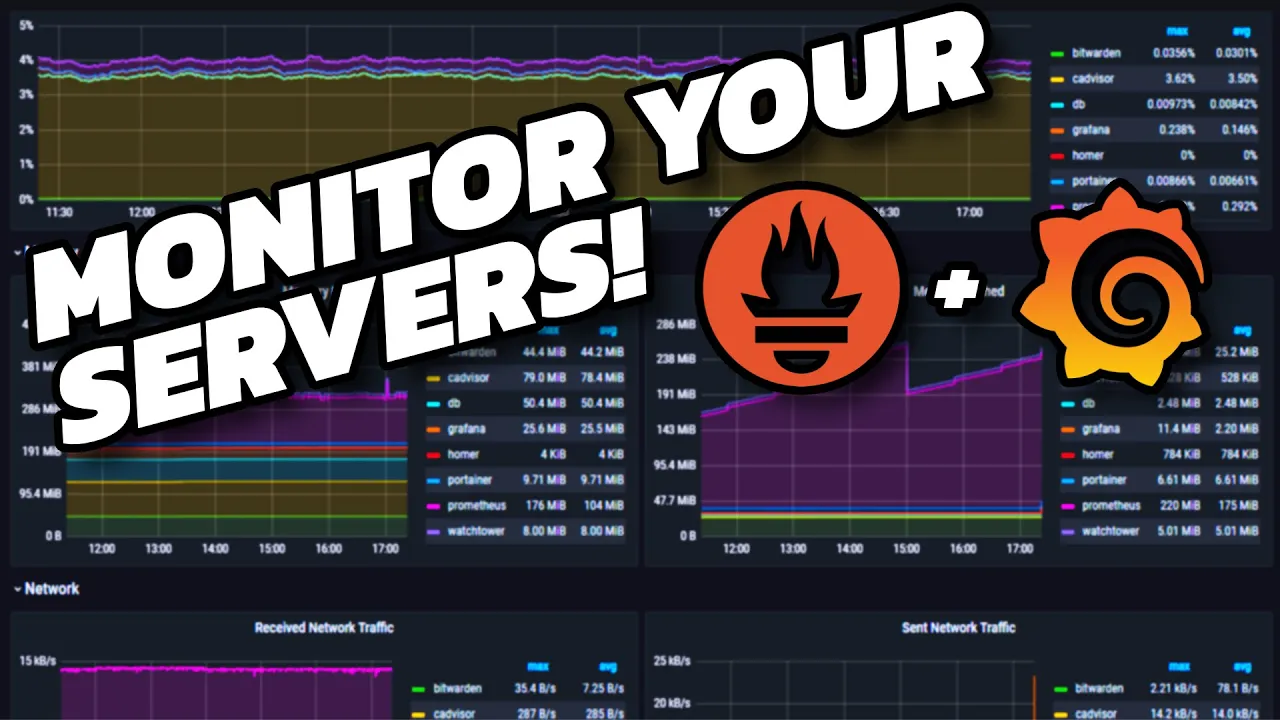
Server Monitoring // Prometheus and Grafana Tutorial
807.6K
Prometheus is an open-source monitoring system that collects and stores metrics from various targets (servers, containers, applications) through a scraping mechanism, while Grafana provides visualization capabilities to create customizable dashboards for monitoring server health, resource utilization, and performance metrics; together they form a powerful centralized monitoring solution where Prometheus handles data collection and storage, and Grafana enables intuitive data visualization through its query language and dashboard builder.
Click to watch →

monitoring with Prometheus and Grafana - a quick introduction
61.4K
Prometheus is a time-series database that scrapes metrics from various sources (like Kafka via JMX exporter, Linux OS via node exporter, and custom Java apps via gauges) to monitor system health, while Grafana provides visualization capabilities to create unified dashboards that help correlate metrics across different components, enabling proactive system monitoring and troubleshooting.
Click to watch →
Monitoring using Prometheus & Grafana | ADAM Wezva Technologies | 78296 33132 #trending #new #devops
82.7K
Prometheus is a time-series monitoring tool that collects metrics from targets (machines, applications, containers, or Kubernetes clusters) using exporters that expose endpoints, while Grafana provides visualization dashboards for the collected data; together they form a complete monitoring solution that includes data collection, visualization, and alerting capabilities.
Click to watch →
TUTORIAL Monitoring Server Menggunakan Grafana dan Prometheus
81.2K
This tutorial demonstrates how to monitor server resources using Prometheus (a time-series database that collects metrics) and Grafana (a visualization tool). The process involves installing Prometheus and Node Exporter on a Linux system, configuring Prometheus to scrape metrics from Node Exporter (which monitors CPU, memory, disk, and filesystem), and setting up Grafana to visualize these metrics through customizable dashboards. Key steps include creating system users/groups, configuring systemd services for background operation, setting proper file permissions, and importing pre-built dashboard templates for efficient server monitoring.
Click to watch →
Deep Dive
Securing the node's environment, including private key management, wallet backup procedures, and configuring secure RPC endpoints.
5 - Rode seu Node Bitcoin - Canivete Suíço Bitcoinheiro
32.2K
Full nodes store sensitive wallet data locally, including the wallet file (wallet.dat). This file contains all private keys and should be backed up securely. If a hacker gains access to the computer, they could potentially steal funds if the wallet file is compromised. Users should make regular backups of their wallet file and store them securely, preferably offline.
Click to watch →
CHAINFLIP - УСТАНОВКА НОДЫ - TESTNET
989
This phase covers the critical configuration steps for node operation. Users create a dedicated keys directory and import the MetaMask private key. Node keys are generated and saved securely, and an environment variable is created for the node secret. Configuration keys are generated for node authentication. A configuration directory is created and opened for editing. The three essential configuration values are the node's IP address, the RPC endpoint, and the HTTP endpoint. The RPC endpoint is obtained by creating an application on the Alchemy website, then creating a network named 'test.net' within that application. The endpoint is copied and inserted into the configuration file, replacing the default values.
Click to watch →

Build & Deploy ICO PreSale (ERC20 Token) DApp | Solidity + Next.js | Binance, Polygon, Ethereum
1.3K
RPC URL and wallet configuration process: (1) Visit a node provider website (Infura, Alchemy), (2) Create and verify an account, (3) Navigate to the chain list and select the target blockchain, (4) Copy the endpoint URL for the mainnet, (5) Paste the URL in the environment variables file. Wallet configuration: (1) Access the wallet application (MetaMask), (2) Select the account for deployment, (3) Copy the wallet address, (4) Access account details and show the private key, (5) Copy the private key (must be kept secret), (6) Provide both the address and private key in the environment variables. The same wallet should be used for deploying both the token contract and the ICO contract.
Click to watch →
Украли деньги на собесе - Всеволод Золотов
40.9K
This segment covers configuration file security and RPC node vulnerabilities. The victim discovered that the test task code contained references to their local development environment, including database credentials and RPC node URLs. The hosts explain that configuration files may contain sensitive information that could be exploited. They also explain that public RPC nodes may be compromised or malicious, and that attackers can use these to gain access to the victim's system.
Click to watch →

Why Every Bitcoiner Should Run Their Own Node & How to Do It
455.7K
Bitcoin nodes include built-in wallet functionality: (1) You can send and receive Bitcoin directly from the node; (2) Generate new addresses (native segwit and taproot supported); (3) However, the node wallet does NOT store seed phrases - it only generates private keys; (4) Backup must be done through encrypted files saved securely; (5) The wallet provides a complete Bitcoin experience combined with full node capabilities. This integration allows users to manage their own funds while maintaining full network validation.
Click to watch →
Deep Dive
Integrating the running light node with modular rollups (such as OP Stack or Arbitrum Orbit) to submit and retrieve data from Celestia.
Addressing the fee problem that blockchains face with guest Eric Wall (Celestia spaces series Ep 2)
680
Two integration approaches: (1) Celestiums using Quantum Gravity Bridge—rollups operate on Ethereum with adjudication on Ethereum but post data to Celestia, reducing fees dramatically while maintaining security via sampling. (2) Submos—an EVM settlement layer running directly on Celestia, allowing any EVM-compatible rollup to fork onto it. Sovereign rollups operate directly on Celestia without relying on other settlement layers, offering more freedom and avoiding settlement layer social contracts.
Click to watch →

ZKV presents Privacy in Cosmos: Scalability Edition - Data Availability and Rollups Panel
410
To use Celestia for data availability, users run a Celestia light node and connect it with RPC to ensure all blocks are valid, then submit roll-up blocks to it. The overhead is minimal compared to running an Ethereum full node. Celestia can be viewed as a virtual machine for building blockchains, similar to how AWS provides servers. This could make building blockchains much simpler, potentially reducing the effort from multi-year projects to something that can be done with a button press, democratizing blockchain development.
Click to watch →
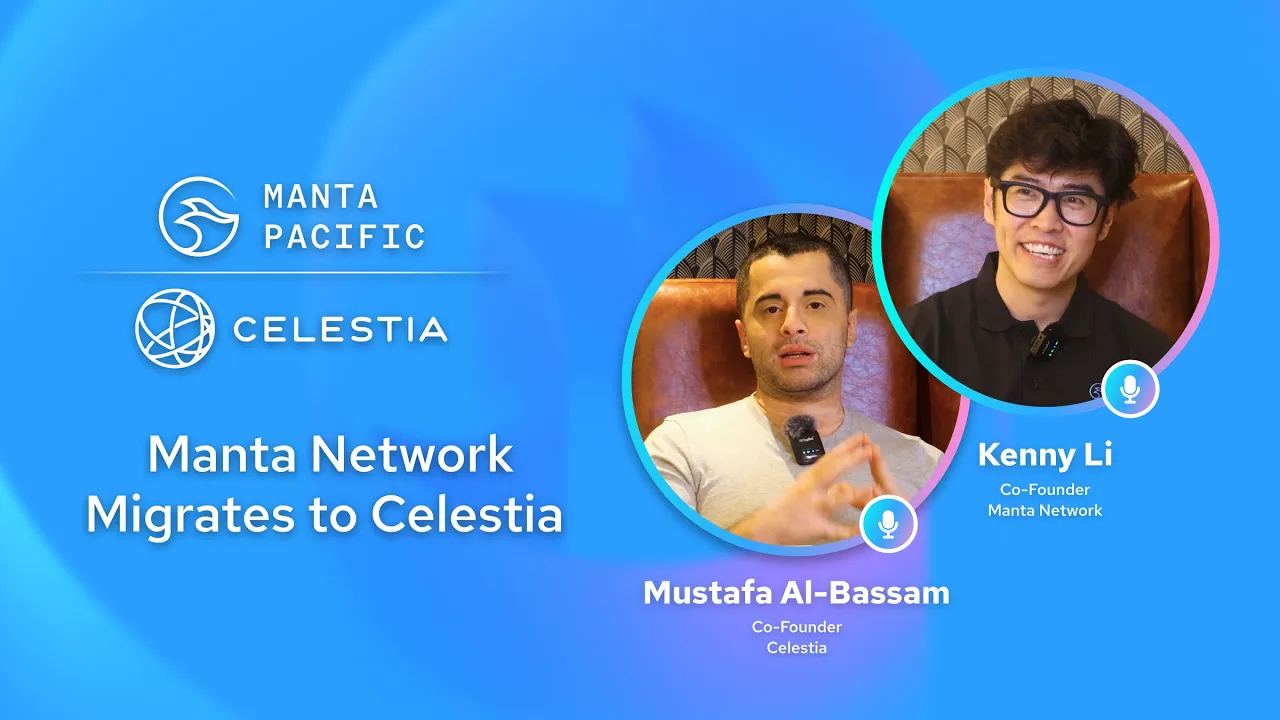
#MantaNetwork x #Celestia: Unleashing the Power of Modular L2 Chains (EVM & Beyond)
2.1K
Celestia provides 100x more data availability throughput than Ethereum (10 kilobits vs broadband era), enabling 100x cheaper gas costs for rollups. Manta Pacific became the first L2 to transition to modular DA, using Celestia as primary DA with Ethereum fallback for reliability. The integration includes OP Stack compatibility, enabling developers to deploy rollups using Celestia while maintaining fallback options. Celestia employs rigorous stress testing using tools like 'test BR' that simulate networks with 1,000 nodes. The long-term roadmap includes gigabyte-sized blocks, one million rollups, and one billion light nodes. Block size is expected to double annually: from 8MB to 32MB, then 100MB, eventually reaching 500MB to 1GB.
Click to watch →
Arbitrum Orbit x Celestia (Celestia whiteboard)
326
Arbitrum Orbit integrates with Celestia by publishing compressed transaction data to Celestia instead of directly to Ethereum, using Blob Stream for data availability verification and a pre-image oracle for fraud proof verification, enabling the same optimistic rollup protocol with interactive verification game while reducing data costs.
Click to watch →
Modular Blockchains and Data Availability with Celestia
16.8K
Every blockchain can be stripped down to two core features: consensus (agreement on ordering transactions) and data availability (ensuring transaction data is available for anyone to download and verify). These two functions prevent double-spend attacks by allowing anyone to see transaction ordering and data. Celestia only provides these two core functions, allowing Roll-Ups to decide their own execution environment and settlement layer. Roll-ups could have data withholding attacks by releasing only headers without full transaction data. Before Celestia, light clients could only verify block headers. Celestia solves this with data availability sampling, where light nodes randomly sample transactions to verify data is correctly encoded. This provides three properties: it's regardless of block size (complexity is squared, not linear), more light nodes increase security, and larger blocks can accommodate more light clients.
Click to watch →
Deep Dive
Advanced container orchestration, such as deploying and scaling the light node within a Docker Compose multi-service architecture or a Kubernetes cluster.

Domina DOCKER de CERO a PRO! (CURSO COMPLETO)
46.1K
Docker Compose simplifies managing multi-container applications by defining all services in a single YAML configuration file (docker-compose.yml). A single 'docker compose up' command can start all containers defined in the configuration, including their networks and volumes. Compose files have a strict YAML structure with services defined at the top level, each specifying image, ports, volumes, and environment variables. Environment variables can be centralized in .env files for easier management. Multiple compose files can be combined using the '-f' flag. This orchestration tool is essential for managing complex applications with multiple interconnected services.
Click to watch →
![Docker Tutorial for Beginners [ FULL COURSE in 3 Hours ] #dockertutorial #DockerForBeginners](https://i.ytimg.com/vi/iARL7iFyasE/hqdefault.jpg)
Docker Tutorial for Beginners [ FULL COURSE in 3 Hours ] #dockertutorial #DockerForBeginners
38.4K
Docker Compose simplifies running multiple interconnected containers using a single YAML file. Key elements include: version (Compose format), services (list of containers), image (container image), ports (host:container mapping), networks (network attachment), volumes (persistent storage), environment variables (configuration), and deploy (replicas). Services are started with docker compose up and stopped with docker compose down. Docker Swarm is a clustering tool for managing multiple Docker hosts as a single virtual system. It consists of a manager node (master) that controls the cluster and worker nodes that run containers. Swarm provides high availability through automatic failover, load balancing across containers, and automatic scaling.
Click to watch →

the Spring Boot end-to-end tutorial (new for 2025!)
446K
Docker Compose simplifies running multi-container Docker applications by defining services in a YAML file. It allows starting multiple services (like PostgreSQL and RabbitMQ) with a single command. The compose file specifies service definitions including ports, networks, and dependencies, enabling lightweight container orchestration without full Kubernetes deployment.
Click to watch →
Production Deployment on VPS using Docker | رفع تطبيق على استضافة باستخدام دوكر
71.1K
Docker Compose is a tool that simplifies running multi-container Docker applications. It allows you to define all your services (like your Node.js app and database) in a single YAML file, then start them with a single command. This is superior to running containers individually because it provides orchestration capabilities, automatic restart policies, and consistent deployment across environments. Without Docker Compose, managing multiple containers becomes complex as you lose control over container lifecycle and dependencies.
Click to watch →

Excalidraw - GRATIS, LIBRE y sin necesidad de INTERNET.
61K
Docker Compose enables deploying multiple interconnected services as a unified application through a declarative YAML configuration. The docker-compose.yml file defines each service's image, ports, environment variables, and dependencies. When executed, Docker Compose orchestrates the deployment, starting containers and establishing network connections between them. This approach simplifies managing complex infrastructure by abstracting deployment details into configuration files, allowing consistent deployment across development, testing, and production environments.
Click to watch →
Setup & Init
Start Node
Setup & Init
0:00- 1
Guide to run Celestia light node via Docker.
- 2
Create node store and initialize key with mnemonic.
- 3
Access official docs for prerequisites like Docker.
The Security, Performance, and Centralization Risks of Containerized Light Nodes
While running a Celestia Light Node via Docker simplifies deployment, critics highlight significant architectural and security trade-offs. First, containerization introduces overhead and supply chain vulnerabilities, as users often rely on pre-built images from centralized registries like Docker Hub. Second, hosting these nodes on centralized cloud providers (such as AWS or Google Cloud) undermines the core goal of blockchain decentralization. Finally, an over-reliance on light nodes can create a false sense of security. Light nodes only perform Data Availability Sampling (DAS) and cannot validate state transitions. If a network lacks a healthy ratio of independent, bare-metal full nodes and instead relies on identical Dockerized light clients hosted on centralized infrastructure, it remains highly vulnerable to systemic cloud outages and consensus-level attacks.
Basic understanding of containerization and Docker fundamentals, including images, containers, and volume mounting.
Familiarity with command-line interface (CLI) operations, terminal navigation, and basic system administration.
Fundamental concepts of blockchain architecture, specifically the functional differences between full nodes, validator nodes, and light nodes.
An introduction to modular blockchain theory, specifically Celestia's role as a Data Availability (DA) layer and Data Availability Sampling (DAS).
Monitoring and maintaining the light node's health, peer connectivity, and resource usage using tools like Prometheus and Grafana.
Securing the node's environment, including private key management, wallet backup procedures, and configuring secure RPC endpoints.
Integrating the running light node with modular rollups (such as OP Stack or Arbitrum Orbit) to submit and retrieve data from Celestia.
Advanced container orchestration, such as deploying and scaling the light node within a Docker Compose multi-service architecture or a Kubernetes cluster.
12.1K views140likes2:29@CelestiaNetworkOriginal Release: 2023-06-09
Welcome everyone.
Thanks for joining.
In this video we'll be going over how to run a Celestia Light node.
You may have seen the tweets recently of people running them in new locations on new devices, and of course the memes with pets and teletubbies and everything in the world running a light node.
Yeah, let's get started.
First thing you'll need to do is head over to docs.celestia.org and go to the "Run a Node" category.
In the "Quick start" section, there is a page for "Docker images", and the only prerequisite we'll have for this tutorial is that you have Docker installed on your machine.
If you don't have Docker already, go ahead and click the the link to Docker, which will take you to the installation page where you can install Docker desktop for Mac, Windows, or Linux.
Now that you have Docker installed, we're gonna skip to the second section of the tutorial for a light node with persistent storage.
This is going to allow us to use the same key and same data store every time we start the node so that it doesn't start reining from scratch every time.
The first thing we'll need to do is open up our terminal.
I'm using Warp.
You can use any terminal of your choosing, and we're gonna paste in the first command.
What the first command does is creates a directory or a folder for a node store.
Now the next thing we'll need to do is initialize our node store and key in that directory.
The first command will generate.
Or initialize the node store and then generate a key for you.
The public address or the address is the public key that other people can use to identify you.
That's the thing that shows up on block explorers.
And then mnemonic is the thing that you don't want to give away, and you might wanna write it down on paper if you're gonna ever use this key for anything real.
Yeah.
Next thing we'll need to do is start the node and we can copy the second command to do that.
And there's a little bit of a bug right now, so we're actually not gonna be able to get that to start on the first try.
So if you do "Control + C", it'll cancel it.
And we just do the same command again, and it'll start up and we're gonna see those nice logs that everyone's been sharing on Twitter.
Yeah.
If you enjoyed this video, please share it.
If you have any questions, please ask in the comments.
That's how to run a Celestia light node in a few minutes.
Thanks.
Up Next

4:55
How to Run a Celestia Light Node: Data Availability Network Tutorial
@CelestiaNetwork
18K views•2022-07-15

12:54
Triumph of Orthodoxy Icon: Byzantine Art & History Explained
@BenCallan
2.1K views•2024-08-06

9:49
FastAPI vs Flask vs Django: Choosing the Right Python Web Framework
@TechWithTim
302.5K views•2024-05-26

1:42
Game of Thrones Opening Credits: A Cinematic Analysis
@gameofthrones
46.3M views•2011-04-18
Related Study Plans & Knowledge Roadmaps
Structured learning paths in General & Interdisciplinary Studies
general-studies
Elevator Engineering: History, Physics & Cities
01From Hoists to Safety Brakes: The Dawn of Vertical Lift
02Hydraulic vs. Traction: The Engineering Physics of Elevators
03Modern Speed, Safety, and Algorithms
+ 2 more learning modules
12h5 modules
Explore Roadmap
general-studies
Rubber: Material Science, History & Geopolitics
01Origins of Natural Rubber & Mesoamerican History
02The Chemistry of Natural Rubber & Vulcanization
03The Geopolitics of the Rubber Boom & Colonization
+ 2 more learning modules
12h5 modules
Explore Roadmap
general-studies
Containerization: Evolution, Logistics & Trade
01Ancient Trade & Bulk Cargo: Amphorae to Barrels
02The Industrial Revolution & Cardboard Packaging
03The Containerization Revolution: Malcom McLean
+ 2 more learning modules
12h5 modules
Explore Roadmap
general-studies
Textile Tech: Evolution, Labor & Global Impact
01Pre-Industrial Textiles: Handloom & Cottage Industry
02Mechanization: The Spinning Jenny to the Power Loom
03The Factory System & Global Labor Transformation
+ 2 more learning modules
10h5 modules
Explore Roadmap