


















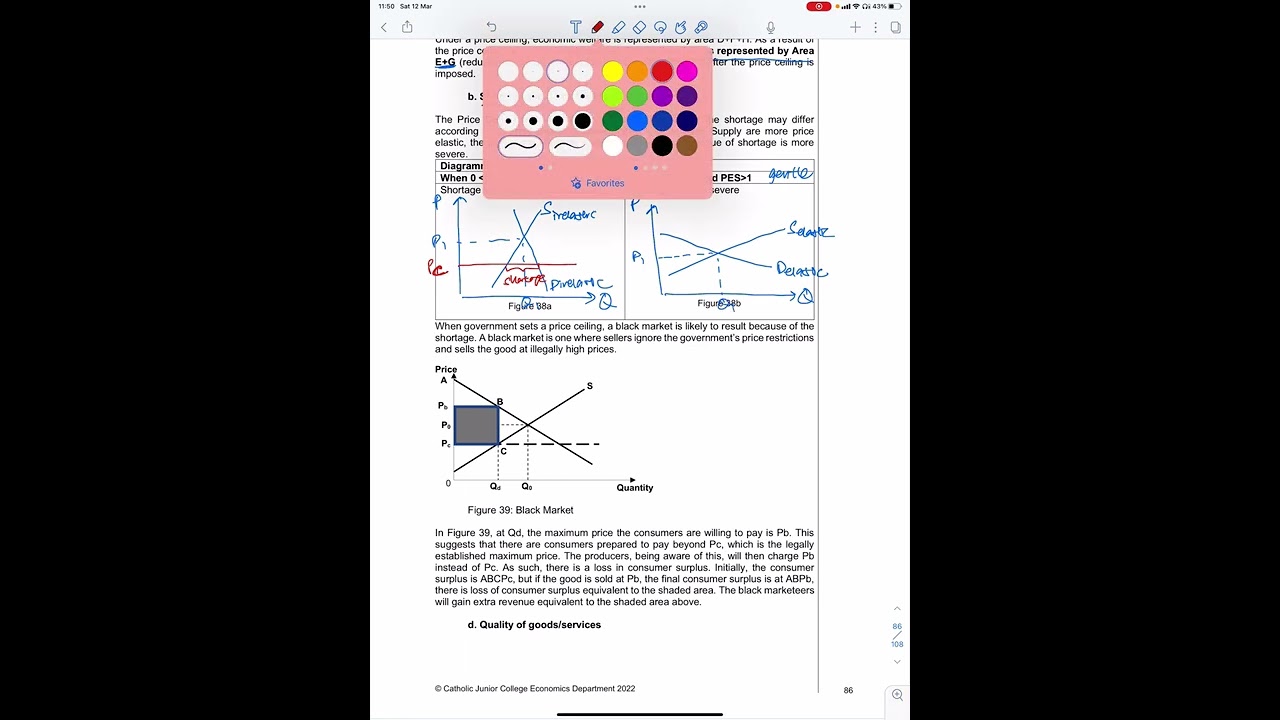


This tutorial demonstrates how to calculate consumer surplus (area above price and below demand curve) and producer surplus (area below price and above supply curve) in a market equilibrium, then shows how a price ceiling creates a shortage and reduces total benefit, resulting in deadweight loss equal to the difference between total benefit before and after the price ceiling.
Consumer Surplus & Producer Surplus with Price Ceiling | Deadweight Loss
Added:Understanding of market equilibrium, including how supply and demand curves intersect to establish equilibrium price and quantity.
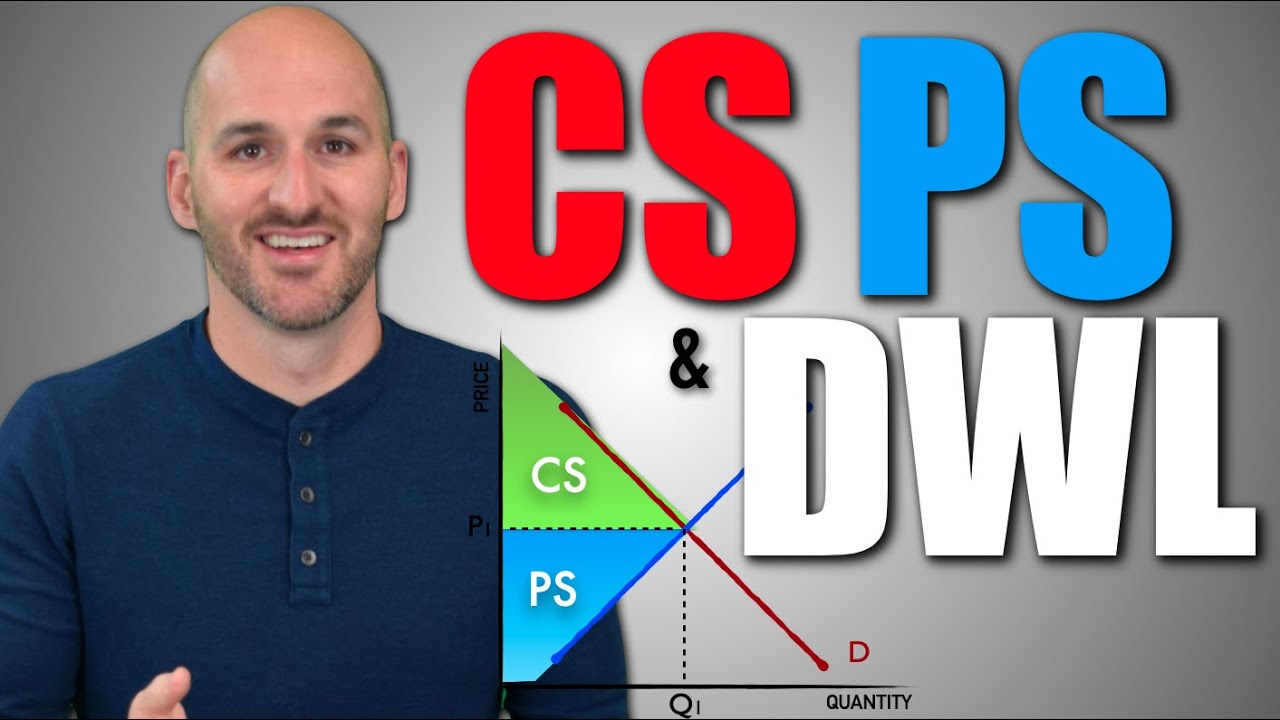
The fundamental definitions of Consumer Surplus (the difference between willingness to pay and market price) and Producer Surplus (the difference between market price and marginal cost).
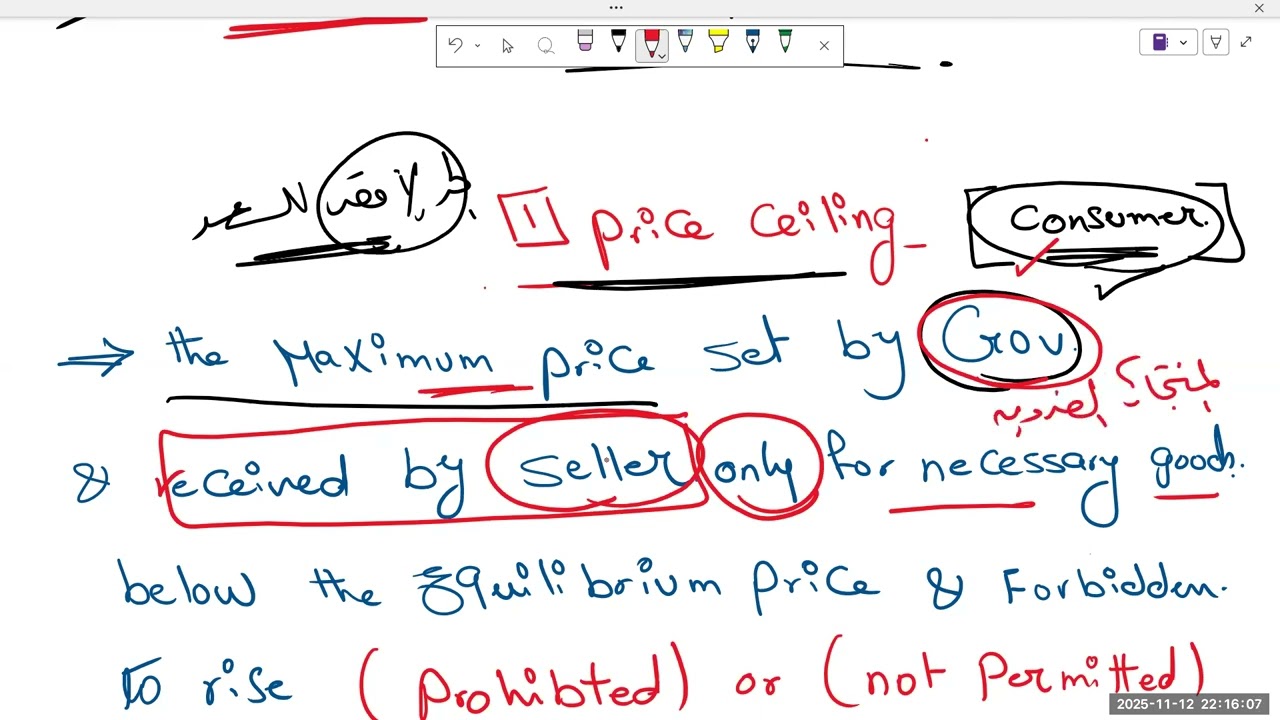
The basic concept of a price ceiling as a government-imposed maximum price and how it creates a market shortage.
Basic geometric area calculations (specifically for triangles and rectangles) as they are used to quantify economic surplus on a graph.
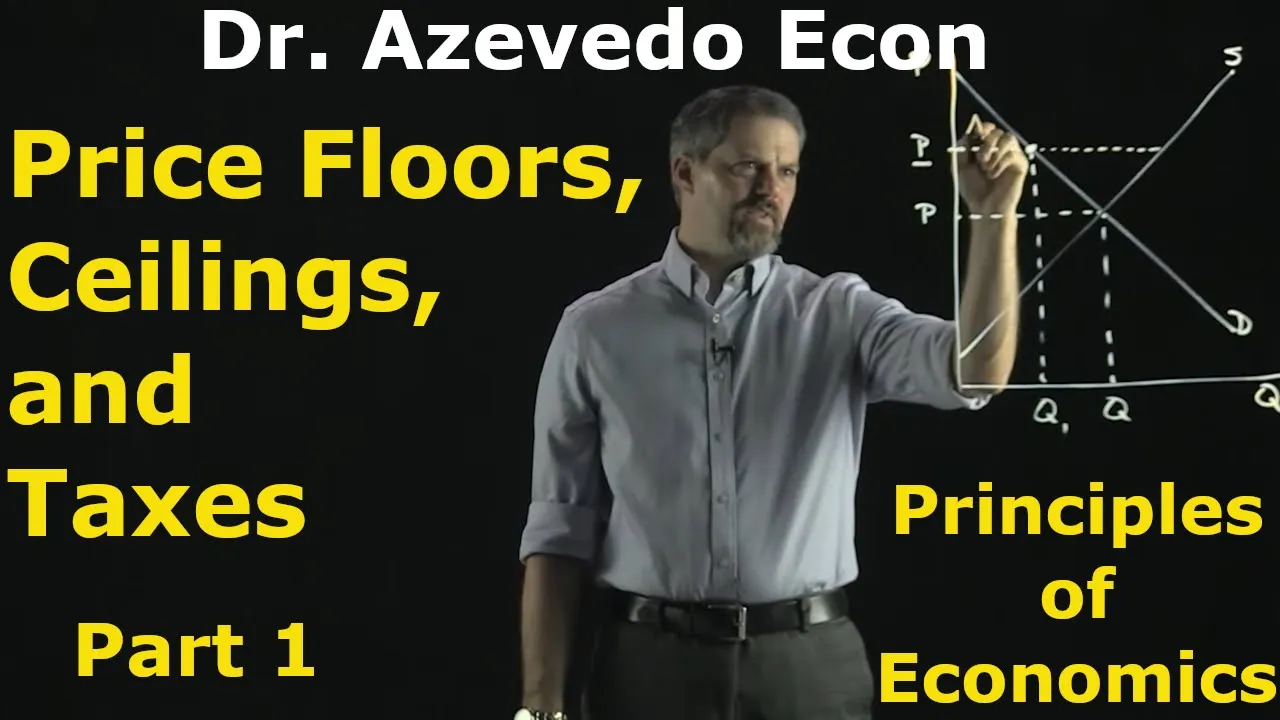
Analyzing the welfare and deadweight loss effects of Price Floors (such as minimum wage laws) to contrast with price ceilings.
How price elasticity of supply and demand influences the magnitude of deadweight loss and the distribution of surplus.
The economic impact of other government interventions, such as excise taxes, subsidies, and import tariffs, on market efficiency.
Investigating real-world non-price rationing mechanisms and secondary effects that arise from price ceilings, such as black markets, search costs, and quality deterioration.
591.1K views4.8Klikes7:22Original Release: 2011-05-07
in this tutorial I'm going to talk about consumer surplus and producer Surplus I'm going to talk about price ceilings I'm going to calculate total benefit before and after a price ceiling as usual I'll put price along the vertical axis and quantity along the horizontal axis I'm going to put in a supply curve in a demand curve equilibrium is right there where that dot is and I'll say that's a price of eight and quantity of six what did I get eight and six I just made it up for this example the consumer surplus is the area above price and below the demand curve or the area outlined there in the yellow triangle so the blue triangle is consumer surplus so consumer surplus is the area of the triangle which is 1/2 base times the height the base is six so we have 12 * 6times the height which is 20 - 8 or 12 that 20 and that 8 20 - 8 is 12 6 * 12 is 72 1 12 * 72 is 36 consumer surplus is 36 in this case which is the area of the triangle put producer Surplus is the area below the price and above the supply curve outlined in yellow or the red triangle producer Surplus is the red area there it is 1/2 time the base times the height the base is six so I have 12 * 6 time the height and the height is also six 8 - 2 is equal to 6 and that 8 there and that to here so I have 1 12 * 36 which is 18 so producer Surplus in this case is equal to 18 Again producer Surplus is 18 and consumer surplus is 36 benefit is 36 + 18 which is equal to 54 that's our total benefit which is consumer surplus plus producer Surplus and that's our total benefits I'll draw in a price ceiling of $6 right there so we have a price ceiling quantity demanded is seven and quantity supplied there is four quantity demand is greater than quantity Supply there is a shortage and we can calculate that which is 7 - 4 which is equal to 3 so we have a shortage of three units producer Surplus shrinks to the new level here hopefully to shrink right there it's the area below the price and above the supply curve since less is consumed and it's consumed at a quantity Supply level and I'll draw in the green line consumer surplus also changes and it becomes that triangle Plus plus this rectangle to calculate consumer surplus I've got to take the area of the rectangle plus the area of the triangle and add those two together and these two combined are consumer surplus so the area of the rectangle is the base times the height when the base is four which is that distance here let me show you that's still four kind of slowly but it's four it also has a height of six so the area becomes four * 6 4 * 6 should be coming in about right now 4 * 6 which is 24 the area of that part of consumer surplus is 24 the area of the triangle is going to be a base of four as well four and a height of oh base of four let me just stick with that for now that right there that's the base and a height of eight 20 - 12 is 8 so it becomes 4 * 8 1/2 base time height which is 4 this is the base times a height of eight which is 1 12 * 32 and that equates to 16 so the area of the triangle is 16 consumer surplus is the 16 plus the 24 and this adds up to 40 so consumer surplus is 40 producer Surplus becomes the area of the red triangle which is still the area below the price and above the supply curve it's 4 * 4 at 6 - 2 is equal to four so producer Surplus becomes 12 Time 4 * 4 or 16 and this equates to eight so producer Surplus is 8 so it becomes total benefit is 40 + 8 is equal to 48 and this is after price ceiling total benefit before is equal to 54 total benefit after price ceilings 48 so the dead weight loss is six there's a net loss of six basically we call it dead weight lost and that's that area right there the gray I guess that's a triangle so the area of the triangle is six I could have also calculated the area of the two triangles so if I separate put a line right there the area of the top triangle would be four and the area of the bottom triangle would be two and of course those two added together equal six I've could have done it that way as well either way works one thing you might want to do is watch this again and compare consumer surplus before and after and also producer Surplus before and after and see who are the winners and the losers
Up Next
6:41
Finding Equilibrium Price and Quantity with Linear Demand and Supply
@JasonWelker
286.7K views•2011-10-04

5:07
Impact of Yuan in Indo-Russian Trade Amid Sanctions
@WION
261.9K views•2022-07-01

7:19
Calculating Consumer & Producer Surplus with Price Floor
@economicsfun
110.3K views•2011-05-28

113:18
The Age of Easy Money: Fed & Inflation | Full Documentary
@frontline
21.2M views•2023-03-15
Related Study Plans & Knowledge Roadmaps
Structured learning paths in Economics
economics
Sovereign Debt: Defaults, IMF & Restructuring
01Introduction to Sovereign Debt & Government Bonds
02Debt Sustainability & Credit Ratings
03Anatomy and History of Debt Crises
+ 2 more learning modules
12h5 modules
Explore Roadmap
economics
Market Design: Matching Theory & Gale-Shapley
01Introduction to Market Design and Price-Free Markets
02Two-Sided Matching & The Gale-Shapley Algorithm
03School Choice Systems and Mechanism Design
+ 2 more learning modules
10h5 modules
Explore Roadmap
economics
Impossible Trinity: Forex, Capital & Policy
01Introduction to Monetary Policy and Central Banking
02Exchange Rates and International Capital Flows
03The Mundell-Fleming Model
+ 2 more learning modules
8h5 modules
Explore Roadmap
economics
Healthcare Economics: Market Failures & Systems
01Introduction to Healthcare Markets and Market Failure
02Asymmetric Information and Adverse Selection
03Moral Hazard and Insurance Design
+ 2 more learning modules
12h5 modules
Explore Roadmap