


![★풀영상★[공인중개사 1차] 2019 부동산학개론 입문완성 - 부동산의 수요공급이론](https://i.ytimg.com/vi/70P8hGaQkBU/maxresdefault.jpg)


![SISTEMAS de ECUACIONES [Método IGUALACIÓN]](https://i.ytimg.com/vi_webp/shY3OcW5cQM/maxresdefault.webp)





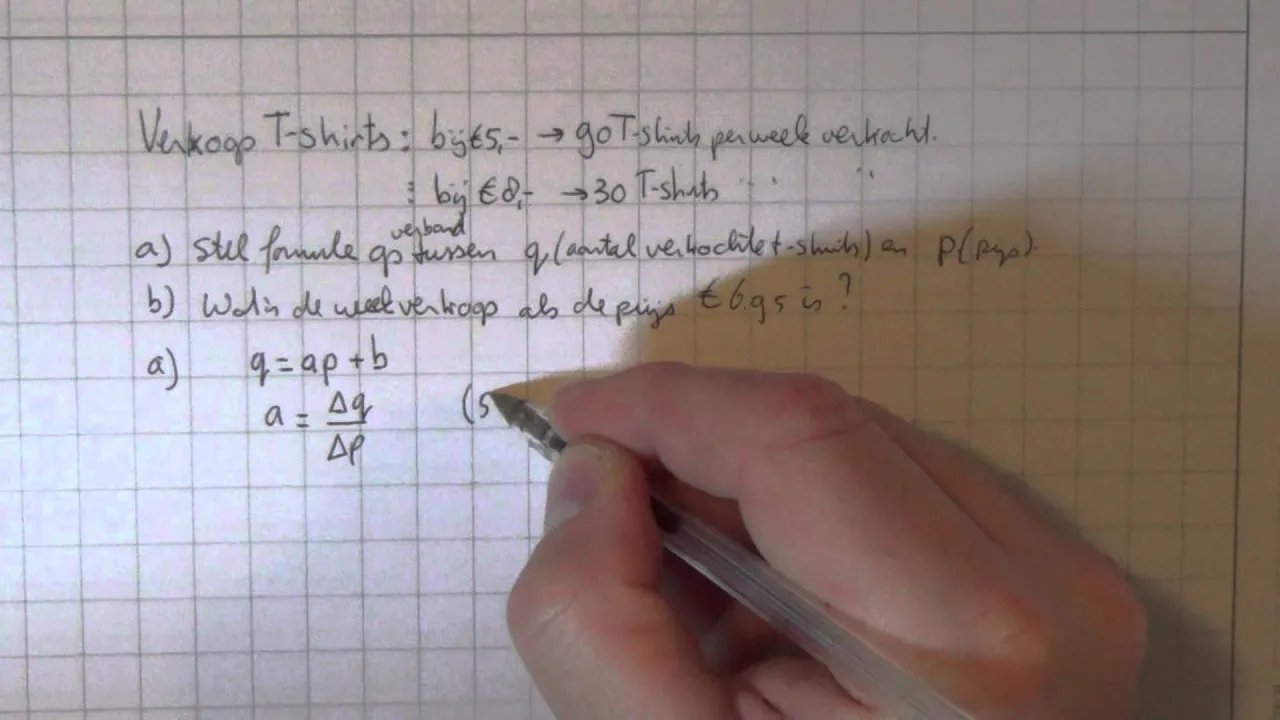





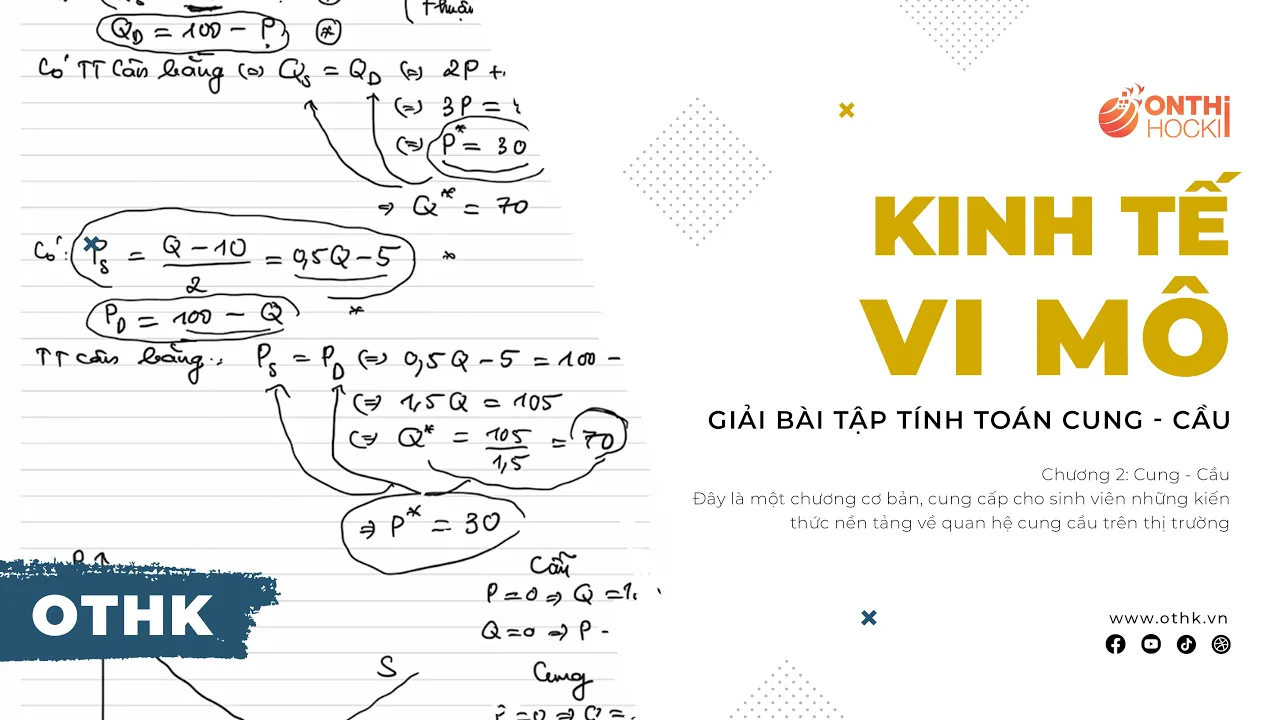









To find the equilibrium price and quantity in a market, set the quantity demanded equal to the quantity supplied (QD = QS) and solve for the price (P), then substitute the equilibrium price back into either equation to find the equilibrium quantity; for example, with demand QD = 80 - 4P and supply QS = -20 + 8P, solving 80 - 4P = -20 + 8P yields an equilibrium price of $8.33 and equilibrium quantity of approximately 46.64 movie tickets.
Finding Equilibrium Price and Quantity with Linear Demand and Supply
Added:Basic understanding of the Law of Demand and the Law of Supply, including how they represent consumer and producer behavior.
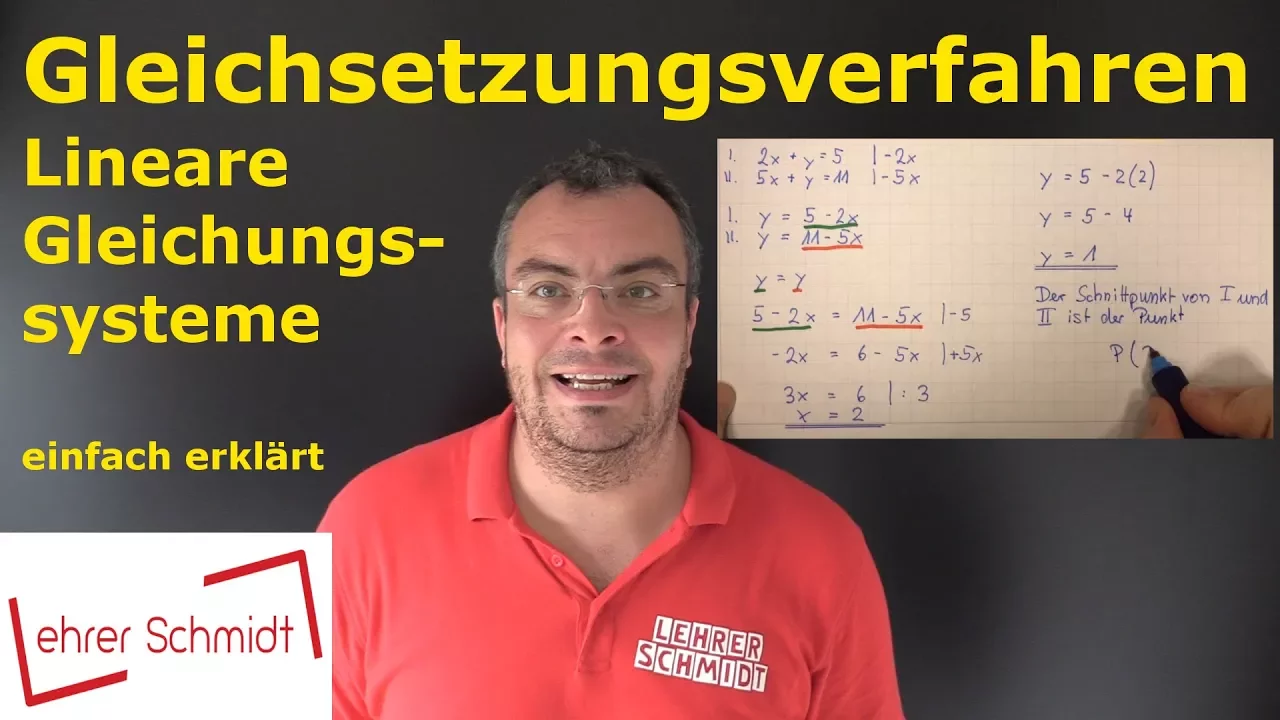
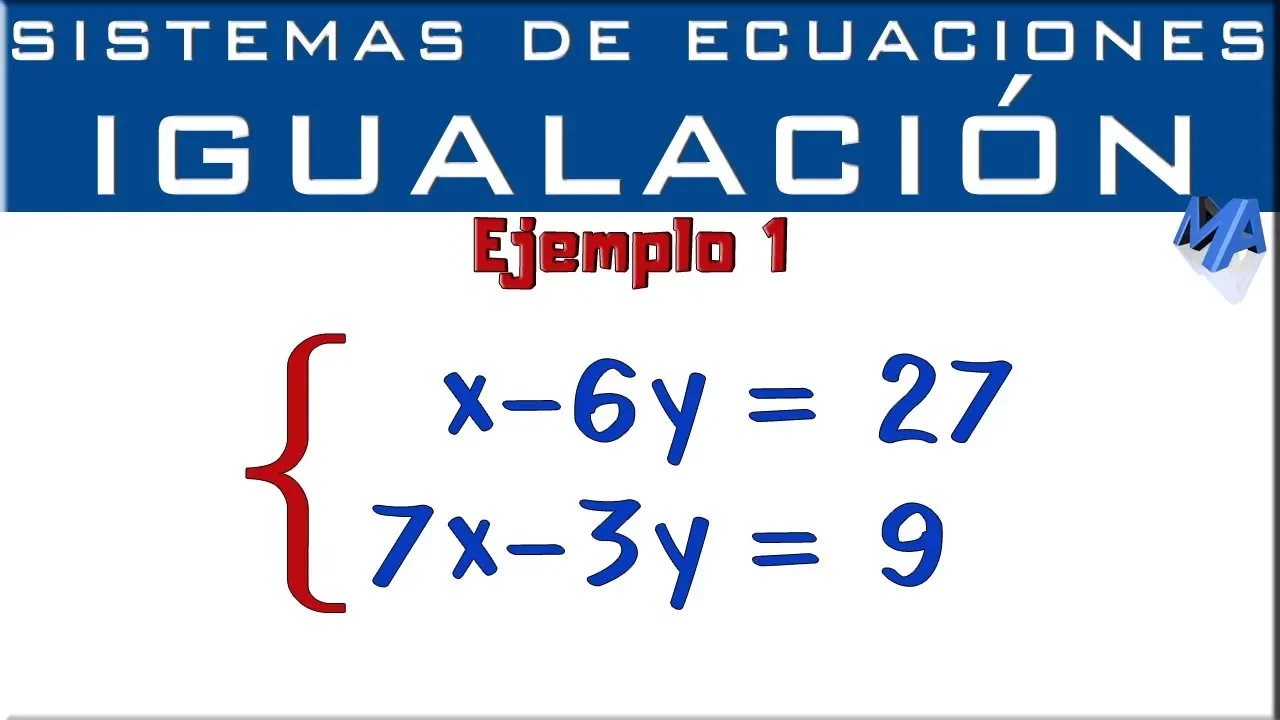
Fundamental algebraic skills, specifically solving a system of two linear equations by setting them equal to each other.
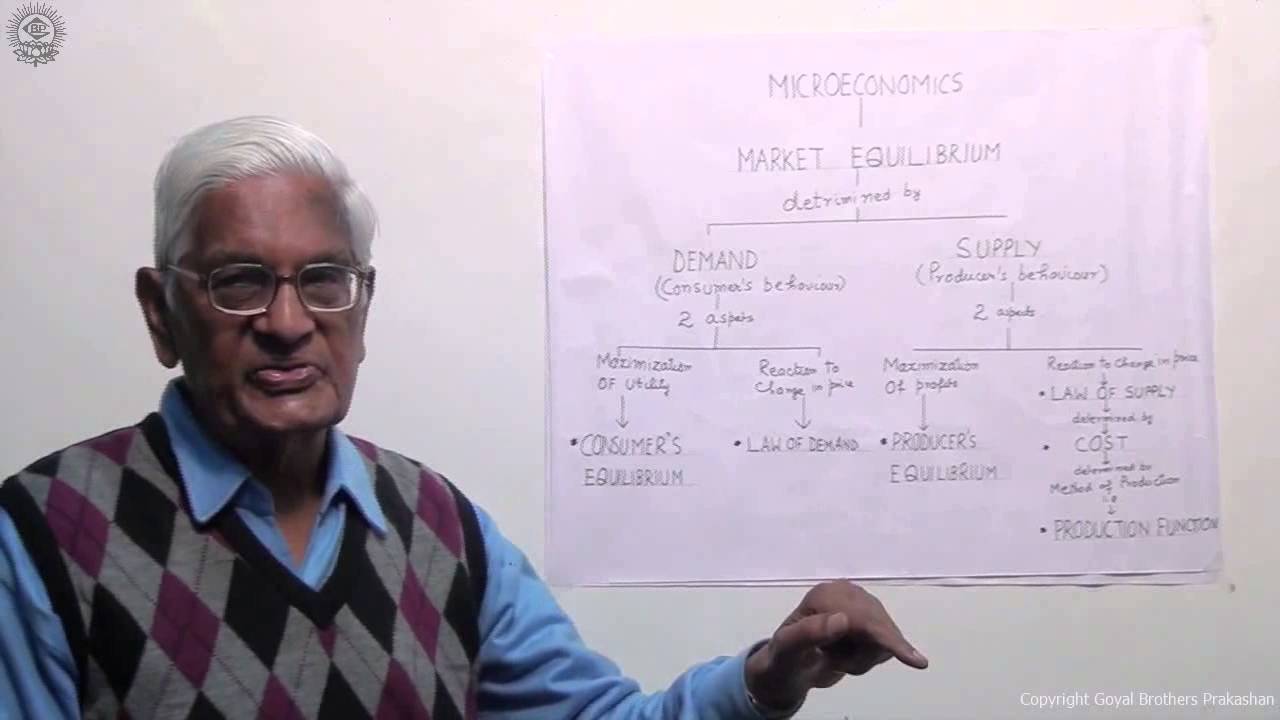
The conceptual definition of market equilibrium as the point where quantity demanded equals quantity supplied.
How to interpret linear equations in slope-intercept form, understanding what variables like price (P) and quantity (Q) represent mathematically.
Analyzing how shifts in demand or supply (caused by non-price factors) algebraically alter the equilibrium price and quantity.
Calculating consumer surplus, producer surplus, and total social welfare at the calculated equilibrium point.
Evaluating the mathematical and economic impacts of government interventions, such as price ceilings, price floors, and taxes.
Understanding the concept of price elasticity of demand and supply, and how the slopes of the equations affect market responsiveness.
286.7K views1.6Klikes6:41Original Release: 2011-10-04
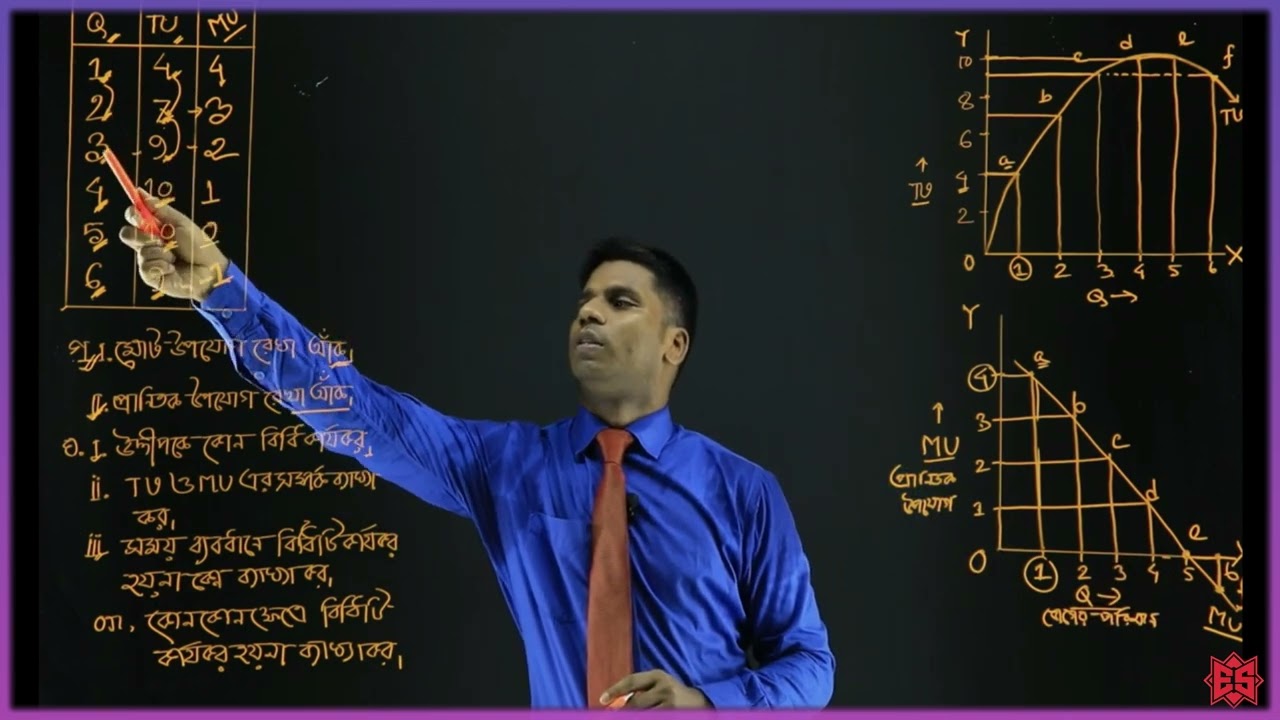
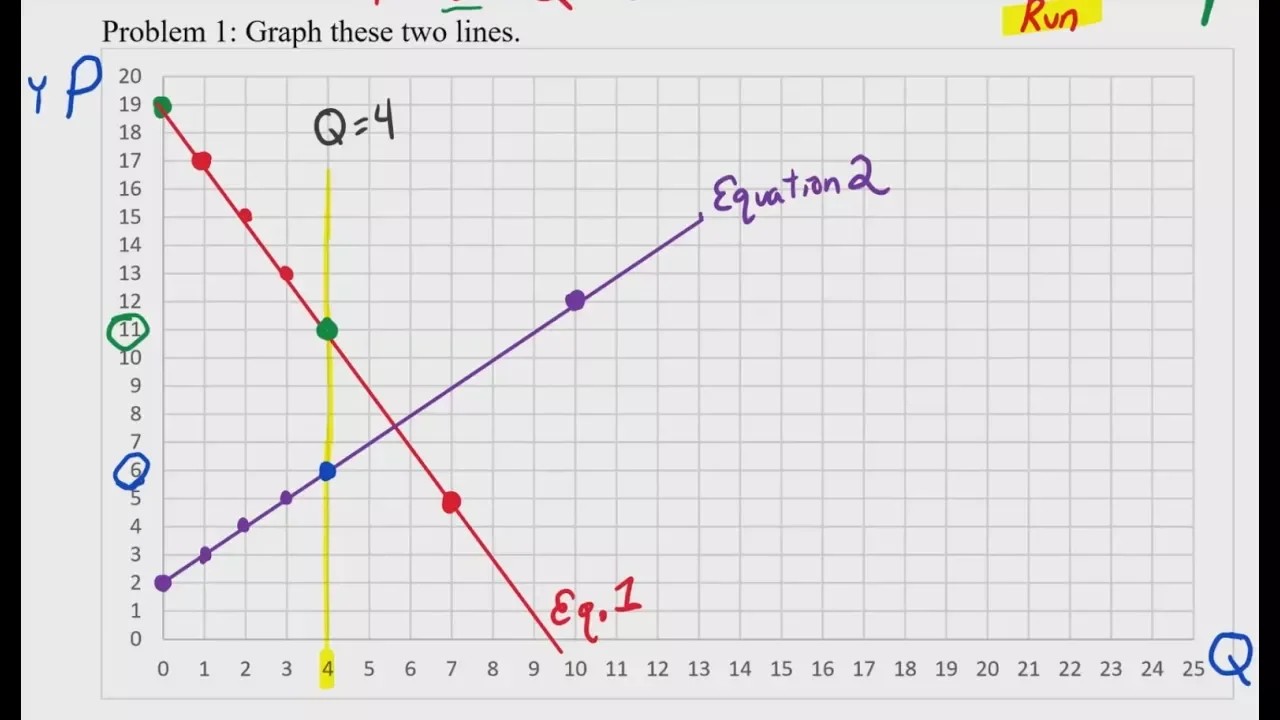
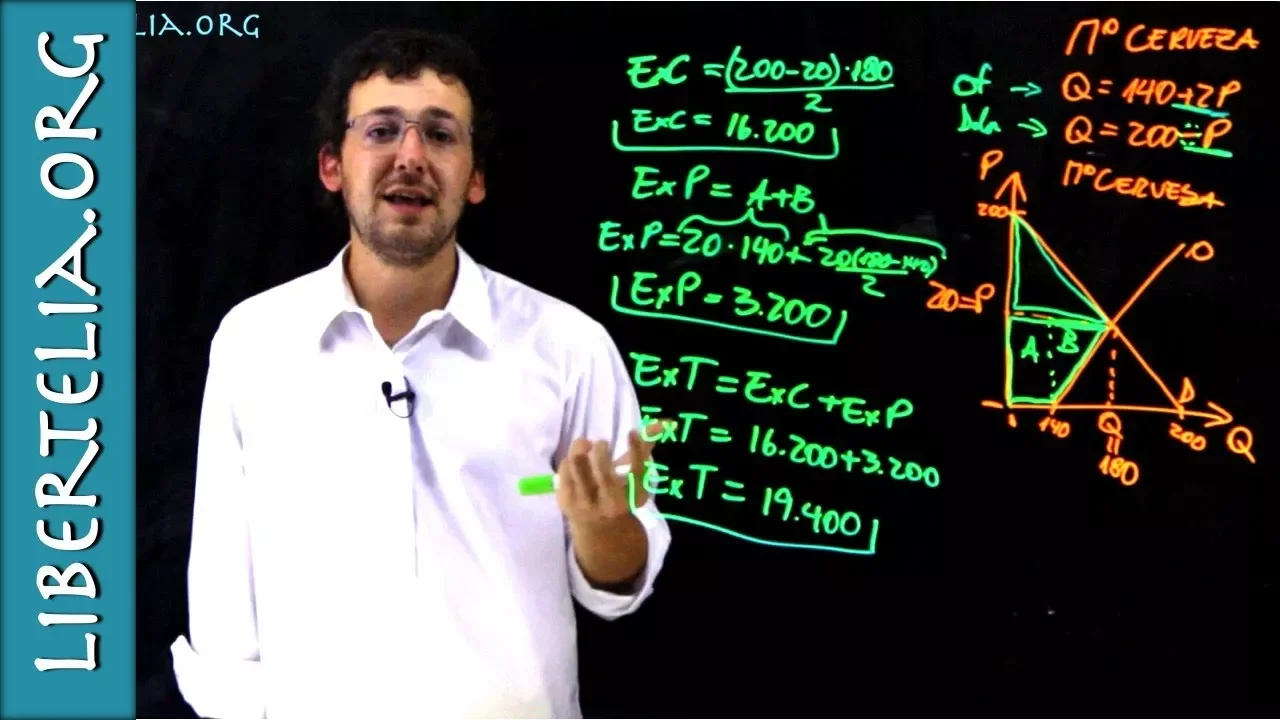
today we're going to talk about how to find equilibrium price and quantity using linear demand and linear Supply equations for example today we'll be using movie tickets for which the demand equals 80 minus 4 p and the quantity Supply equal -20 + 8p the first thing we would like to do is actually plot our de demand and Supply equations for movie tickets to do this we must plot a couple of points for both demand and Supply let's start with demand the first point we can plot on our demand curve is easy because we know that the Q intercept or the quantity that would be demanded at a price of zero is 880,000 movie tickets so we can put a point right there on our quantity axis we need one more point to draw our linear demand curve so let's choose a price along our P axis and find out what the quantity demanded would be at that price let's look at the quantity demanded at a price of 10 QD = 80 - 4 * 10 clearly we can see that at a price of 10 the quantity demanded equals 80us 40 or 40 so let's put a point at a price of 10 and at a quantity of 40 with two points along along a linear demand curve we can draw our demand graph there we have our demand graph our demand curve next we want to find the supply curve for movie tickets now we we don't have a negative range on our quantity axis so the Q intercept of -20 isn't much help to us here what we can find very easily though is the P intercept or the supply curve intercepts the vertical price axis to do this we simply set the quantity supplied at zero and solve for p so 0 = -20 + 8 p 20 = 8 p divide both sides by 8 and we see that P the price at which quantity supplied would be zero is 2.5 this tells us that our price or sorry our supply curve begins at 2.5 on the vertical axis which is approximately here now all we need to do is find one more point in our supply curve and we can show the supply curve so let's choose a price again of 10 or I'm sorry a quantity of 10 so if so let's find out what the quantity supplied would be at a price of 10 to do this we simply plug 10 into our supply equation so quantities applied a price of 10 = -20 + 8 * 10 which is 80 therefore the quantity supplied at a price of 10 equals 60 so now we can put one more point on our graph and we'll have our supply curve at a price of 10 the quantity supplied is equal to 60 now we've drawn both our supply and our demand curves but the next question is what is the exact equilibrium price and the equilibrium quantity of movie tickets judging from this graph we can see that the equilibrium price is somewhere around between 8 and $9 and the equilibrium quantity is somewhere between 40 and 50 movie tickets however these are hardly accurate estimates so to find the actual equilibrium price and quantity all we have to do is set the quantity demand equal to the quantity supplied since we know that the equilibrium price is the price at which quantity demanded and quantity supplied are equal so this shouldn't be hard let's just set our two equations equal to each other 80 minus 4 P equal -20 + 8p now when we solve for p we will know the equilibrium price for movie tickets to solve for p simply add 4 P to both sides so we have 12 p and then add 20 to both sides equals 100 divide both sides by 12 so the equilibrium price equals 100 / 12 which is 8.33 now we know a more accurate calculation of the actual equilibrium price which we can now label on our graph as $833 per movie ticket the next step of course is to find the equilibrium quantity to do this all we have to do is plug our equilibrium price into either the demand equation or the supply equation so let's start with demand and see what we get QD equals 80 minus 4 * 8.33 simplify and we see that QD equals 80 minus 33.3 2 the quantity demanded at equilibrium we'll call that QE equals 46.
68,000 movie tickets now to confirm this let's go ahead and solve for the quantity supplied at a price of 8.33 Qs = -20 + 8 * 8.33 simplify and we see the quantity supplied equals -20 plus 66.6 4 so we see that the quantity at equilibrium is 46.64 of course the reason we didn't get the exact result is because we rounded our numbers at one point so we should see that approximately 46.64 th000 movie tickets would be demanded at the equilibrium price of $833 so we've just shown how you can calculate equilibrium price and quantity using linear demand and Supply equations
Up Next
12:31
Deadweight Loss Explained: Consumer & Producer Surplus
@JasonWelker
108K views•2016-09-07

5:07
Impact of Yuan in Indo-Russian Trade Amid Sanctions
@WION
261.9K views•2022-07-01

20:06
Fiscal Policy: Government Spending Multiplier Explained (Economics) | AP/IB Macro
@JasonWelker
73.7K views•2011-11-28

113:18
The Age of Easy Money: Fed & Inflation | Full Documentary
@frontline
21.2M views•2023-03-15
Related Study Plans & Knowledge Roadmaps
Structured learning paths in Economics
economics
Sovereign Debt: Defaults, IMF & Restructuring
01Introduction to Sovereign Debt & Government Bonds
02Debt Sustainability & Credit Ratings
03Anatomy and History of Debt Crises
+ 2 more learning modules
12h5 modules
Explore Roadmap
economics
Market Design: Matching Theory & Gale-Shapley
01Introduction to Market Design and Price-Free Markets
02Two-Sided Matching & The Gale-Shapley Algorithm
03School Choice Systems and Mechanism Design
+ 2 more learning modules
10h5 modules
Explore Roadmap
economics
Impossible Trinity: Forex, Capital & Policy
01Introduction to Monetary Policy and Central Banking
02Exchange Rates and International Capital Flows
03The Mundell-Fleming Model
+ 2 more learning modules
8h5 modules
Explore Roadmap
economics
Healthcare Economics: Market Failures & Systems
01Introduction to Healthcare Markets and Market Failure
02Asymmetric Information and Adverse Selection
03Moral Hazard and Insurance Design
+ 2 more learning modules
12h5 modules
Explore Roadmap