













![[AP Micro] (9) Market Disequilibrium&change in Equilibrium | Effects of Gov intervention in market](https://i.ytimg.com/vi_webp/xC80CEzavKQ/maxresdefault.webp)






![STUD[IE] UAS PE-1 ODD SEMESTER 2023-2024](https://i.ytimg.com/vi/9zKuTn7a4is/maxresdefault.jpg)
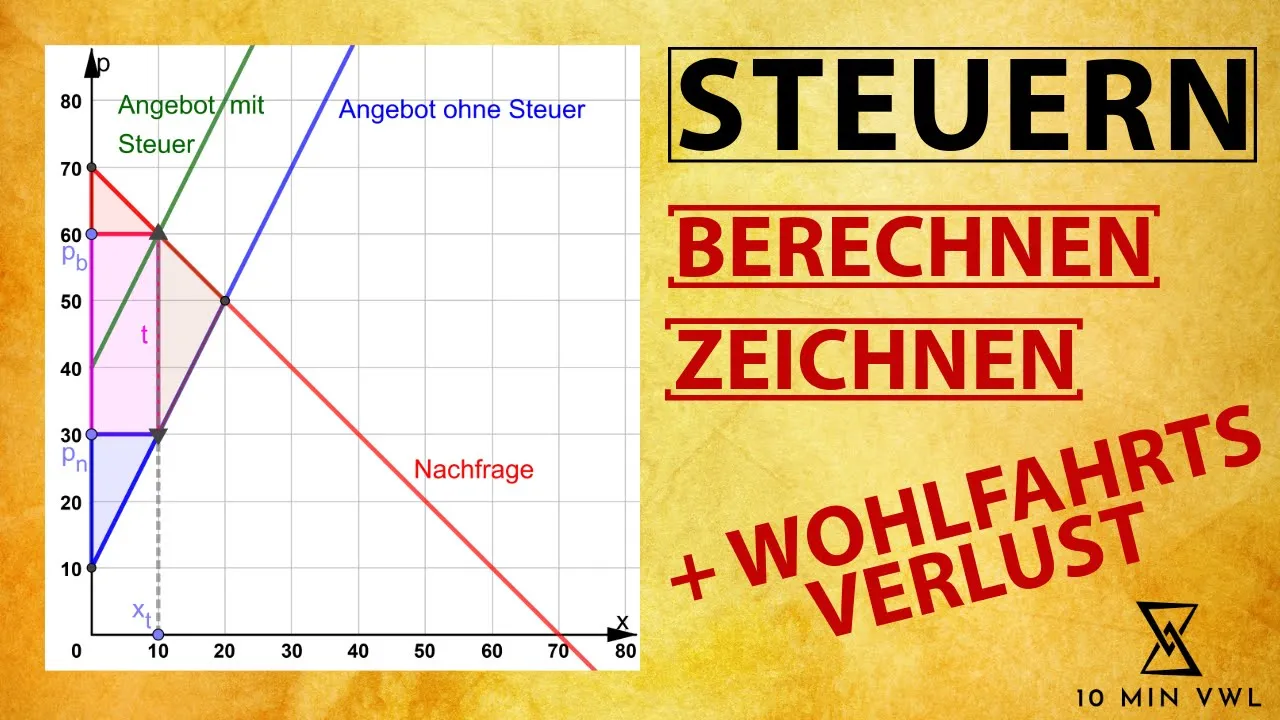
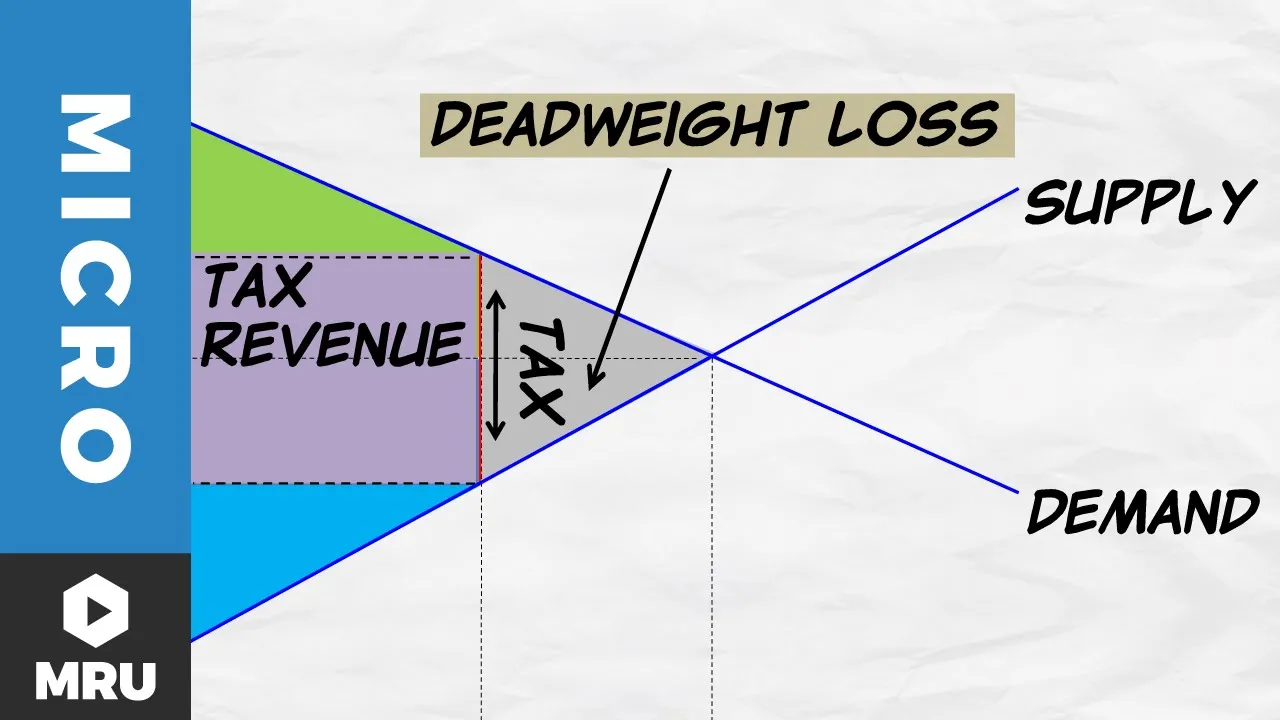
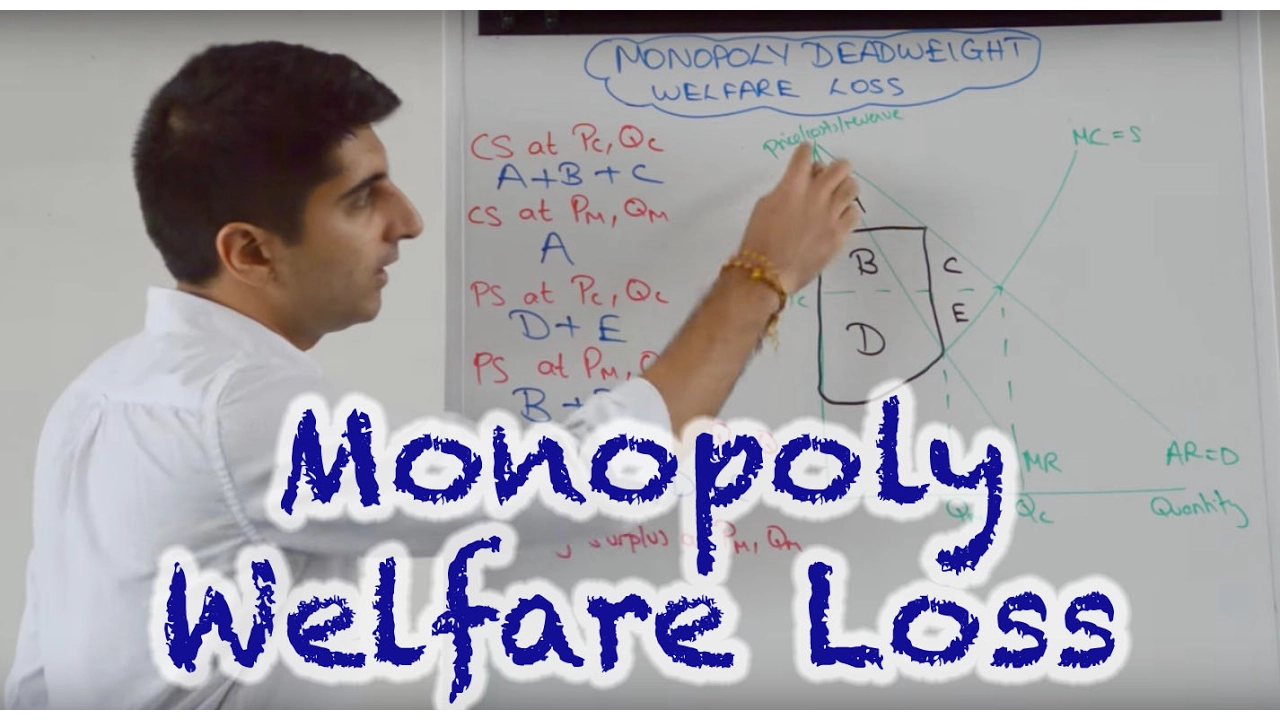
Deadweight loss, or welfare loss, is the reduction in total economic welfare that occurs when a market operates at any price-quantity combination other than its equilibrium point; at equilibrium, total welfare (consumer surplus plus producer surplus) is maximized, but when prices deviate from equilibrium (such as through price controls, taxes, or subsidies), the resulting inefficiency creates a triangular area of lost welfare between the supply and demand curves, demonstrating that markets are most efficient when left to find their own equilibrium.
Deadweight Loss Explained: Consumer & Producer Surplus
Added:The law of demand and supply, including how supply and demand curves are constructed and how they interact.
The concept of market equilibrium, representing the price and quantity where market supply equals market demand.
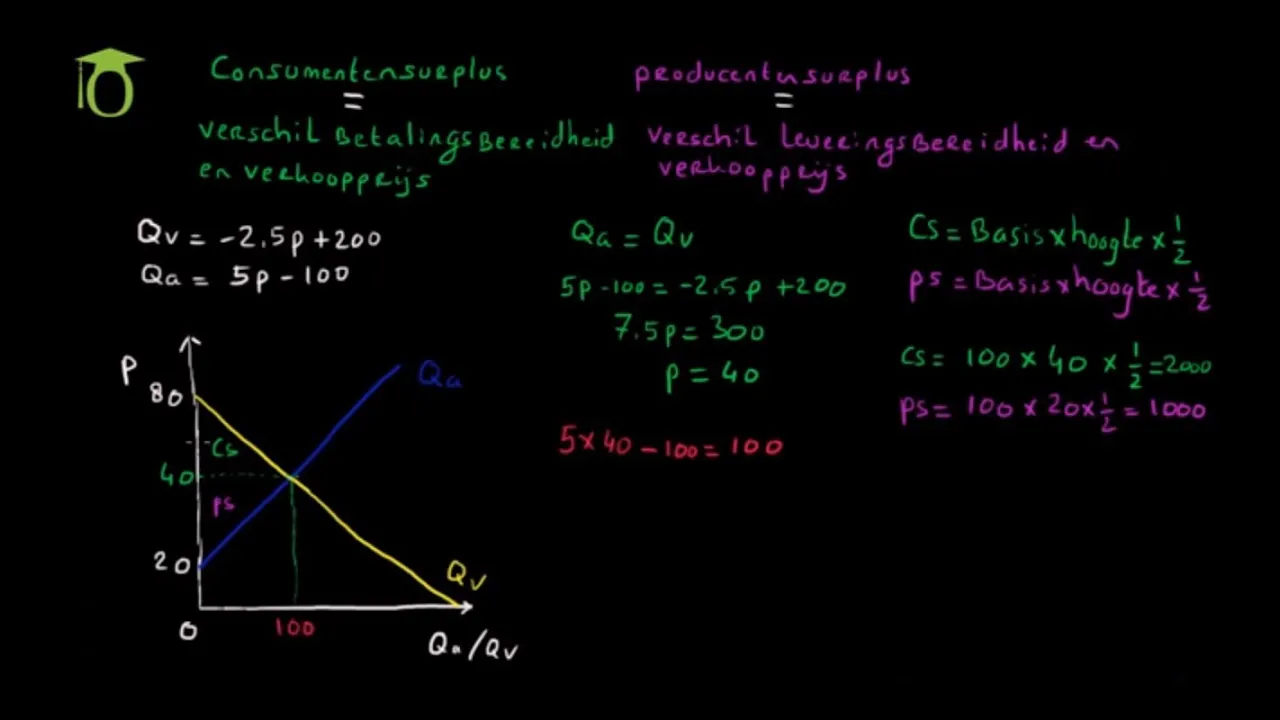
The baseline definitions of consumer surplus (the benefit consumers receive above the price they pay) and producer surplus (the benefit producers receive above their cost of production).
The principle of allocative efficiency, which occurs when resources are allocated in a way that maximizes total societal welfare.
The welfare effects of government interventions, such as price ceilings (e.g., rent control) and price floors (e.g., minimum wage), which cause market disequilibrium.
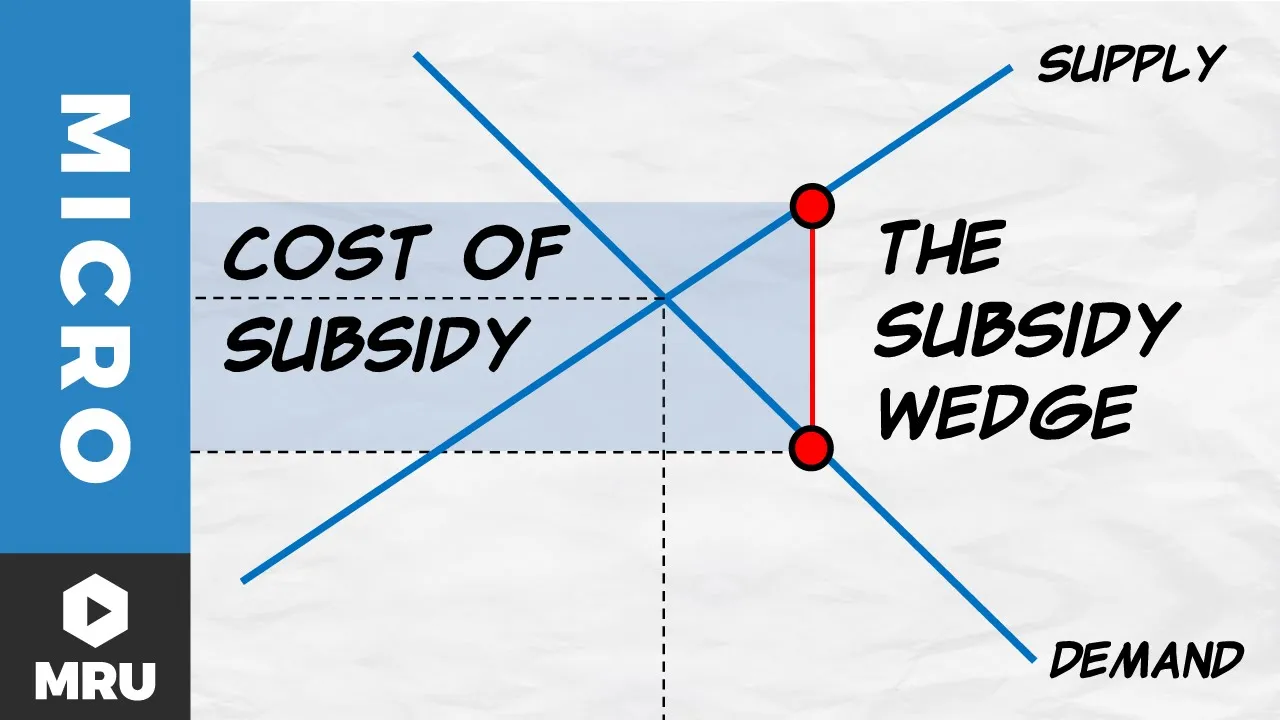
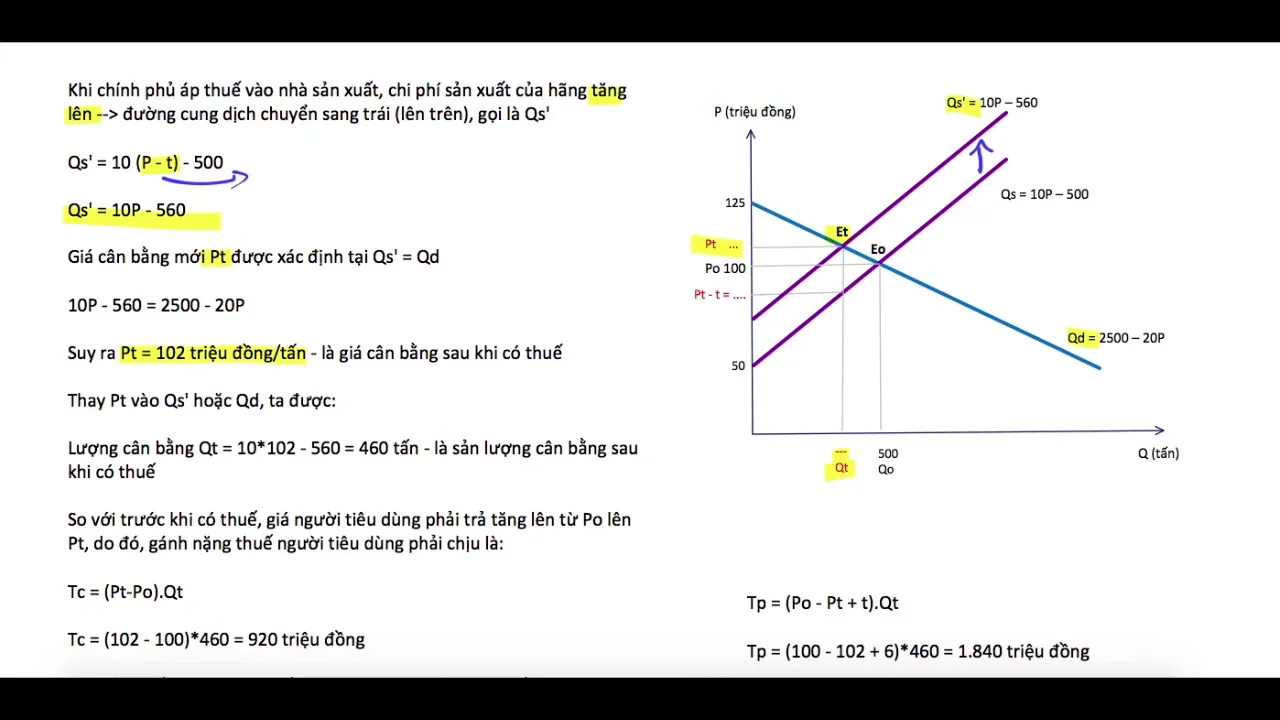
The economic impact and deadweight loss associated with taxes (tax incidence and excess burden) and subsidies.
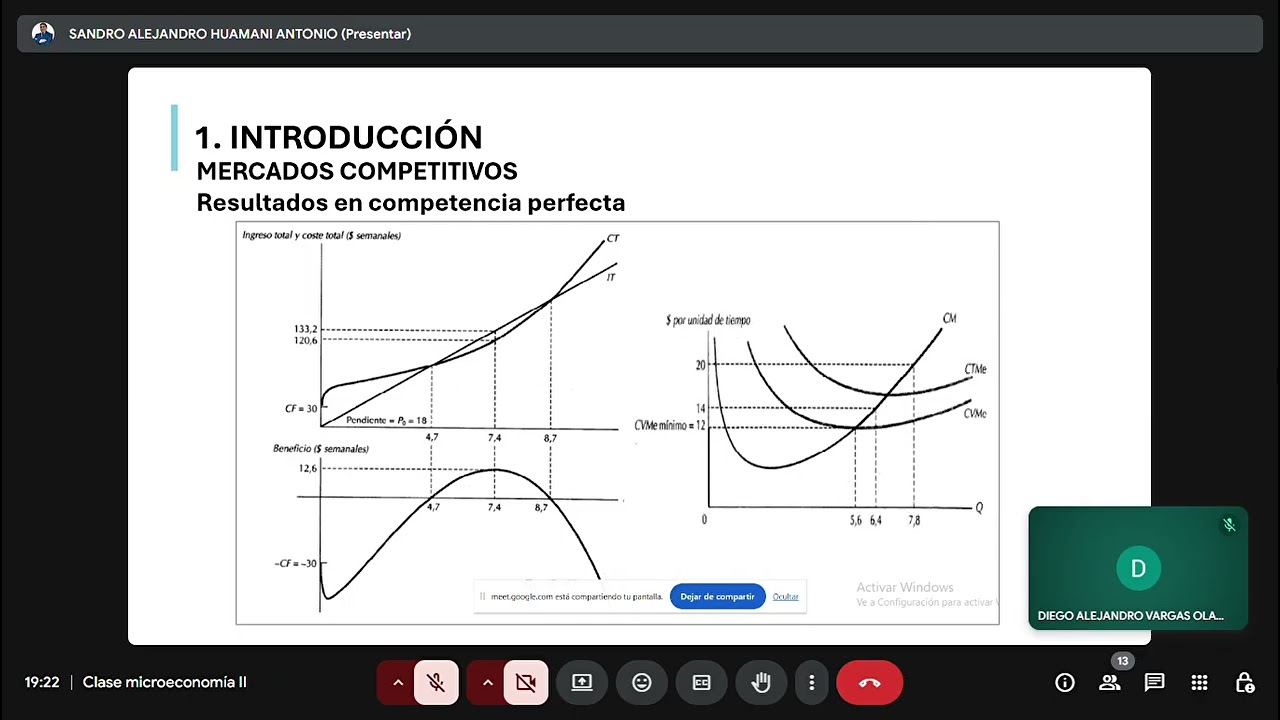
How imperfectly competitive market structures, particularly monopolies and oligopolies, restrict output and create deadweight loss.
The study of market failures, such as positive and negative externalities, and how policy instruments like Pigouvian taxes or subsidies can correct them.
108K views1.2Klikes12:31Original Release: 2016-09-07
and this lesson we're going to introduce these situations in which markets results in deadweight losses or a loss of total welfare this lesson will build on previous lessons specifically those in which we introduce the concepts of market equilibrium and the efficiency that results when a market is in equilibrium and the video lesson on consumer and producer surplus if you haven't completed those lessons yet I suggest you pause this video and go back and watch those now in order to guide us today we're going to be looking at the same market for beef that we looked at in our consumer and producer surplus video lesson notice in this graph that I've added an equilibrium price in an equilibrium quantity this market has cleared and is in equilibrium at a price of $5 and at a quantity of 6 million pounds of beef the first thing I want to do is to actually calculate or quantify the amount of consumer surplus and producer surplus in the market for beef when it is at equilibrium to do that we need to outline a couple areas and the first area I'll outline is the area of consumer surplus recall from our earlier lesson that the total benefit enjoyed by consumers who paid a lower price than what they would have been willing and able to pay is the area below the demand curve and above the equilibrium price next I'll outline the area representing the producer surplus everything below the price and above the supply curve represents the additional benefit or the profits of the firms that were able to sell their beef at a price higher than the lowest price they would have been willing and able to sell it for in order to determine the amount of total welfare in this market all we need to do is find the areas of these two triangles and add them together so this is a very simple calculation the total welfare in a market equals the consumer surplus plus the producer surplus let's go ahead and determine what the area of the consumer and producer surplus is in this market to do this all we need to do is calculate the area of the two triangles here and add them together we can see that the price at which the demand curve starts is nine dollars we can go six seven eight nine at a price of $9 consumers are will to start buying beef at any price above $9 there will be zero demand for beef likewise at a price of $1 producers are willing to start providing beef at any price below $1 no producers will be willing and able to supply beef so to find the areas of consumer surplus and producer surplus all we need to do is find the areas of these triangles that is 1/2 the base times the height so we can do 9 minus 5 times the base of 6 and divide that by 2 and that gives us 4 times 6 divided by 2 we get a total consumer surplus of 12 million dollars this value represents how much additional benefit consumers enjoy at a price of 5 dollars in the market for beef we can do a similar calculation to find the producer surplus for the suppliers of beef we can find the area of the triangle outlined in purple to do that we do the base times the height that would be 5 minus 1 times 6 that's the height times the base and divide that by 2 and we get the same result total producer surplus is 12 million dollars we know that the total benefit enjoyed by consumers in the market for beef at a price of $5 is 12 million dollars and the same producer surplus is enjoyed by the suppliers of beef so we get a total welfare representing the total extra happiness or well-being of producers and consumers in the market for beef of 24 million dollars let's talk a little bit about allocate of efficiency again what makes the equilibrium price and quantity allocated li efficient we can actually say that PE and QE are efficient because total welfare is maximized as we will demonstrate in just a moment there is no price quantity combination other than $5 and 6 million pounds that can increase the amount of total welfare in this market at the current levels of demand and supply what I want to show now is a situation in which there is a price quantity combination other than the equilibrium and will prove that actually there will be a loss of total welfare something that we call a deadweight loss whenever there is an outcome other than the equilibria I'll come in the market okay I've cleaned up my graph here what I want to do now is look at how the market will be affected at any price other than $5 and we'll calculate the areas of consumer and producer surplus to determine whether there is an increase or a decrease in total welfare so let's assume that the price of beef is higher than $5 let's go up to $7 assume that producers decide that they want to charge a higher price for the beef and they want to sell more beef so at the higher price of $7 they're going to increase their production of beef out to 9 million pounds we can see that the quantity supplied at a price of $7 will be greater it's the law of supply it tells us that at a higher price producers will be willing and able to supply a greater quantity so you have 9 million pounds of beef produced however the higher price also means that consumers are going to be willing and able to buy less beef and we can see right away that at the higher price the quantity demanded for beef will fall and go over to our demand curve and down we can see that the new quantity demanded called as QD will be smaller at only 3 million pounds the first thing to notice is that this is an inefficient level of output in price because the quantity supplied is greater than the quantity demanded we have an excess call this an excess supply otherwise known as a surplus and this is not the good kind of surplus this is not consumer surplus or producer surplus this is too much beef being produced and we can also analyze this level of output by looking at the marginal benefit marginal cost at 9 million pounds of beef the marginal cost is greater than the marginal benefit the cost to society of the nine millionth pound of beef is greater than what consumers are willing to pay for it too much beef is being produced to further reinforce this we can calculate the effect that this over allocation of resources towards beef will have on the total welfare in the market for beef by revisiting and calculating the new areas of consumer and producer surplus so first we need to identify those areas consumer surplus once again is the area above the price now of $7 and below the demand curve clearly this is a much smaller area let's go ahead and calculate that now we need to find the new air consumer surplus to do that we use the equation the formula one-half base times height so the height is now nine minus seven the base is three and divide that by two and we get an area of three million dollars that is two times three divided by two is three million dollars our new area of consumer surplus is three million dollars so we're going to go over here and we're gonna actually start to calculate the new total welfare and that is consumer surplus plus producer surplus our consumer surplus is now three million dollars down from 12 we need to find the area of producer surplus though first let's outline it in purple you might be inclined to say well producers are obviously much better off there's a much higher price in they're producing a much greater quantity however we cannot conclude that all producers are going to be better off because not all producers are going to be able to sell their beef at a price of seven dollars in fact the quantity demanded is only three so our area of producer surplus only goes out to three million and below seven dollars so whereas more beef will be produced the area I am outlining in the dashed purple line is not beef that will be sold so it is not included in the area of producer surplus our producer surplus is now the area outlined in the dark purple line we can calculate that area by dividing it into two smaller areas and finding the areas of those so this is three so this rectangle here has an area of 7 minus 3 times 3 which is 12 million and the smaller triangle down here has an area of 3-1 times 3 divided by 2 which is 2 times 3 divided by 2 is 3 million so our total producer surplus you can find the producer surplus here is 12 million plus 3 million 15 million dollars so yes producers are better off some producers are better off however there are 6 million pounds of unsold beef in this market so not all producers are better off only those who are able to sell there at the higher price of $7 the excess supply the surplus beef that this creates will go unsold and the producers of that beef will end up with unsold product on the hands so the total producer surplus is 15 million giving us a total welfare over here of 3 plus 15 18 million dollars how does the total welfare at the higher price of $7 compared to the total welfare at the equilibrium price of $5 well we can compare it 18 million compared to 24 million is society as a whole better off or worse off to answer that question we must determine the amount of dead weight loss and that is the loss of total welfare when a market is producing at any level other than its equilibrium in this case the deadweight loss or the loss of welfare resulting from we can call this the welfare loss this market producing that a higher price and a greater quantity is 24 million minus 18 million which is 6 million dollars let's look at our graph and see if we can find an area representing the loss of welfare resulting from this market bean and a disequilibrium so what we need to look for is the area of total welfare that no longer exists in this market and that's pretty easy to see the area I'm outlining in blue used to be included in our area of total welfare however now this area has been lost due to the disequilibrium that has resulted in the market we can calculate that area just to prove that that equals 6 million dollars we have a height of this triangle of 7 minus 3 that's 7 minus 3 and we have a base of this triangle of 3 to 6 the 6 minus 3 that's 3 and we can divide that by 2 to find the area of our triangle so our deadweight loss equals 7 minus 3 that's 4 times 3 divided by 2 which is 6 million dollars there we have it 6 million dollars is our deadweight loss this market is less efficient by the amount of 6 million dollars because of the higher price so what does this have to do with things we will study in the class in future units we're going to look at situations in which markets are not allocated ly efficient situations in which the government has intervened in a market to try to help either producers or consumers for example through the implementation of price controls or taxes on the production or consumption of goods or subsidies for producers and consumers and what we can conclude is that anytime a market is not producing at its equilibrium point there is a loss of total welfare this is what we call the deadweight loss and the market is said to be in efficient so in this lesson we've explained the situation in which the market has gone from being efficient and at which total welfare is maximized in other words the total benefits of consumers and producers in the market is maximized to a situation in which the market becomes inefficient and there's a loss of total welfare anytime a market produces at a price quantity combination other than equilibrium there will be a deadweight loss in that market in the future we're going to learn all about scenarios in which markets are inefficient and we'll be able to observe identify and calculate the area of deadweight loss resulting from a market producing at a level other than its equilibrium price and quantity
Up Next

7:59
Supply and Demand: Market Model Foundations in Microeconomics
@NickHuntingtonKlein
112 views•2021-10-05

5:07
Impact of Yuan in Indo-Russian Trade Amid Sanctions
@WION
261.9K views•2022-07-01
6:41
Finding Equilibrium Price and Quantity with Linear Demand and Supply
@JasonWelker
286.7K views•2011-10-04

113:18
The Age of Easy Money: Fed & Inflation | Full Documentary
@frontline
21.2M views•2023-03-15
Related Study Plans & Knowledge Roadmaps
Structured learning paths in Economics
economics
Sovereign Debt: Defaults, IMF & Restructuring
01Introduction to Sovereign Debt & Government Bonds
02Debt Sustainability & Credit Ratings
03Anatomy and History of Debt Crises
+ 2 more learning modules
12h5 modules
Explore Roadmap
economics
Market Design: Matching Theory & Gale-Shapley
01Introduction to Market Design and Price-Free Markets
02Two-Sided Matching & The Gale-Shapley Algorithm
03School Choice Systems and Mechanism Design
+ 2 more learning modules
10h5 modules
Explore Roadmap
economics
Impossible Trinity: Forex, Capital & Policy
01Introduction to Monetary Policy and Central Banking
02Exchange Rates and International Capital Flows
03The Mundell-Fleming Model
+ 2 more learning modules
8h5 modules
Explore Roadmap
economics
Healthcare Economics: Market Failures & Systems
01Introduction to Healthcare Markets and Market Failure
02Asymmetric Information and Adverse Selection
03Moral Hazard and Insurance Design
+ 2 more learning modules
12h5 modules
Explore Roadmap