










![Simplicial complex and Euler characteristic [Subham Paul]](https://i.ytimg.com/vi/7VjAUiWeetQ/maxresdefault.jpg)












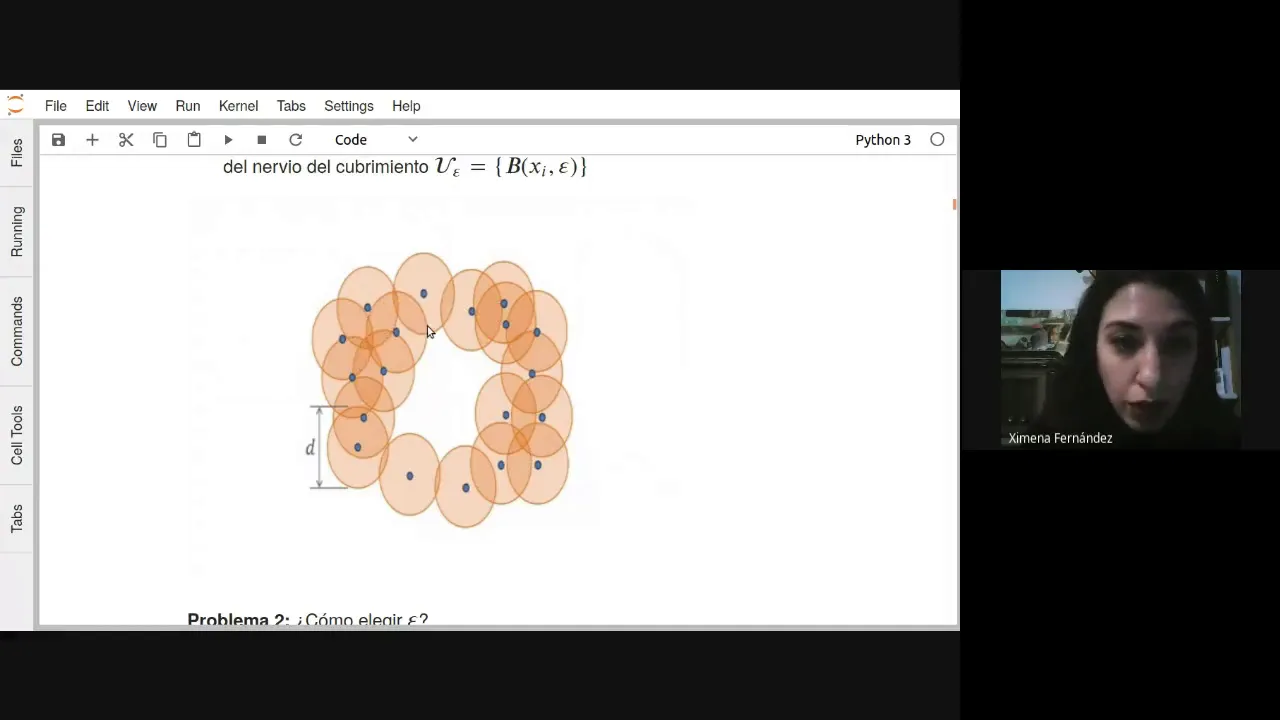
This tutorial introduces Python tools for Topological Data Analysis (TDA), focusing on computing persistent homology using scikit-tda and teaspoon libraries. The core concept involves analyzing point cloud data by constructing filtrations (such as Rips complexes or Cech complexes) and computing persistence diagrams that reveal topological features like connected components (0-dimensional) and loops/holes (1-dimensional). Points far from the diagonal in persistence diagrams indicate significant topological structures, while points near the diagonal represent noise. The tutorial demonstrates practical applications including analyzing annulus shapes, random graphs, and time series data converted to networks, showing how persistent homology can distinguish periodic behavior from chaotic dynamics.
Python Tutorial on Topological Data Analysis | Elizabeth Munch
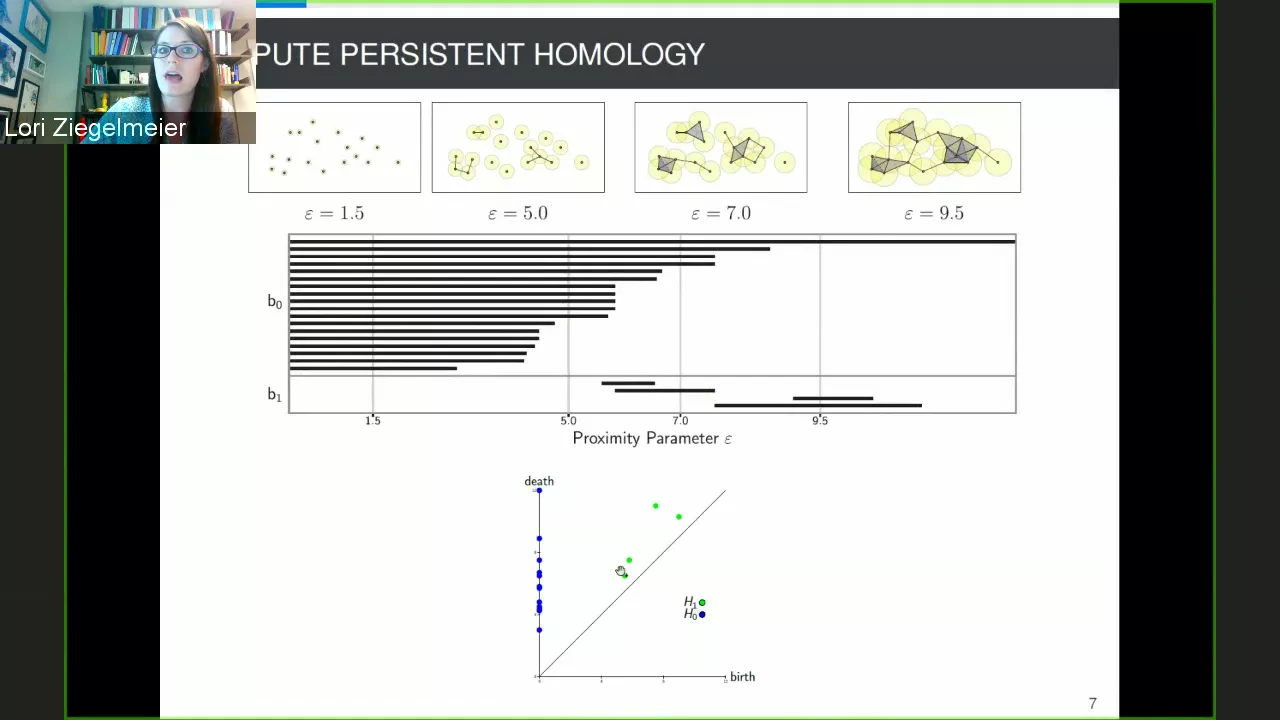
Added:okay so why don't we go ahead and get started um so i'll be moderating and it's my pleasure to introduce um liz munch she is a assistant professor in a couple different departments both the computational mathematics department and the department of mathematics at michigan state and while this is a tutorial i also want to point out that liz's research is work that i really admire especially the connections between dynamics and and and tda and i don't know if any of her research work will show up but please also take a look at those things so with that i will turn it over to liz oh thank you mason that is the the nicest introduction i could get um i appreciate it so yeah so uh welcome so i'm going to be talking about uh basically trying to give you a first introduction to how to access python how to access a lot of the tda tools that michelle was talking about earlier in python um and so many many thanks and cheers to michelle for uh doing a lovely introduction before this i'm gonna have almost no definitions and so just as a general note please feel free to uh post things in chat i'm sure people can help out and also whenever we get to stopping places you can stop me and i can go back and clarify things i'm gonna try to draw and explain as much as humanly possible but i'm happy to uh expand on these notes these are sort of a bare bone skeleton as opposed to a fully fleshed out introduction um so with that let me tell you approximately what my goals are for the next hour so i'm going to give you sort of a basic overview of some of the available packages i'm really going to focus on two there are a ton that exist at this point so it's it's hard to really like i can't give you an example of all of them but there are lots and lots of options which is which is wonderful to see i'm very happy the open source community has been fantastic for all of this um i'm going to give you some basic pipelines for computing uh in particular persistent homology um for some some basic input data i think it was uh yesterday was that daryl had said something about how his his uh his explanation was essentially a a starting place as opposed to getting you all the way through anything you would ever possibly want to do and that's kind of that's kind of where i hope to get you by the end of this uh right so uh things that i'm not going to do so the first thing that i want to point out is that topological data analysis is a lot bigger than persistent homology um we do tend to sort of default to that because it's got the most uh robust computation the most robust understanding of the theory but there's a lot of other things that happen in tda and i would highly encourage you if there are sort of things you want to do with your data that might be shape related but don't necessarily fit with the persistence framework that there are lots of other things and i know i'm i'm involved in a small group session at some time later today and so i'm happy to chat more about those sorts of options later um so yeah i had posted this earlier these links should be all over the place and you should be able to access them but so everything this is actually a new system that i am trying out so i'm going to apologize in advance if we have technical glitches but i can basically turn a jupiter notebook into slides so my slides are exactly the jupiter notebook that you can download either directly from the github repo here or um you can run them from uh binder here let's see if i can i don't know if you guys are getting my can i turn off the captioning so i'm not watching myself being captioned ah yeah yes there we go okay okay good got it found it thank you okay i don't know if that was coming through for you guys it was just really distracting okay um right okay so so hopefully so okay right so there's two ways for you to access these so everything's available um for download on the github repo and i've also set up a binder link so in theory if you click on this link you should be able to run it directly in your browser it takes a little while to compile and create the um the local environment but if you don't want to install things on your computer you can try that out and see how it works okay so with that let's see if this works ha okay all right so let me let me start by saying um how wonderful it is that there is a ton of available software at this point um there's a huge amount of in particular open source software for interfacing with a lot of persistent homology specifically and tda more generally constructions that were that we're going to use um so i've got a complete okay i'm not going to use the word complete because it's i'm sure it's not complete i have a very long list that is entirely contained in the in the jupiter notebook there's a lot of people that have been doing this stuff for a long time there is code in various uh various languages so i tend to default to python but there's a lot of people that work in julia and c plus plus and matlab and r and all sorts of other things there are code banks that do um uh different sorts have different sorts of focuses so um a lot of our focus today is going to be on uh rip sir because that is one of the um easiest uh entry points to doing uh persistent homology so we're going to use ripster which is actually inside of scikit-tda but there's also ways to access persistent homology from things like cubicle complexes which is especially helpful if you're doing things like images or 3d scans there's versions where you can change the input filtration there's versions where you're focused on actually just computing metrics there's versions where you're interested in computing the machine learning featurizations depending on your use case different code banks are going to be more useful or less useful to you and so by no means should you assume that everything i say today is the only way to go about any of these tasks is sort of the my first ditch effort of where i would access a lot of these things so i'm going to focus on two of these today oh let's see oh i think i can let's find out if the annotation works that work ha all right um so i'm going to focus on two of them today uh so the the big one i'm gonna use um for a lot of the workhorse uh um sort of computation is scikit tda um so this is started by nathan oh they're the typo nathaniel saul and chris trayley um but it's a again it's an open source community there's a lot of people that contribute to this um it's really fantastic um and then the other code bank i'm gonna use is the one that i've been developing um teaspoon which a lot of the focus is on doing um topological signal processing which is like mason had mentioned earlier this is a lot of the things we've been doing with dynamics but there's a lot of other things that are in there too um and i'm also used to it so that's where a lot of our code is okay so that being said let's find out there we go all right so all right so first thing to do is to import all of your stuff so if this is working hey it's working okay cool um so you're going to want to import all this stuff so let me just point out all the the things that i'm importing so there's sort of the the standard imports that you should be used to i've got a couple of things that are imported from scikit-tda the big one in here is um importing scikit-tda's version of ripster which is a python wrapper for oric bauer's original c plus plus code um so yes this is the main thing that's going to do all of our persistent homology computations for us um and then i've got a bunch of stuff in here for um from teaspoon so a teaspoon i've got some things related to some drawing some data i like making a lot of example data sets and then i am going to do at least one example coming from some signal processing so there's some stuff for generating a particular example down here the main ones to know is that to install these things is really nice and easy so pip install scikit tda will import all of these things rip zero person all the other pieces uh pip and small teaspoon will install all of our code okay so hopefully that all imports for you and if not i don't know what to tell you um in any case so let's see so let's let's start with sort of the the most basic example i can think of which is um computing persistence on an input point cloud right so the idea here um and again this is you should think of uh michelle's fabulous jigglypuff point cloud which i really need to steal at some point michelle i love that thing uh i should have put that in here that would have been great um actually you could probably import this in here if you can figure out how to get her point cloud uh but um so what's the idea uh so the idea here is that i have some sort of input point cloud data so here's my annulus example so let me just talk you through a few of the parameters if i have a pen i do have a pen um so uh annulus so this particular code all it does is generate sort of a very simple annulus for testing things and the main things we're doing here is we're pulling some sort of uniform point cloud that has uh little r as that dimension and big r as that dimension and so um if i mess around with my parameters up here i can change my input point cloud so we might go back and do that later um but yeah i'm trying to make these notebooks as easy to modify and play with as possible because i do think that that's the best way to try to get access to um some intuition for how all of these things work all right so what's going on here so basically what's getting computed is p is some sort of point cloud which in this case if i were to print it out oh i think i can change that wait let's see the whole point of these is i should be able to modify my code oh yes except i don't want the pictures okay um all right so so what's my point cloud my my point cloud is basically just an n by in this case n by two matrix which is just telling me all of my points so each point is let's see something like x so this is like x comma y right um and i get however many in this case i think this guy's got 200 rows or whatever right um yep and so if i just plot the picture then i've got my my nice little point cloud there right so if i want to change this guy right so uh this is basically just going to tell me that p is some sort of numpy array and in this case it's a 200 by 2 matrix if you want to have point cloud examples that are in higher dimensions all you need is a number of points by number of dimensions matrix for a lot of the things i'm about to say for the purposes of drawing pictures and explaining examples we tend to knee-jerk to two but there's no reason you have to knee-jerk to two dimensions okay all right so this is just a script that i'm gonna need so that you don't have to see this code over and over again to draw pictures we're gonna ignore that okay all right so what are we doing here so p if you remember was my point cloud that's that guy um and so uh this is how easy it is to run persistence um ripster dot ripster of p uh gets me out all of the stuff i would potentially want from from ripster for my diagrams um and then bracket diagrams gets me the actual diagrams themselves so here's uh here's the script i actually just ran so i could draw some nice pretty pictures so let's take a look at what just happened here all right so i've got my uh my point cloud over here where is that come here there we go i've got my my point cloud over here on the left so this is my p um and the way that i'm drawing this right now is i'm drawing different dimensions of uh the persistence diagrams right so um michelle had talked about this earlier but essentially if i'm looking at the the dimension of the um the diagram tells me something about the dimension of the information i'm looking for so zero dimensional gets me something about connected components and then one dimensional gets me something about in this case loops right and so the intuition here that we should be getting is that since i've got something that's basically one giant connector component when i sort of blur my vision enough or or expand my disks enough um is encased in the fact that i've got pardon me a single point in the persistence diagram that's far from the diagonal so i've got a component that's excuse me born at zero um and essentially this red square bit means that it's an infinite class it never fills in for this particular drawing version if i look at the one-dimensional information i have a one-dimensional point that is far from the diagonal in this case i'm worrying about things far from the diagonal here so this point right here represents the fact that i have a one-dimensional class that's born at whatever this time is and dies at whatever this time is so born and dies in this case i mean is created and fills in so once my connectivity gets around oh 0.3 ish right i'm going to have enough connections here that i actually get this loop in this annulus looking thing right and once my connections get big enough 1.8 ish or whatever that is my connections are going to completely fill in this middle bit and that that loop structure is going to go away now what's also nice about all of this is that of course you can see all of the points that are close to the diagonal so this is why i tend to knee-jerk to working with persistence diagrams as opposed to barcodes they store the same information essentially so uh it's it's sort of a personal preference and aesthetics at this point um so all of these things down here are small loops that are born and fill in uh relatively quickly so there's probably some like loop structures in here that are going to show up in your homology that show up at relatively small values of my filtration parameter and then and then fill in at again whatever time these are but that's kind of a smaller loop generation so for a lot of things that we do with persistence um we tend to like to look for high persistence points points that are far from the diagonal this is sort of opposite of what you would do in a lot of other data science contexts where um we like we like the outliers we're usually looking for outliers okay oops come here cool all right so let's talk just uh briefly about how psyche tda stores all of these diagrams um right so if so data so this is supposed to be me just outputting uh computing the persistence of p um so if i actually print let's get this guy out of the way nope there we go all right so what's going on in here so so what actually gets output by ripster is a um dictionary uh with a bunch of this additional information for the purposes of what we're doing uh the only thing i'm actually really going to care about for this tutorial is the diagrams information there's a bunch more information that's stored for various other purposes co-cycles stores some information about um there's some weird technicalities but it's got something to do with actually finding the loop representative that gave you the point in the persistence diagram that had to do with your um your diagram with a whole lot of caveats that i can go into in later later discussions um this has something to do with i believe the number of edges that it actually computed in the um in the filtration um one thing to point out is that uh one of the reasons that persistence goes kind of slow compared to other um other kinds of machine learning uh or um other sorts of code banks is that uh you you have to build gigantic simplicial complexes to do this um and they are exponential in this number or the dimension of the simplicities you want and so uh we spend a lot of time being very concerned with trying to make our complexes as small as possible before doing any of these actual computations on them um there's some other information that's that's kind of stored in there again for for the purposes of this talk we're not actually going to really use those but you can play around with those as necessary uh so the let's see what's in here so diagrams itself actually gives you a lit i believe it's a list of arrays um and so the entries in the list the order that they pop out has to do with the dimension of the diagram that you're interested in so for all of my examples everything's in two dimensions which means i only have interesting stuff going on up to dimension one basically so what gets spit out in these cases i think tends to always be let's take a look length of the data is just two so in this case it's giving me zero and one-dimensional diagrams and that's it if you have a longer list that pops out you've got higher dimensional structure that you can try to interpret accordingly so let's see so the other thing i do want to point out if i take a look at these persistence diagrams so like i said persistence diagrams so this is the one-dimensional diagram um so this guy is just a uh again it's going to look very similar to the point clouds but it's a many by two dimensional um output unlike the input point clouds the output of the diagram will always be something by two right so the two is the birth comma death time so we're always going to end up with two dimensions here and the other thing i'll point out and different code banks do this differently but so here's my zero dimensional diagram and in this case i do have an infinite class i have a class that lives forever so this particular code uh actually stores it as np dot inf which is helpful um one warning is that other people's code does other sorts of weird representations of infinite classes differently and so that's a thing to go check if you have bugs and strange stuff going on i know from experience um all right so let me just give you a few other examples um so here's just this is just straight noise data so my my cube data all this does is uh generates a bunch of random points on a box um and so if i draw again this is code that's included earlier just for doing all the drawings um but basically what ends up happening here is i've got nothing particularly large in terms of loop structures cycles anything like that right and so i'm probably getting some of these loop things in here which is why i've got you know some distribution of points on the diagonal but i've got no clear overarching circular structure and so i don't see anything far from the diagonal all right uh this is just for fun um actually we will use it a little bit later um so i wrote a quick quick script that will build an annulus for or a double annulus for me um again these are just kind of nice example starting uh input data sets um so all i did here was basically take two annuli and shift them and move them around so all this code is doing is just playing some games that actually um messes with these annuli um and so in this case uh yep i've got this double annulus over here so i can do things like mess around with uh the size of each of the holes and i think i make that two that'll do you can get things that are closer to each other further from each other etc uh would i have that at three leave that there okay so let's see what happens with my annulus so okay so if i try to think through my intuition so what should go on with my persistence diagram so oops come here there we go so overarching circular structures that i have right i've got sort of one sort of loop structure that shows up over here and one sort of loop structure that shows up over here right so my best guess for my persistence diagram should be is i should have two points pretty far from the diagonal maybe born at some like slightly different times etc and then i should probably have some noise going on down here right the noise coming from the fact that you do have a bunch of little tiny loops but nothing that fits with that big overarching loop structure all right so let's go take a look at that guy if i did it right let's all cross our fingers hey not bad all right so let's see so what do i got um so all right so let's take a look at what's going on here so here's my my double annulus code again just to be able to mess around with it and what i can see over here is that relatively well separated we can kind of play with those later i've got two points that are pretty far from the diagonal and then i got a bunch of stuff that's probably considered noise so if i got this in some sort of uh application context i would probably tell you immediately that you have some sort of you at least have two circular structures i can't necessarily tell you exactly what the underlying space is but i can tell you that there's something interesting going on back here so let's see so i should be able to let's see if i can mess around with there we go all right so now it's okay so i've got my two uh far from the diagonal points i should be able to mess around with the size of that other hole how do i make the size of that other hole let's find out if this works yeah all right so let's take a look at what just happened so all i did was change i believe the r the little r2 value up higher so what did that do that expanded come here no pen is not bad but it's a little wonky all right there we go okay so this is my r2 value is the size of that piece of the annulus all right and so what's going on here well now i've still got two circular structures but when they when they die when they fill in um the second one got uh moved up right so i used to have a point down here which i don't anymore right it got moved up here because the death time happens later so essentially the way to read off these kinds of diagrams is that if you're looking for if you're looking for structure the further the further to the left means essentially something about the the denser the point cloud that created that because um in order to be born earlier you have to have your connections happen at smaller values and something about uh how high up um so death value has something to do with sort of like how how wide the circular structure is um so one another way of thinking about this is that there really is some geometry hidden in all of this topology because there's there's something sort of um inherently measuring the embedding of this point cloud we're really measuring this uh space size of these holes oh right okay so that's probably a good place to take a break for questions do we have questions things we should talk about yes there are um there are some questions um um so a couple of them on the clarifying end um so are there are the points for the cube example called noise because it doesn't show you the structure of a box um it's just because of how i generated it and it's just it's called a cube because i called that particular script a cube right so in that particular example um where's my my cube example sorry is oh that doesn't clear can it clear no hold on one second yes clear yeah okay all right sorry um this particular um generator of random data all it does is it draws random points on a box uh 0 1 to the n so that's all it's doing it's not necessarily sorry that's a that's a terrible i am now understanding why that is a bad name for this it is not actually data it's data drawn from the interior of the cube not the not the outside of a cube or anything like that okay i mean another another question was um do the do the outliers represent the size of the void yes yes yes yes so um so the idea let's go back down to this guy over here it like moved all of my things that's okay delete there we go okay um yes so so for instance okay so let's take a look at you're going to work there we go all right um right so if we if we remember what each of these points means right so each of these points is uh birth of a in this case one dimension means loop structure and then come a death of a one-dimensional loop structure right so this is something about the radius um of the discs that made that started creating so one of these guys it's hard to tell in this case they're really close um the radius that actually made it so there was a full loop that went all the way around all the way around uh what time it fills in has something to do with how spread out it is right because i need to get all of these connections across the middle to be able to fill it in and to have the the loop essentially die in homology um so fun things you can do if you generate a point cloud that looks like an oblong annulus looking thing uh what'll end up happening in this case is that your connection so so birth happens when again we connect everybody around so that's you know whatever um and then death happens when you get again all of the connections that go across well in this case all the connections going across happen having something to do with colors colors uh having something to do with the the width of the squishy squishy hot dog looking shape right um and so uh this is very tightly tied to the embedding of the circle itself right so this is also one of the interesting things that happens in terms of standard homology versus persistent homology standard homology can only say and say something about the fixed space that it's handed right and so to a topologist a standard topologist these two things are the same right but if i'm actually trying to study their embeddings which is really what we're doing here uh the persistence is going to look very different because the the cycle that's here is going to fill in at a very small value whereas the cycle that's born here is going to fill in it's going to take until it gets across the whole circle right so this is when you need to uh there's there's interpretation issues sometimes in terms of understanding what's going on and also you can mess around with these things depending on how you choose your filtrations and other sorts of things that can mitigate some of these issues depending on what it is you're looking for there's one more to ask now i'll save the others for later but um one question is should the persistence of diagrams not depend on the size of the circles um depends on the context yeah yes that is very that's the that's the art not the science right so um it is inherently dependent on the size of the circles right so again this is why a topologist would probably someone would call this heresy right because my circles are different depending on the size of the circles right um there are ways to mitigate it you could normalize all of your data and then everything is going to look probably a bit more uniform but sometimes i do actually want to have an understanding of differences in size and so it's it's that's very much dependent on the application you're interested in how you want to deal with that okay so we'll we'll leave other questions um for later cool okay all right so let me let me modify this definition a little bit to uh to a sort of um fun cheap trick to play around with these things uh so i am only going to use the click complex for this particular tutorial um so like michelle had noted earlier there's a bunch of different ways that you can define filtrations the perk of the click complex is that i can mess around with ripster to accept basically anything i want as long as it's in a click complex form if i'm going to do something else i got to work a little bit harder they're available they're just harder so at this point i'm going to assume that any time so so what is what do i mean by click complex uh i mean that let's get a good color um i mean that uh if i can add a simplex i do add a simplex all right so what's going on here so if i have a simplicial complex that say looks like this right so um a lot of these things are defined by telling you the underlying graph um the underlying graph is often called the one skeleton because it's skeleton because it's the one dimensional information in your simplicial complex uh the clip complex basically says that if i see a triangle anywhere i i'm going to assume that i have the triangle the triangular simplex included in my graph all right anything else that i'm going to have to be a little more careful about telling you information about when triangles get added or not um some examples of when we might want to do this so so we're going to play around with um things related to essentially uh distance or similarity matrices uh and this is again a cheap trick because this is exactly the point cloud version just with some other input inputs um and we can mess around with things like weighted graphs we can do some other interesting things to to build some um some filtrations all right so uh so right so um what i'm gonna do is i'm going to start with some sort of weighted graph and given this thing i can build a filtration in the following way do i have my picture i do have my picture okay let's go there in a second um the idea is that we're going to keep all of the edges i can that have value in my weight my weighted value for the edge if the value is less than or equal to a i'm going to keep it i'm going to basically keep putting in edges in order of their weighted values until i run out of edges and i'm going to put them in an order of the the waiting um depending on what we're doing here this may or may not be more interesting if you have a rather dense graph again this is all very context dependent and at that point it's um opinion and aesthetics as opposed to requirements all right so here's my my very very simple example so we can mess around with some of the innards all right so uh what i'm going to do is i'm going to define a pairwise similarity matrix d based on essentially building what's called the the weighted adjacency matrix um and so once i have a weighted oop come here there we go once i have a weighted adjacency matrix i can define this filtration so what's going on here i've got my nice little graph here and again i'm sort of thinking about everything as being a a click complex so my triangle is there because i can see it what am i going to do i am going to assume for the purposes of this that my vertices all get added right away and so what happens i'm going to start putting in edges in order trying to figure out what's going on right so the first edge that gets added is this one so k sub 1 i think that was the notation michelle used earlier the first entry in my filtration is going to be everything that's got function value less than or equal to one um what happens next well uh i make this k sub 2 which means that i'm going to add this edge in all right so what changed from k1 to k2 well i had does control z work course not i had one one two three four connected components and i i merged two of them so i'm down to three connected components one two three uh what happens next i build k3 which means basically just add in this particular edge all right what happens i've gone from having three components to two because two of my components merged together uh let's see what do i want k sub four what happens there i add this particular edge i'm using a click complex so i actually just add in that triangle which means i still don't have any loops in my in my setup because i've added the triangle and i'm still at two connected components what happens next one two three four what was i at four k sub five if i add in k five i connect these two edges together now down to one connected component but nothing going on with loops and in this particular example my loop is added at the very end so now i'm going to have a loop in my first dimensional homology one connected component and we're out of stuff to do so that's the end all right so let's see how we can do we can make rips or do this for me right so okay so here's my picture all right so um this is me just inputting the data that i want to be able to hand to ripser all right so what's going on here so i've got my matrix which is representing uh all of my vertices this is my json c matrix this is a b c d e right in this case i assume that all of my vertices were born at time 0.
you can mess around with this if you really want to you can change your input times but we're not going to do that for the purposes of this example and the way that i chose to deal with the fact that for instance i don't have an edge between a and c is that i stuck in infinity essentially uh the idea here is that if i'm building up some sort of filtration i never want to add that edge and so uh yeah i make it infinity all right and so this is all the data that i'm going to pass to to ripster in just a moment right so uh let's see what we got here um so here's the fun trick um so before we did ripster.ripster of p so we just had our point cloud what i'm going to do for this is i'm going to do ripster.ripster but i'm going to do the distance matrix equals true so all this does is tells ripser that i am handing it the distance matrix instead of it having to do it for me what does what ripster's doing in the background if i handed a point cloud is actually creating the distance matrix and then doing everything it's about to do on on my particular example right um so let's see what happens there ha isn't that nice right so here's the uh the persistence diagram for the thing we just drew right so if i i didn't put in a script for actually drawing but that's okay we can do this one pretty quickly right so my persistence diagram my zero dimensional diagram is that i had a death at one two three five and then i've got some sort of infinite point up here and then i've got my one dimensional diagram just has a point at we're going to call that six comma infinity that's my one-dimensional diagram right why is this uh why is this guy infinity well if you remember from our example the end of our example just had a single loop it never gets filled in and so it in persistence land lives forever um all right let me let me make a a bigger example that you can play around with again these are all built to be able to play with parameters and i highly recommend it oh this is just a script for drawing ignore that okay um all right so i can draw a random graph so in this example i'm going to create an error disregard graph oh that is a really boring graph that one's better okay if you run it again you can get a new random graph isn't that great all right so let's see so what's going on here so in this particular example i am uh adding edges with the probability of a third well thirty percent um and in this case i just added some random weights to the edges right so if you see on the edges there i've got some some weights included uh just so we can mess around with this idea right so if you are in an actual application you're probably getting your weights from something intelligent um in this case i'm just playing all right so let's see what we got all right so uh this is my relatively hacky script that i got working finally this morning uh to take my adjacency matrix and stick my weights on it so that's all this is doing if i want to visualize what the weights are in this case white is infinity uh and the rest of them are the the various function values all right and so this is what i'm going to pass to ripster please work please work please work hey oh it's always a good day it's tiny but it is working um all right so where did my pen go there we go all right so what is nearly impossible to see right here is that i've got uh some infinite uh lifetimes up here right so uh probably because my graph has some underlying cycles and then i've got some information about the connected components in this case h0 is always going to land everything all the connected components are born at zero because it's when the vertices got added and everything merged into one connected component because i had a single component graph let's see um all right let me let me show a quick example from from some of the things that uh we've been doing lately so um uh this is a paper that uh uh me and my collaborator ferrous kasamine and um his student auden meyers have been working on where we were doing we were particularly interested in studying representations of time series uh so let me give you the massively cliff notes version of this oh can i do full screen maybe that's that's probably a little better all right so let's take a look what's going on here um so again there's a bunch of math background that we're not going to really talk about but the main idea here that we were interested in was that we got as input a bunch of time series um we were actually generating them from some random dynamical systems um and we could uh turn these things into a network by looking at what's called the ordinal partition network so the idea is something to do with this is very closely related to um tokens embedding or the delay coordinate embedding if you've seen any of this stuff and you can start essentially representing where you are in state space based on these different sort of permutations so what we did was based on the shape of these three red points you're at a different vertex in your uh particular um in this network that we've constructed and then we were trying to analyze the networks themselves all right so let me just show you how this party works in our examples uh yep you can ignore this code this is just for drawing things in a moment all right so all right so what are we going to do here so we were generating time series out of the rossler system so in this case this is wrestler with a um some parameter settings that give you a periodic behavior right so my input in this case was a time series that looks kind of like this guy um nope page down there we go um all right so i again this is you gonna work hey all right so i don't know why it's all the way down there that's better all right um all right so so what are we doing in here so the rest of this was essentially trying to take those time series and construct some sort of network out of them so here's my here's my network and what was uh what we were noticing with these things was that the networks themselves especially in this periodic case had these nice loop structures that we were trying to encode in this information all right so if i take the persistent why does it keep doing that there we go if i take the adjacency matrix information i'm actually doing something slightly different with this than the previous example so take some of this with a grain of salt but the idea was that we were constructing we were trying to measure something about the loops and so in this particular example right we can see that there are sort of two loops that are pretty relatively far from the diagonal and there's some noises contained down here for some for some reasons uh there are just a little bit um unique to this paper our one-dimensional classes were all born at time one so we end up with actually everything in a straight line up and down but the reason i like this is because if i do the same thing with a chaotic time series so let's see if you work all right draw pictures come on there we go right so this is the same example but with a slightly different input time series my network this one actually has a decently large loop but a lot of them just kind of look like hair balls and so a lot of what we were doing was trying to quantify uh quantify the difference between circles and hair balls um right one of the reasons i wanted to explain this uh i talk about this particular example is the multiplicity issue all right so what's going on here so that previous diagram we were looking at right so this is this is the diagram we were looking at before right so this is um this is the hairball version from before uh when you visualize it like this if you if you just automatically start drawing pictures and that's all you look at this is what tends to pop up the issue that oops the issue that tends to get hidden in here is that uh these pictures tend to overlay multiple persistent points at the same value on top of each other right um so in particular for this example we had a bunch of these little loops and draw here we go we had a bunch of these little loops you can see there are a bunch of classes that are at one comma two right there are a bunch of classes that are at one comma three um there's just the single guy at one comma four um but this is something to be very aware of so if you are messing around with your persistence diagrams a lot of times having multiple points on top of each other means something very different than having a single point at a single location right um this is sort of unique to some of these very combinatorial versions where like i've just got these integer values and they tend to land on top of each other but it's definitely something to think about it is worth it to go back and take a look at the actual output of your diagrams don't always just trust the output pictures let's see i think that's a good place for another break if there are more questions mason okay let me try to get on some clarifying ones there have been a few questions about code but there's people are um kind of asking answering them um one of the ones that i want to bring up is maybe slightly less on the clarifying end but people have been discussing it back and forth so i think it'll be good to get your comments on it is how sensitive are persistent diagrams um to relative distortion point cloud it was asked initially in the context of the torah thrips in the chat but i think people have been going back and forth about whether stability theorems and so on yeah um right so everything that we're doing is very very tightly tightly tied to your choice of filtration right and sort of with that your choice of metrics your choice of um yeah via taurus rips versus check complexes all those sorts of things um the nice the nice part of this is at least for the if you're doing nope work work and it hates me all right hold on let me close this and try opening it again see if this works okay other than that cool i killed all my annotations this is why you never trust new software all right we're not drawing with that anymore um let me get a different something else i can draw with one sec nope all right let's see if we can see this nope no of course that's not gonna work sorry everybody technical difficulties there we go um right okay sorry so so the question was essentially about distortion in point clouds and choice of uh filtration the the game here is always that you want to define a filtration that gives you useful information about whatever your setup is right um so the first thing to know is that uh via taurus rips complexes versus check complexes those are actually really nice in terms of replacing one with the other the perk is that you can nest the check complexes okay so check complexes this is the version where you're doing unions of disks and intersections and nerves of these sorts of things they're always defined by a parameter r and you get a nested version of this let's see which way this goes rips complex of czech complex should be smaller theatre switch complex of r you get nested information which in standard euclidean space has something to do with don't 100 trust me on this something like the square root of two times uh whatever r value you've got uh i really should have known this one by now but it's something like that the idea being that i can always replace rips complexes with check complexes or sorry check complexes with rips complexes um for a couple of reasons the main one being that this one is computationally cheaper computation is cheaper largely because i don't have to remember when all of the triangles got added i don't have to keep track of all of the triple intersections and quadruple intersections or whatever else everything is defined entirely by the underlying graph um and the fact that i've got this nested behavior means that my persistence diagrams that come out of these two different filtration types are so similar it's fine for any type of data you're probably dealing with right so we do a lot of that so the other part of this is that essentially what you get out of it has to do with what your questions are and what sorts of um information you're trying to understand about your underlying system right so depending on the system um and depending on the type of input data you most of the time we do a lot of stuff with rips complexes and check complexes but you might want to define a different filtration based on something inherent the the easiest version i can think of where you might want to do this is like um if you're messing around with like uh uh co-author networks right so you've got uh author a writes a paper with author b writes a paper with author c uh who wrote a paper with author a this might be way different than if they all wrote a paper together right and so the information on these filtrations might be worth it to keep track of other other sorts of things i'm hoping that was the question that was asked and if not maybe we can discuss more uh more later too well let me know you'll get the whole transcript of the chat so you can also bring them i think some slack um a quick one the the network that you were looking at what did the nodes represent were they the states in the state space yes well they were regions of the state space so let me go find the oh i lost there it is all right so see if this will work um so yeah so in this particular example um the way we were doing this was yeah this guy um so the um the nodes in this case represent um the three points in my uh that i'm looking at in this uh delay coordinate embedding um the permutation order that they show up in so in this case x1 is less than x2 is less than x3 but in another location it might be oh let's see there's one x one is greater than x two but is less than x3 however however that works your state was dependent on uh what this shape was all right so again this is a this is a case where how you get into the networks is very much part of the um part of the whole setup there are going to be more questions about this one later but i think they're a little bit longer in in in nature so i think we'll stop these for now and take the rest of the questions at the end fabulous yeah i would love to talk about that with this is uh super fun stuff we've been playing with lately all right let me see if i can get to right okay um this is a good follow-up piece to the sort of discussion of uh rips complexes versus check complexes and all of that stuff too so let's talk about distances between persistence diagrams um so i know let's let's give ourselves some examples and then we can sort of try to get some basic understanding of what's going on here so i made myself a couple of example point clouds which i think i drew i did draw them all right i plotted them in the same place uh and i apologize if you are colorblind i forgot to change the symbols but i've got a orange point cloud which is a single circle up here i've got a blue uh point cloud which is a single circle down here and i've got a green point cloud which is a double annulus that i've i've built over here right and so if i compute the persistence diagrams for these guys which i should have done um i can basically draw them all on top of each other and try to understand something about uh the relationships between them all right um so the big thing to notice in here is that we've got are you gonna work again oh it works again it's a miracle there we go right so so the the main thing to focus on is the sort of behavior up here which is that one of my persistence diagrams my green one has two points far from the diagonal and that should also make sense because i had an angelus was my green one it's got two loops um and then my blue i uh oh yeah no delete there we go um and then i've got each of my other two diagrams have one point that's far from the diagonal all right so in terms of how similarity is computed two of these are very similar to each other namely the one from the blue and the one from the orange point cloud the one from these two um these two single annuluses annually annuluses i should know that by now um and the they are considerably further than than you are from the uh the green one so let's let's figure out how that works um so i believe michelle mentioned this i don't think she went into full details i will try to give a super fast overview of how this works but what's nice is that we can compute it really easily all right so what's going on here if you give me two persistence diagrams so in this example i'm just going to start by looking at the the blue compared to the orange so in this case pardon me in the blue compared to the orange i've got two points far from the diagonal and i've got some noise right and the way that this works essentially is to go find a matching so what happens here is that i'm gonna go look for if i'm given two uh two diagrams um a matching between two diagrams is essentially an association from points in one diagram to points uh in the other diagram with the caveat that i'm allowed to match things to the diagonal right so i could match this orange point to the diagonal i could match it to that blue point i can match it to some blue point over there i can do whatever i want to and everybody needs a buddy so you have to have a blue point match with an orange point and if you don't have a matching between those pieces then they've got to get matched the diagonal the intuition for that is that essentially having a persistence point that's close to the diagonal is a small loop that was born and closed up relatively quickly and therefore it should be similar to something that's not there at all ever all right so all right so what's going on here um the bottleneck distance basically what it does is it looks at all possible matchings that you could come up with and finds it's a it's a min max kind of thing so the bottleneck distance between two diagrams i'm going to call them x and y for the moment is oh let's get this one right the inf of the soup of the distance between x and uh the point matched all right so what's going on here so uh best possible matching so ada is supposed to be a matching uh worst point in my diagram in terms of how far it is from its buddy right and so what's nice about this is that this code i like the script that came from person for drawing this because they will actually draw the match that got you the worst case um thing so this little green line down there the length of that little green line i believe in l infinity distance but don't trust me on that for this code um is apparently 0.09 ish right so let's see so what happens if i change my diagrams so let's compare p1 and p3 so this is the one let me go back up and talk about that for a second so p1 and p3 where'd you go p1 is my single annulus p3 is my double annulus and when i'm comparing these two things remember i'm comparing something with one point far from the diagonal versus two points far from the diagonal all right p1 versus p3 so this guy right so i now have my two persistence points so orange uh i hope that these possibly don't line up with the previous colors many apologies um so i've got my two points from the annulus and i've got my single point from the the single annulus um and what's going on here is that when i come up with matchings again this this code draws this is the worst case matching the worst case piece of the matching um what's going on here is that these two are getting matched to each other and i've got this one leftover point that's still far from the diagonal and the best thing to do with it is to match it to the diagonal itself right um this is very different than something like if you were to try to do uh if this means anything to you how short distance between the point clouds you know treating persistence diagrams as point clouds this is going to give you something very different because even though everything's got something in the other diagram that's very similar it's not um if there's not a one-to-one matching between the things uh and yeah and so also to note this is also uh reflected in the distance so in this case my distance is 0.64 so what's that 10-ish times uh whatever we had for the previous guy okay right okay so so let me let me babble briefly about some other things and stuff i wasn't gonna have time for unfortunately um there's a lot of stuff to do and i think uh i like the way that michelle described it earlier too with uh um this is the kind of thing where you get to get creative with applications um that is kind of that's the the fun place that i like to work to is that there's a lot of these tools and giant hammers but a lot of this is trying to figure out how to interact with domain scientists with interesting data sets to find ways to actually apply these things in a way that makes sense and where you can interpret the results as something that is as useful and helpful um to them uh so some things i didn't talk about also that are really cool and i would highly uh encourage you to start you know these are the every single one of these things is rabbit holes um there are lots of other choices for filtrations other than okay liz has cut out um click complexes again kind of knee jerk to that piece did that that that yeah it does that sorry welcome back i've been teaching 1400 students calculus yeah this is this is what happens all right um apparently i speed up and sound like a chipmunk too so that's cool uh let's see so uh right sorry okay so there's lots of other things to do um one of the things that i didn't see i wasn't gonna have time for it um was uh looking at ways to get from these persistence diagram outputs into machine learning and statistics interfaces in a way that's um uh accessible and useful for a lot of these applications um so there's a lot of the sort of standard ones persistence images persistence landscapes template functions is something that i've been building recently there's a pile more of these so this is not at all a complete list um and again i want to emphasize the tda is not just persistence we do other things too one of the the things that we like to mess around with i like to mess around with a lot um are ribbon mapper graphs which are sort of excellent they they go straight into like a graph representation of certain um data um and some excuse me some certain variants of that merge trees contour trees more small complexes are very cool they're sort of higher dimensional representations you can study functions it's good there's a lot there's fun things to do um right so let me let me leave some links up for you which i think i think i add some of these very very late so if you don't have some of these links i will make sure to push the most recent version of the notebook i'm sorry uh i'm incapable of not changing my slides five minutes before a talk apparently um in any case so uh many thanks to uh on myers and chris trayley because i i borrowed judiciously from both of their lovely tutorials which has been very helpful i will point you in the direction of if you're interested in getting involved in tda one of the big groups that has been very active is the women in computational topology group it is not just for women we are happy to have people involved outside of that we have a very active list serve in particular so if you want to see anything going on in terms of uh like paper requests job postings all that sort of stuff i highly recommend that you get on our listserv um i do have a couple of papers that might be useful if you want to see some some sort of starting introduction so um i've got an introduction uh user's guide for for sort of some really basic high-level introduction and we recently wrote a bio-focused paper also um so with that i think i will actually before i end let me take three minutes because i am the last speaker to thank the organizers for a lovely lovely uh workshop this is fantastic so many many claps thank you to to you guys um and with that i think i'll call it a day all right thanks very much liz um i'm going to ask a small subset of what is there and hopefully the rest i'll give to you and it'll be good to have those discussions in in the slack um one of the ones i want to to bring up was one that got asked by a couple people early on and um this had to do with co-cycles there were a couple different related questions that were asked so one was um um you know showing an example perhaps of co cycles and how it lets you see which data give rise to certain features of a persistence diagram um but also maybe adding some detail about how you identify the figures so what's actually in them um just using them in practice as opposed to just a mathematical definition yeah okay so i'm i have i know exactly the picture i want which i don't have in front of me but i can i can find the paper later um essentially what's going on here is that uh when you're talking about a a loop and homology right so i've got whatever my simplicial complex is right so i've got this thing um and then i try to uh i do my persistent homology whatever i've got some sort of representative of um i've got my representative that i'm i'm interested in so in this case i'm interested in this big loop and so my software spits out that i'm very interested in this loop and and hey isn't that nice um what's weird about all of this stuff is that homology so you can have multiple loops that represent the same homology structure right so in particular in this example i could represent the same information let's find a better color i could represent the same information with this loop with the sort of intuitive version being that like i've got this uh two cell or uh yeah two so that i've got this this triangle that's going on here and i can sort of shove this green line across this triangle and get to this piece and i can kind of shove this green line across this triangle and get to this piece right that's a massively oversimplified version of it but the point is that if you ask me to hand you a best generator for my persistent homology a best loop that shows me exactly what's going on um it's not immediately available or obvious how to do that right um so so there there are people that can do this in sort of certain contexts in very specific cases but in general what's kind of happening in the background is some crazy linear algebra that i can't really get past um the way to to pull this trick instead is to actually work instead with um co homology uh which this gets uh into deep hairy weeds of what actually is going on here uh what really ends up happening sort of is that you take all of your um uh vector spaces that you've built with your chain complexes and dualize them and then what ends up happening is your arrows slip the other way and now you've got this chain complex that looks kind of like persistent homology but everything's backwards and then you're trying to move stuff around and you do the same quotients and everything yeah okay like i said lots of deep periweeds but the the main idea here is that once i swap out this direction my representatives i can now find harmonic representatives um but uh my harmonic representatives are now in this dual space so they're actually functions from the in this case well uh i'm not trusting my judgment right now but they're essentially function from like uh edges to uh we can mess around with this essentially get um get to the point that we've got uh functions from the uh vertices to the circle ah there's there's a there's a there's a lot of stuff i'm hiding in here um the point being that now what i can do is i can associate every vertex to some location on the circle um and there's a lovely paper by mikhail videmo johansson and i forget who else is on that paper and i can go find the link later um where they are messing around with this sort of idea and show representatives of their persistence uh classes that essentially then take all of their vertices and map it to where it is going around the loop and so that is uh you know mathematically easier to do again it's kind of weird to try to think about but it is an available option um what's going on with a lot of these things in the background in particular ripser computes cohomology instead of homology for computational reasons and so then we end up with that information instead which is again useful for for other sorts of outputs okay so i'm going to do um one final question here i know there's a number of others so so we'll want to move those over to the slack but the one final one i want to do is kind of i guess there's two related ones people were asking about um the dynamics in particular getting insights about dominant frequencies in the time series as compared to frequency analysis and then it was a different person's question but again with the dynamics of the cycles and the networks and the time series data related say to um periodic behavior and then maybe chaotic data might produce hair balls for instance yeah yes so yeah so a lot of the examples i was showing were generated because the periodic data does tend to produce loops in all of these sorts of setups um and so so those are the she'll come back those tend to be the easiest to find with personal chances so yeah so uh relation direct relationship to the frequency um i actually haven't messed around with that specifically other than um oh did my internet cut out again yeah but you're back though okay sorry um uh but yeah so so in terms of the the relationship between like fourier analysis and things yeah there's there's definitely a tight relationship in there one place to look for um some of the very specific uh relationships is uh jose pereira has a lovely paper um called swipers where he talks about sort of the specific relationships between the sort of persistent homology cycles that you can keep track of as related to the different frequencies um the it the everything that i showed in here is sort of a sort of fun it's it's related to the tokens embedding that you would get from that but we're sort of splitting up state space in a different way and without spending another 45 minutes on my other research talk um i can give you more specifics later but yeah okay so with that we'll close but i realize there are other questions to still discuss so let's let's thank liz again um we're going to end up having a couple of slides from from those of us who are organizers um to just do a couple final words while we have a longer break before we before we get to um we end up having a panel later um before i hand this over to to al um to lead us since i can take advantage of having the floor i'd like to thank the three people who i worked with these are three of the most wonderful people who i've ever met and who i really enjoy working with and so if you ever get a chance to work with them please do thanks so much mason all right so we are going to just close out now we still have the panel coming up in some small group discussions but we wanted to tell you what's going to happen next so first of all heather mason michelle and i would be really grateful if you would fill out the survey that we're going to put in the slack channel or in the and in the uh in the chat window now we would love to hear your feedback on what we did well and what we could improve uh the slack channel is going to stay open so feel free to use that to continue to build community past when the short course ends but keep in mind that discord will close so it'll just be slack we want to encourage you to email us at this complex system short course at gmail.com if you're interested in being involved in the proceedings volume that we mentioned uh and then we've also gotten some questions about videos and notes for the talks and the tutorials and the panels and the answer to those questions is that all these things will be uploaded to the ams short course website within about two weeks and then we are also going to be posting everything uh a little bit later at this website here it's quite a draft right now but this will be a publicly available repository going forward with all of the videos and notes okay so check the chat for for those links uh and then on behalf of heather mason michelle and myself we really just want to acknowledge and thank our incredible speakers and panelists for um all the work that they've put into preparing for this into leading such lovely uh presentations so daryl liz ready at sandra joe nancy shelby chad and jennifer um thank you so much for for being part of part of her course uh we also wanted to acknowledge and think the tech support so we've got mary in the room right now from convex and give a special shout out to all those people because there were so many people so many participants involved who actively jumped in to help with coding issues and help coding channel or who were involved in this google spreadsheet to organize uh self-organized groups or even in the chat during the during the talks answering questions so thank you to all who passed on resources and to our participants for being so actively engaged and then kind of almost finally what we really want to shout out to is the american mathematical society staff who have been working with us for the last year to to prepare this course so tom barr heather butler laurie malucci and penny pina and we especially want to highlight lori who has been uh involved in so many emails over the last year helping us put this together so thank you to the to the ams team and then i think with that we thought it was fitting to end on penguins uh and to thank you all all of our participants for making this such a wonderful learning experience and community for for us so thank you
Up Next
Topological Data Analysis for Big Data Applications
@analyticsweek
6.2K views•2014-04-15

Elliptic Curve Cryptography Explained: ECC, ECDSA, ECDH
@PracticalNetworking
28.5K views•2024-10-21

Fourier Series Introduction: The Big Idea Explained
@DrTrefor
387K views•2021-05-03

The Mathematical Impossibility of Accurate World Maps
@Vox
23.3M views•2016-12-02
Related Study Plans & Knowledge Roadmaps
Structured learning paths in Mathematics