


















![[Recording] Webinar: qPCR 101](https://i.ytimg.com/vi/2aUt9AEArzQ/maxresdefault.jpg)


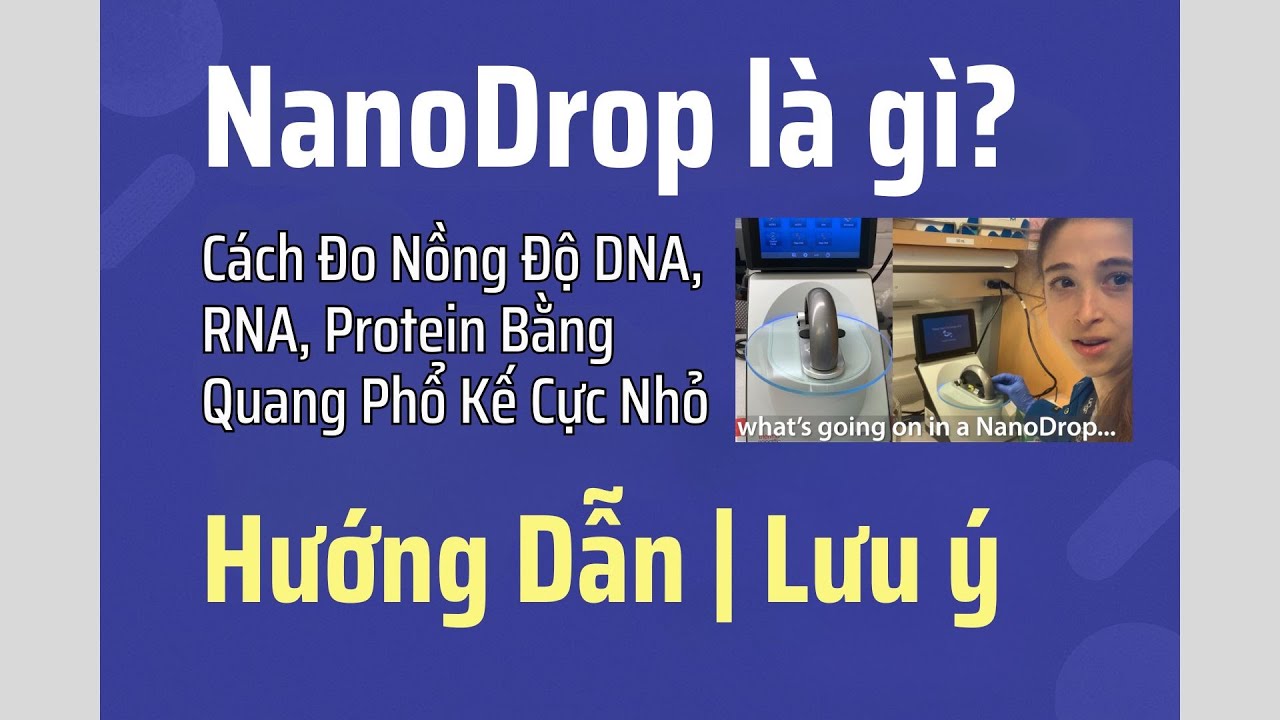
This video tutorial demonstrates how to use a Nanodrop spectrophotometer (Thermo Scientific NanoDrop 2000 series) to measure DNA/RNA concentration and assess sample quality. The procedure involves: (1) preparing a blank measurement using TE buffer, (2) placing 1.5 microliters of sample on the lens, (3) measuring absorbance at 260nm for concentration and calculating purity ratios (260/280 and 260/230), where values around 1.8 indicate pure DNA and around 2.0 indicate pure RNA, with expected 260/230 ratios between 2.0-2.5 for both nucleic acids; deviations from these values suggest contamination by proteins, salts, or organic solvents.
Nanodrop 2000 Tutorial: Measuring DNA/RNA Concentration & Purity
Added:Understanding the chemical structure of DNA and RNA, specifically how their conjugated double bonds absorb ultraviolet (UV) light.
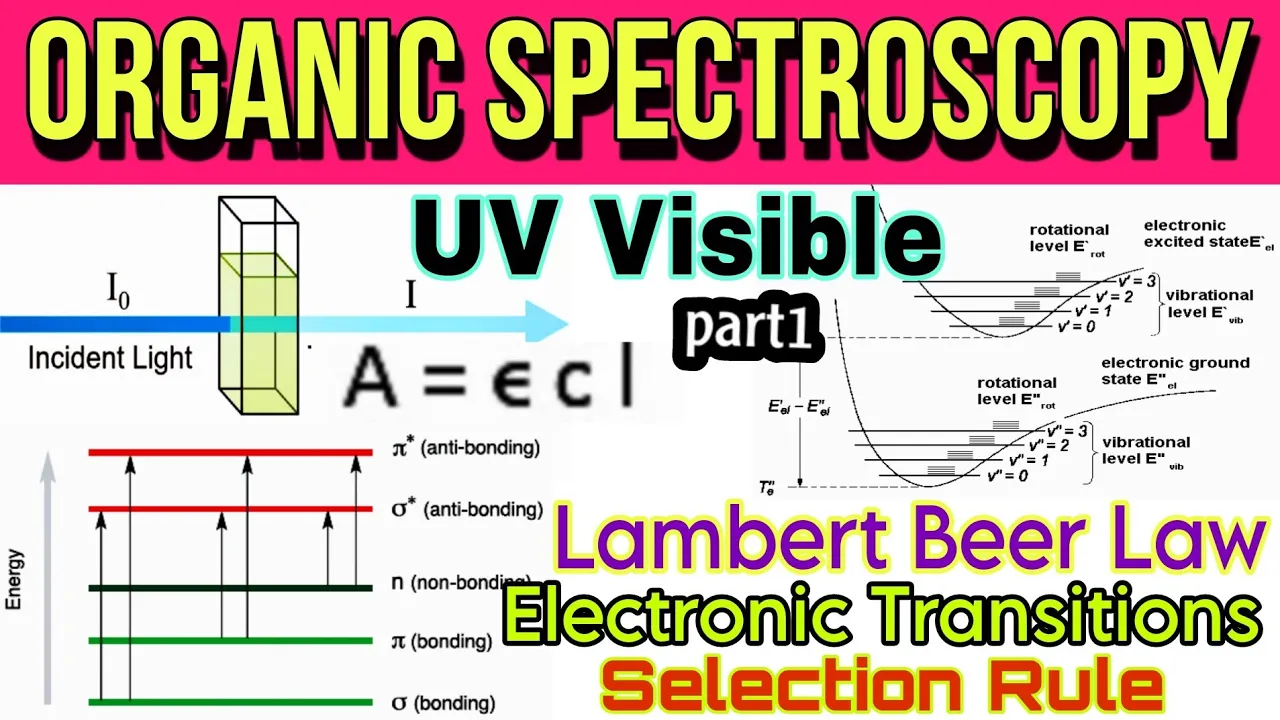
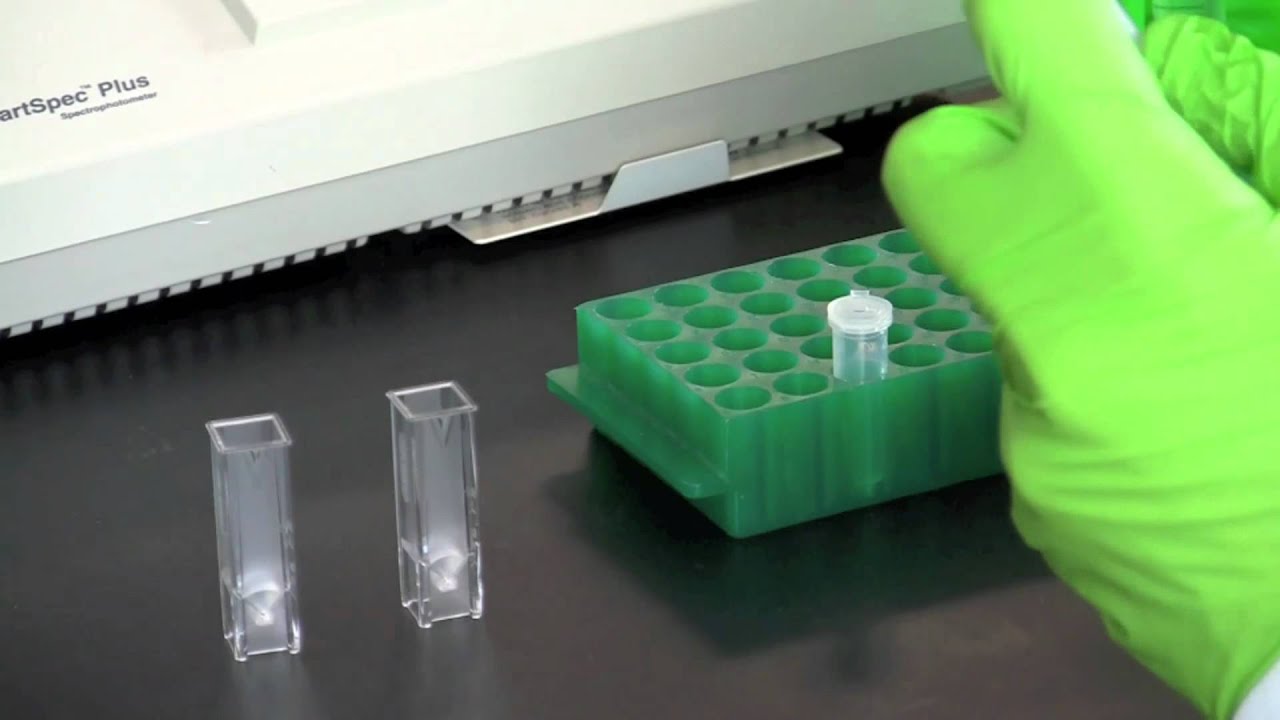
The fundamental principles of UV-Vis spectrophotometry, including the Beer-Lambert Law which relates light absorbance to solute concentration.
Familiarity with micro-volume pipetting techniques, as the NanoDrop requires precise handling of 1-2 microliter samples.
Knowledge of common reagents used in nucleic acid extraction (such as phenol, chloroform, guanidine salts, and ethanol) and their potential to contaminate samples.
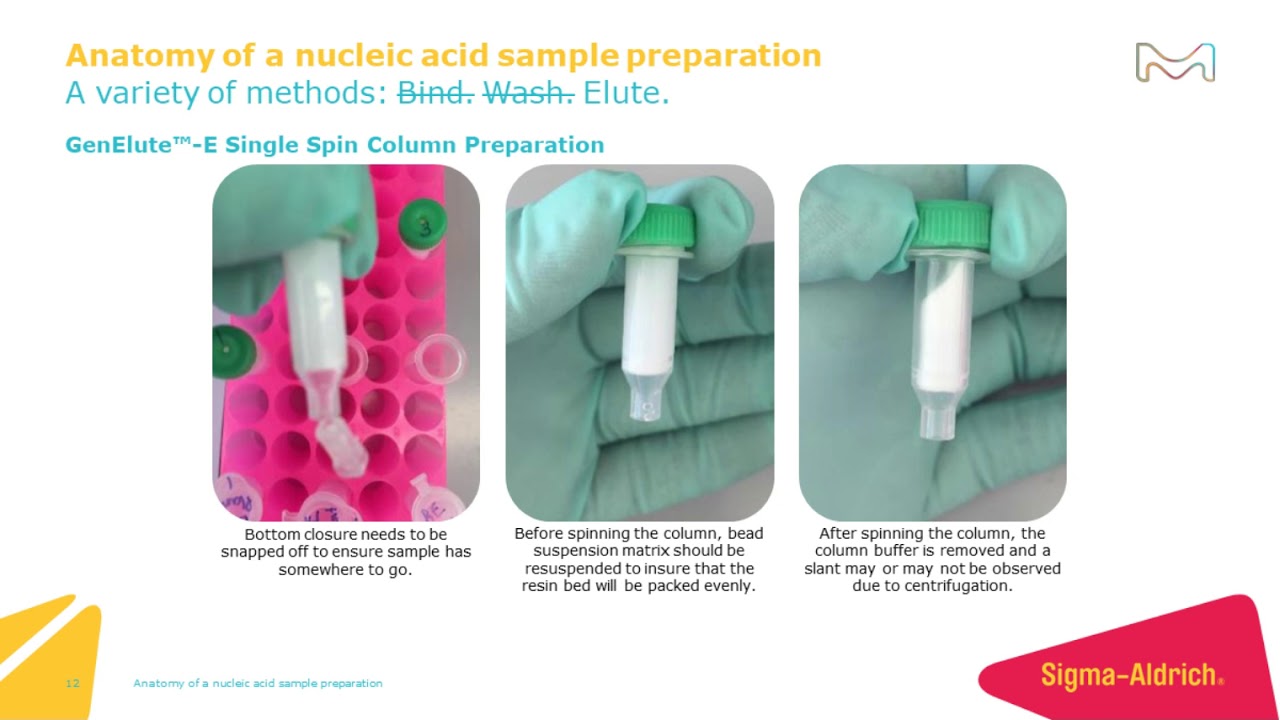
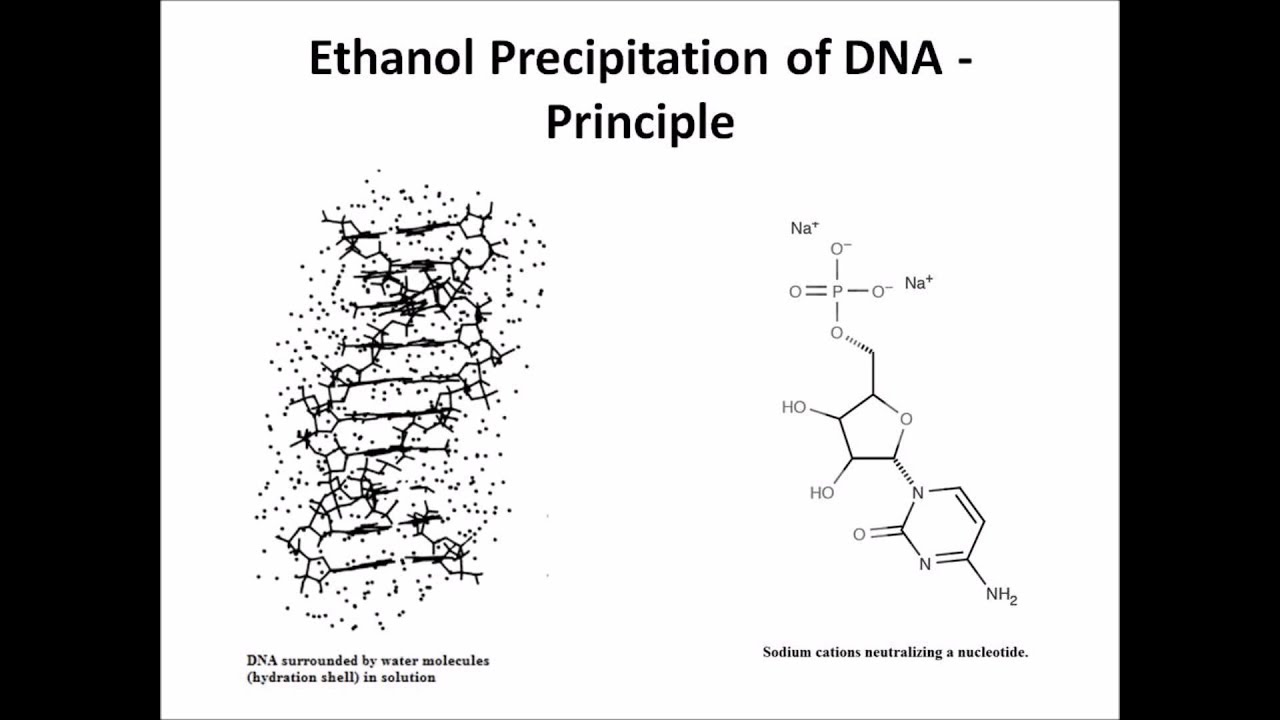
Troubleshooting methods and sample cleanup protocols (e.g., ethanol precipitation) to salvage nucleic acid samples with poor purity ratios.
How to calculate and normalize nucleic acid concentrations for downstream enzymatic reactions like PCR, qPCR, and restriction enzyme digests.
Comparing spectrophotometric quantification (NanoDrop) with fluorometric quantification (e.g., Qubit) to understand when to use dye-selective methods.
Methods for assessing RNA integrity, such as agarose gel electrophoresis or automated capillary electrophoresis (e.g., Bioanalyzer RIN values), which go beyond simple purity measurements.
32.1K views521likes8:11Original Release: 2020-11-13
hey today i'm going to show you how to use a nano drop to measure the dna concentration and quality so this particular nano drop which i'm going to use is from thermoscientific and it's a nanodrop 2000 series so what we need is a micropipette which is a p2 which can measure up to 2 microliter and the next thing we need is the landscaping tissues which we also use for the microscope and some gloves your samples and for the waste and some tips for the micro paper okay so you have to start your computer another computer is started you click on the nano drop icon and it takes a while depending on your computer speed to load the program so once the program is loaded look for the nucleic acid which will be on the top left so click on it so he's asking me for me for the previous worksheet but i'm not using that one so i'll say no so the first thing is the routine verification so this is kind of an internal check for the instrument and for that we have to make sure there's nothing on the lens and the lens is completely uh cleaned and wiped so for that we'll be using the t-shirt and wipe the lens gently there both the ends and put the arm down and then click ok and that starts the verification process it just takes a couple of seconds okay now we are ready to start the sample measurement okay so we take the blank so uh because i have prepared myself as a t buffer so i'll be using it as a blank and i will be taking a 1.5 microliter and i put it right on the middle of the lens and i put the arm back down okay and then i click on the blank and that will take the blank reading that will just take a couple of seconds okay so once the blank is done we are ready to make our first sample so first i will wipe the previous sample and make sure the lens is dry and then i will take my first sample and again i will take the 1.5 microliter and just like the blank i will put on the middle of the lens and put the arm back down okay so now what i have to do is enter the sample id because that's my sample so whatever is the sample id is just to enter that for example in this case it's last sample number 61 and then simply click on the my button and that will start the measurement process and it takes uh only a few seconds okay so because the very first sample this is asking where should i save my worksheet so give it a location and then click ok and then you get your results so here you can see your or every all the information that you need 260 and 268 ratio and 260 30 ratio and along with the dna concentration okay so now we go to the next samples and we obviously have to wipe the previous sample and i'll take my next sample and in the same way i put it on the lens and measure the next sample and similarly uh i keep going on and once i finish use the water to clean the lens and then simply wipe the water double make sure the lens is clean for the next years okay and this is that's all done okay and then the last thing is a getting our results so click on the reports and then export that will export all your results in excel form so give it the file name and the location and then save it i have analyze your samples on the nano drop the next important thing is interpreting these results so i will quickly show you how we can interpret these results so this is a typical window of the results and two important thing here are the concentration of the dna or rna which is in nanogram per microliter and the second important thing which shows the purity of the nucleic acid is the ratios so the one is 260 over 280 and the second one is 260 over 230 and the following slide i will show you what does this mean and what are the expected values okay so this is the typical uh absorption curve for the dnu rna so this is between the wavelength and the absorbance so the three important wavelengths here are 260 230 and 280 so what exact actually happened that 260 dna and rna absorb maximum at 230 the salts absorb and at 280 the proteins absorb so if we know the ratios between 260 to 80 and 260 and 230 we can have an idea of how good or how pure our dna possibly could be so the first ratio is 260 over 280 which is usually used to access a purity of the dna rna so a value of approximately 1.8 is usually considered as pure for dna and a value of 2 is considered pure for dna for rna and if you look at the 260 to 30 ratio so this is usually used as a secondary measure of nucleic acid purity and the expected value is between two and 2.5 for both rna and dna so if you have values above or below these um reference values so you can expect the sample is not pure so the ual contaminants can have the effect in different ways so in the first diagram you can see the effect of the trisol which changes the curve uh in this way and then we have the phenol which will change the curve uh in this way and this kind of curve is usually seen with the quantity in hydrochloride contamination and with the governing isocyanide we see this kind of curve so i hope this gives some idea about the nanodrop if you have any questions so please drop me a message in the comments and please don't forget to like here and subscribe thank you very much bye
Up Next
5:13
Illumina Sequencing by Synthesis Workflow Overview
@IlluminaInc
2.6M views•2016-10-05

12:54
Triumph of Orthodoxy Icon: Byzantine Art & History Explained
@BenCallan
2.1K views•2024-08-06

9:49
FastAPI vs Flask vs Django: Choosing the Right Python Web Framework
@TechWithTim
302.5K views•2024-05-26

1:42
Game of Thrones Opening Credits: A Cinematic Analysis
@gameofthrones
46.3M views•2011-04-18
Related Study Plans & Knowledge Roadmaps
Structured learning paths in General & Interdisciplinary Studies
general-studies
Elevator Engineering: History, Physics & Cities
01From Hoists to Safety Brakes: The Dawn of Vertical Lift
02Hydraulic vs. Traction: The Engineering Physics of Elevators
03Modern Speed, Safety, and Algorithms
+ 2 more learning modules
12h5 modules
Explore Roadmap
general-studies
Rubber: Material Science, History & Geopolitics
01Origins of Natural Rubber & Mesoamerican History
02The Chemistry of Natural Rubber & Vulcanization
03The Geopolitics of the Rubber Boom & Colonization
+ 2 more learning modules
12h5 modules
Explore Roadmap
general-studies
Containerization: Evolution, Logistics & Trade
01Ancient Trade & Bulk Cargo: Amphorae to Barrels
02The Industrial Revolution & Cardboard Packaging
03The Containerization Revolution: Malcom McLean
+ 2 more learning modules
12h5 modules
Explore Roadmap
general-studies
Textile Tech: Evolution, Labor & Global Impact
01Pre-Industrial Textiles: Handloom & Cottage Industry
02Mechanization: The Spinning Jenny to the Power Loom
03The Factory System & Global Labor Transformation
+ 2 more learning modules
10h5 modules
Explore Roadmap