





















Partial derivatives represent the slope of tangent lines to the trace of a surface when one variable is held constant; for the function f(x,y) = x²y at the point (2,3,12), the partial derivative with respect to x is 12 (slope of tangent line in the plane y=3) and with respect to y is 4 (slope of tangent line in the plane x=2).
Visualizing Partial Derivatives: f(x,y)=x^2*y at (2,3)
Added:Single-variable calculus, specifically the geometric definition of a derivative as the slope of a tangent line.
The concept of functions of two variables f(x,y) and how they represent 3D surfaces in Cartesian space.
Familiarity with 3D coordinate planes and the concept of a 'trace' or cross-section (e.g., setting x or y to a constant value).
Basic differentiation rules, such as the power rule and constant multiple rule, applied to single-variable functions.
Finding the equation of a tangent plane to a surface z=f(x,y) at a specific point.
Using partial derivatives for linear approximation and analyzing differentials in multivariable systems.
The gradient vector and directional derivatives, which describe the rate of change in any arbitrary direction beyond the coordinate axes.
Optimization of multivariable functions, including finding critical points and applying the Second Derivative Test to identify local extrema.
468 views8likes6:54Original Release: 2022-09-07
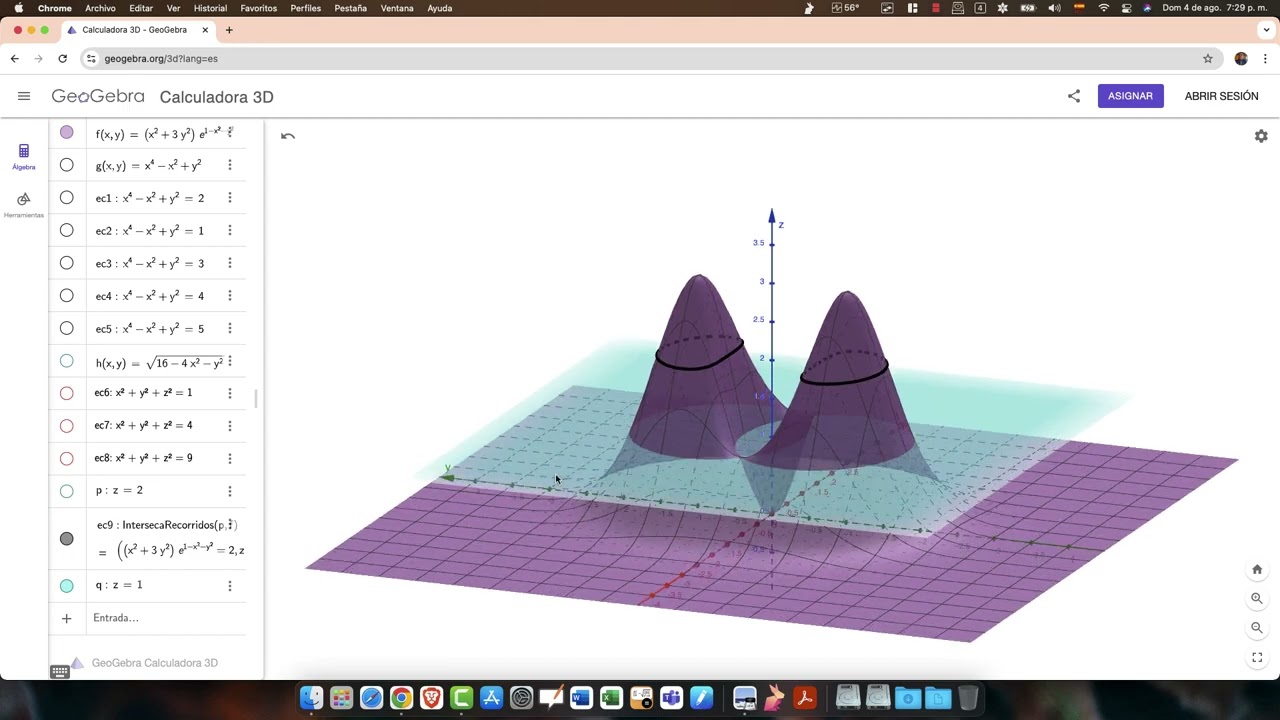
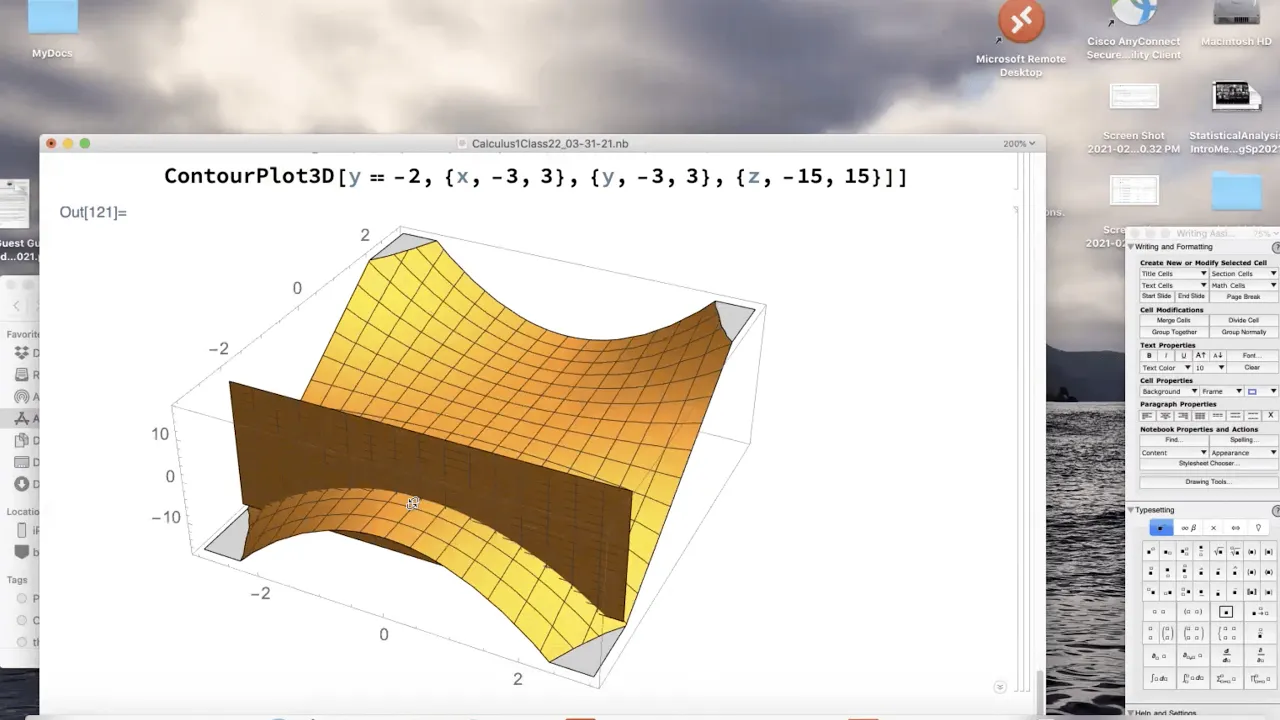
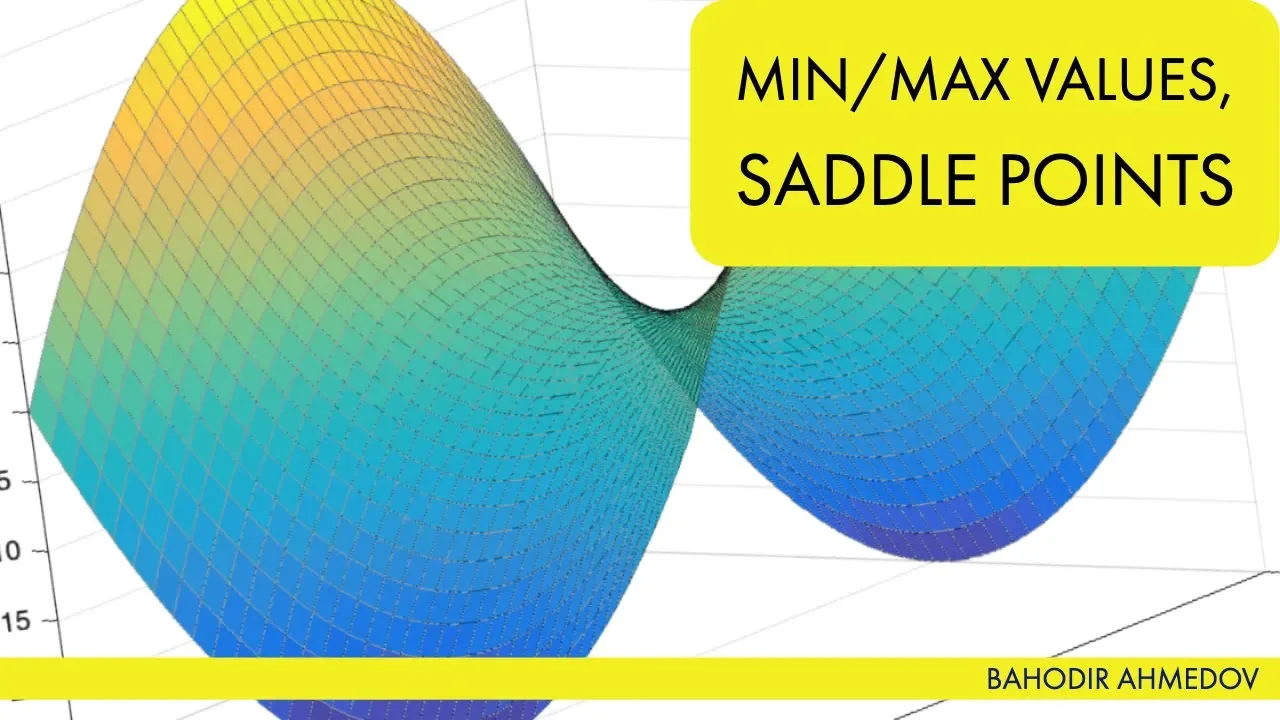
so i've gone ahead and plugged all the information i need into calc plot 3d the first thing i want to show you is here is the domain for this function this is the function f of x equals x squared times y and the domain is all real numbers and specifically i take the ordered pair in the domain two comma three when i plug two comma three into our function we found that it gave us the y value of twelve let's pl earth the z value of twelve so let's go ahead and plot that point and that's up there and there it's is its label so this was the order triplet 2 comma 3 comma 12. so as a reminder we took the input value 2 comma 3 we plugged it into the function z equals x squared y and that gave us the corresponding z coordinate and now we can plot the ordered triplet if we did that for all points in the domain for the whole x y plane then we'd be able to obtain the graph of this surface which i'm showing you here so we can take a look at this this is a interesting looking surface we don't really have a great classification for it you can see that's got some saddle point i'm going to go ahead and remove this domain plane now and we should be able to see for instance at uh the origin we've got a saddle point which is something we've learned about and so now we want to talk about the partial derivatives of this function at this point right here so there's that point p 2 comma 3 comma 12. it's a little hard to read with all of the grid lines going on there but there's that point so remember that when we ask the question what is the partial derivative we need to assign a direction that is if you were a person standing on this say mountain and you were standing at this point right here if i ask the question as you move are you going uphill or downhill certainly that matters what direction you move in so we went ahead and computed the partial derivative let's first look at the partial derivative for this function at this point with respect to x so remember that when we compute the partial derivative with respect to x what we do is we fix our y coordinate at 3. to help us see that i've gone ahead and plotted a plane here let's put that in so i hear i've added in the plane y equals 3.
so careful there's the x come on hold still there buddy there's the x y coordinates this is the plane y equals three you can see that it passes through my point right there so the next thing we'll do is let's look at the curve the trace of the surface the entire surface here with the plane y equals 3. so if we look at that trace here's what we end up with so there i've sketched the trace in the plane y equals 3. so here i think it's clear that if i were to step in the positive x direction which is down here if i step in the positive x direction what's going to happen to the z coordinates as i move along the trace curve right here and we would expect the z coordinates to be increasing sure enough i can go ahead and plot a tangent line there and i didn't extend it all the way through and you can see that line and what is the slope of that tangent line so that's precisely what we computed in the previous example the slope of that tangent line right there that blue tangent line is 12. that's what we found when we said the partial derivative of this function with respect to x at the point 2 comma 3 was 12.
to help us see that a little bit better though let's actually remove the surface from the picture because remember all we're considering is the part of the surface that intersects the plane y equals three and so that red trace is the surface in that plane where we're fixing our y coordinate there's our point that's on our surface and here we can again see that as we step in the x direction the positive x direction the z coordinates are increasing at that point at a rate of 12. careful that has nothing to do with the z coordinate here being 12 and everything to do with the slope of the line that we computed from that limit definition okay let's return to our surface so there was that surface again and let's go ahead now and take off all of the partial derivative with respect to x information so we'll remove that plane that we were looking at just now and we'll remove the trace and then we'll remove lastly the tangent line that we drew there in the positive x direction that has a slope of 12. we'll remove that and now let's go ahead and consider the partial derivative with respect to y so what do we do when we compute the partial derivative with respect to y we fix the x coordinate so the x coordinate here is currently 2 hopefully you can read that the x coordinate is currently 2 so i'm going to fix that x coordinate which means i'm going to be looking at the intersection of this surface with the plane x equals 2. so there i've sketched the plane x equals 2 and it's intersecting the surface there well just like we did before what we'd like to do is we'd like to look at the trace here we're getting a little bit of rounding distortion here so it's not quite as crisp as of an image as i'd like but if we go ahead and we plot the tangent line to the curve there or sorry if we plot the trace there's the trace and if i go ahead and draw a tangent line to that trace at our point there's the tangent line shown in purple and what is the slope of that tangent line that we just sketched well as we saw from the limit definition when we computed the partial derivative of f with respect to y remember that means we fixed x to be 2 there we fixed x to be 2 but we allowed y to vary and we looked at the difference as that variance went to 0 we ended up with a slope of 4. that is the slope of this purple tangent line right here let's go ahead and one more time remember that what we're doing here is we're kind of we're taking just the trace of our surface in the plane x equals two so if we remove the surface for just a moment and make it easier to see there's the trace of the surface shown in green in this case the trace is a line it doesn't have to be a line it was a parabola in the last example and it could be any other curvature shape for a trace and we went ahead and computed the slope of the tangent line on that trace and we found the slope of that tangent line to be 4 meaning the partial derivative of f with respect to the variable y because we're fixing x is the value 4 there so folks i hope this is a good visualization of what we just did please let me know if you have any questions
Up Next

4:51
Jacobian Matrix Explained: Multivariable Calculus & Change
@TheCodeBit
1.1K views•2025-10-20

4:43
Elliptic Curve Cryptography Explained: ECC, ECDSA, ECDH
@PracticalNetworking
28.5K views•2024-10-21

10:44
Fourier Series Introduction: The Big Idea Explained
@DrTrefor
387K views•2021-05-03

6:00
The Mathematical Impossibility of Accurate World Maps
@Vox
23.3M views•2016-12-02
Related Study Plans & Knowledge Roadmaps
Structured learning paths in Mathematics
mathematics
Tensor Calculus: Vectors to Riemann Curvature
01Mathematical Foundations: Linear Algebra & Calculus
02Covectors, Dual Spaces, and Tensor Basics
03The Metric Tensor and Index Gymnastics
+ 2 more learning modules
40h5 modules
Explore Roadmap
mathematics
Gödel's Incompleteness: Logic, Proofs & Limits
01Introduction to Formal Systems & Hilbert's Dream
02Set Theory, Cardinality, and Cantor's Diagonal Argument
03Arithmetization and Gödel Numbering
+ 2 more learning modules
14h5 modules
Explore Roadmap
mathematics
Galois Theory: Fields, Groups & Solvability
01Foundations of Abstract Algebra: Groups & Fields
02Polynomials & Field Extensions
03Splitting Fields & Symmetries
+ 2 more learning modules
24h5 modules
Explore Roadmap
mathematics
Non-Euclidean Geometry: Models & Geodesics
01Euclid's Fifth Postulate and the Birth of New Geometries
02Hyperbolic Space and the Poincaré Disk Model
03Geodesics: Defining Straight Lines in Curved Spaces
+ 2 more learning modules
15h5 modules
Explore Roadmap