












![[Webinar] Simple Good Practices for Quality Data - Precautions, Tips and Tricks for FTIR](https://i.ytimg.com/vi/O8vhUueRFDk/maxresdefault.jpg)
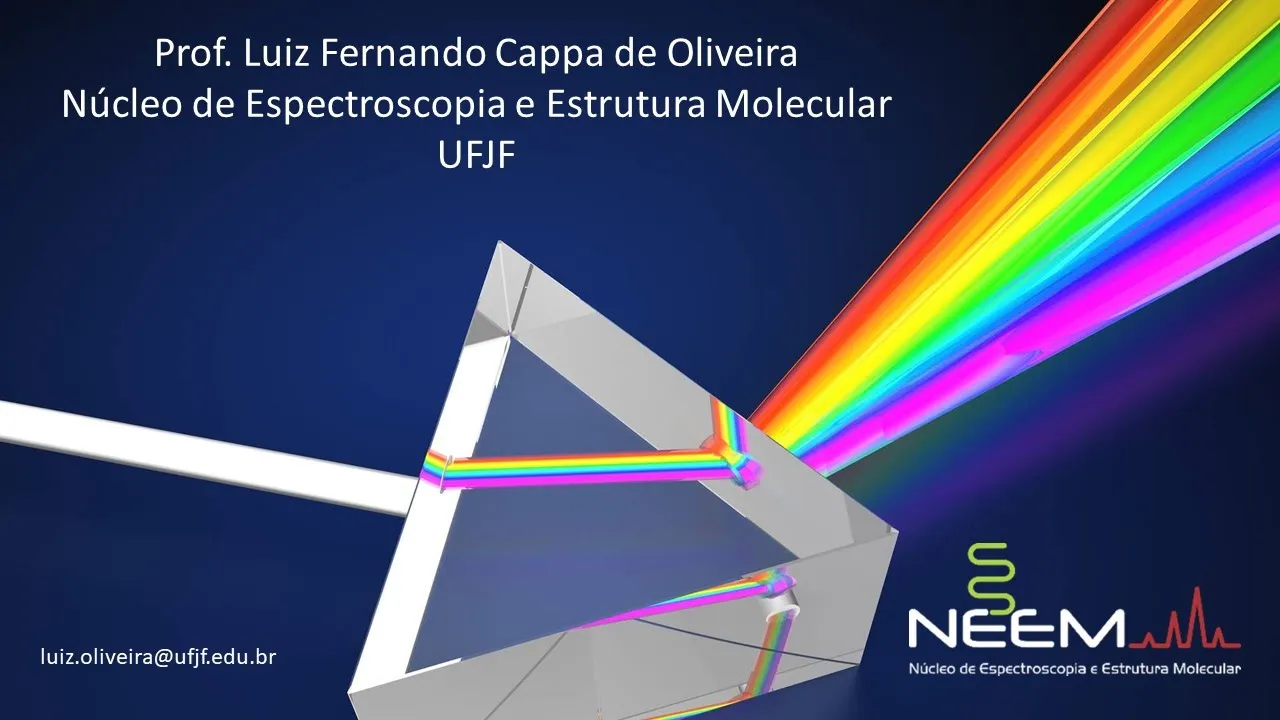
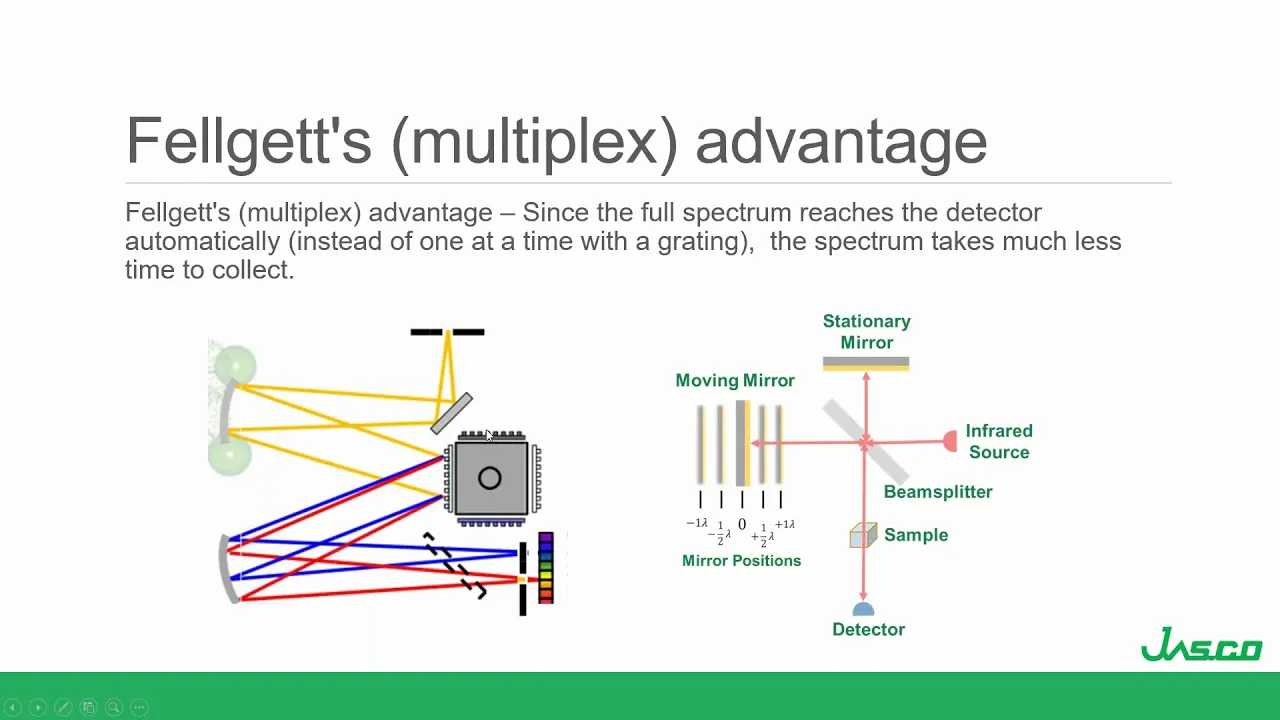
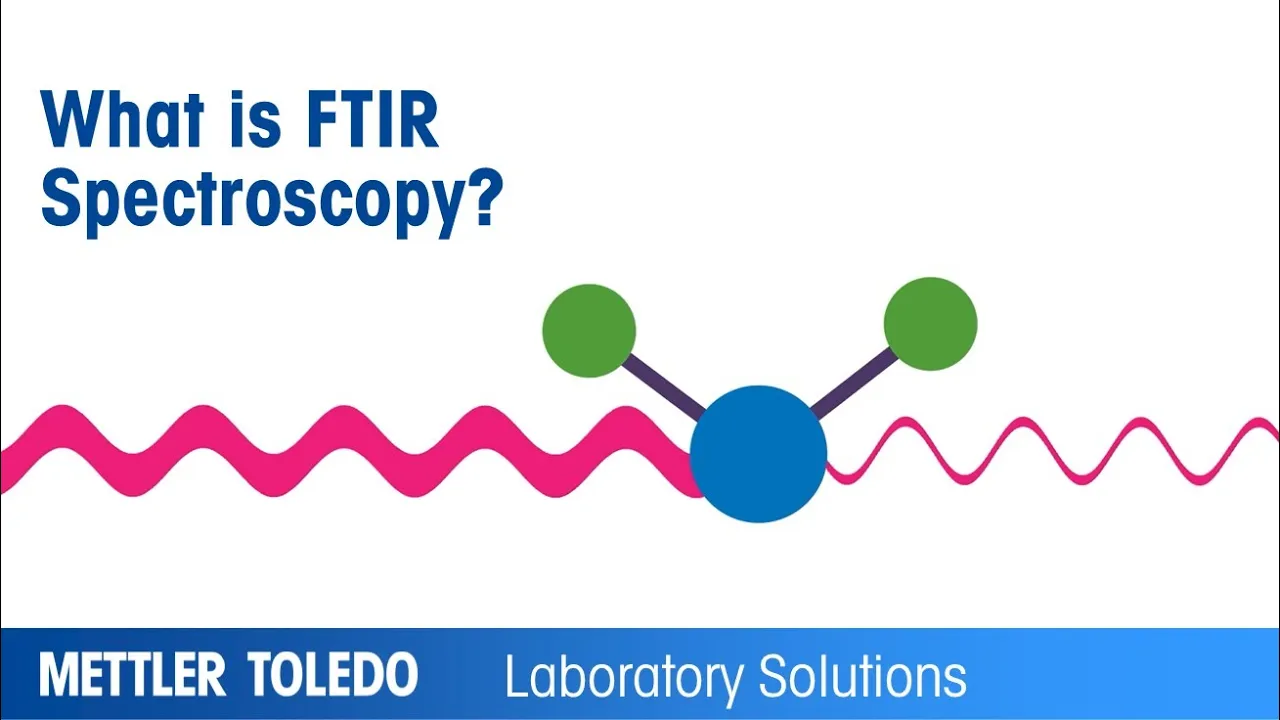



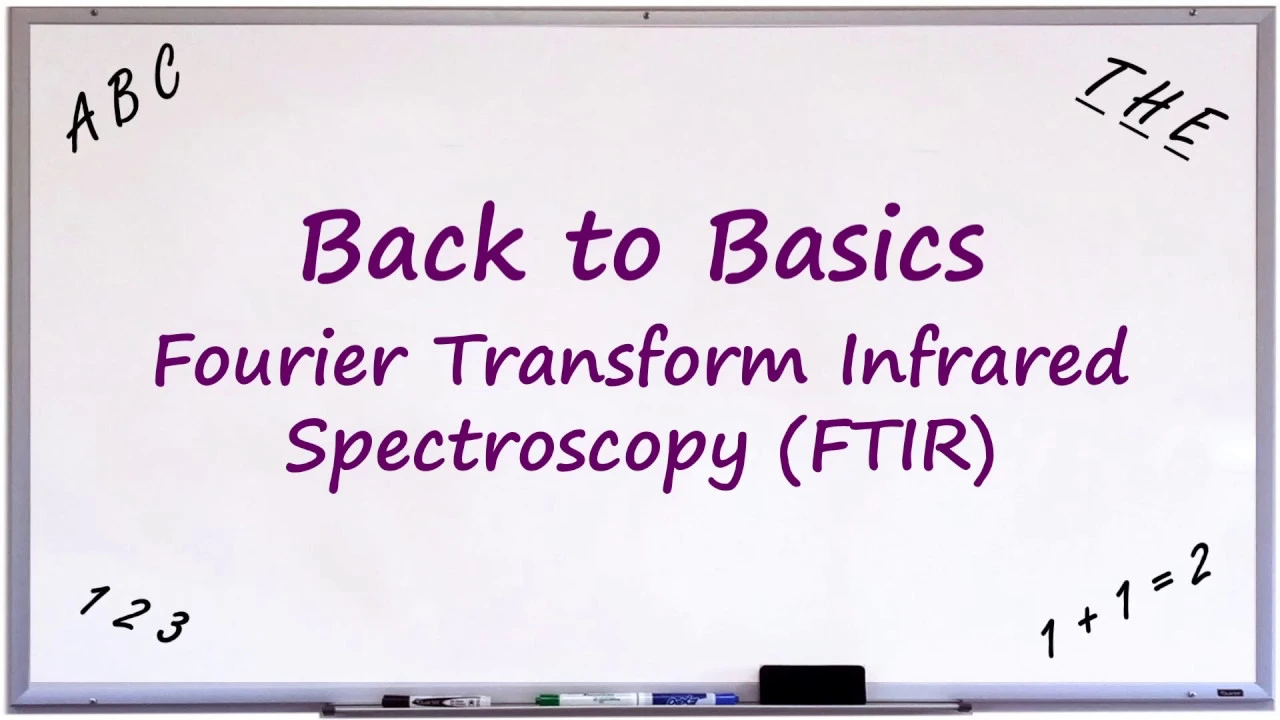

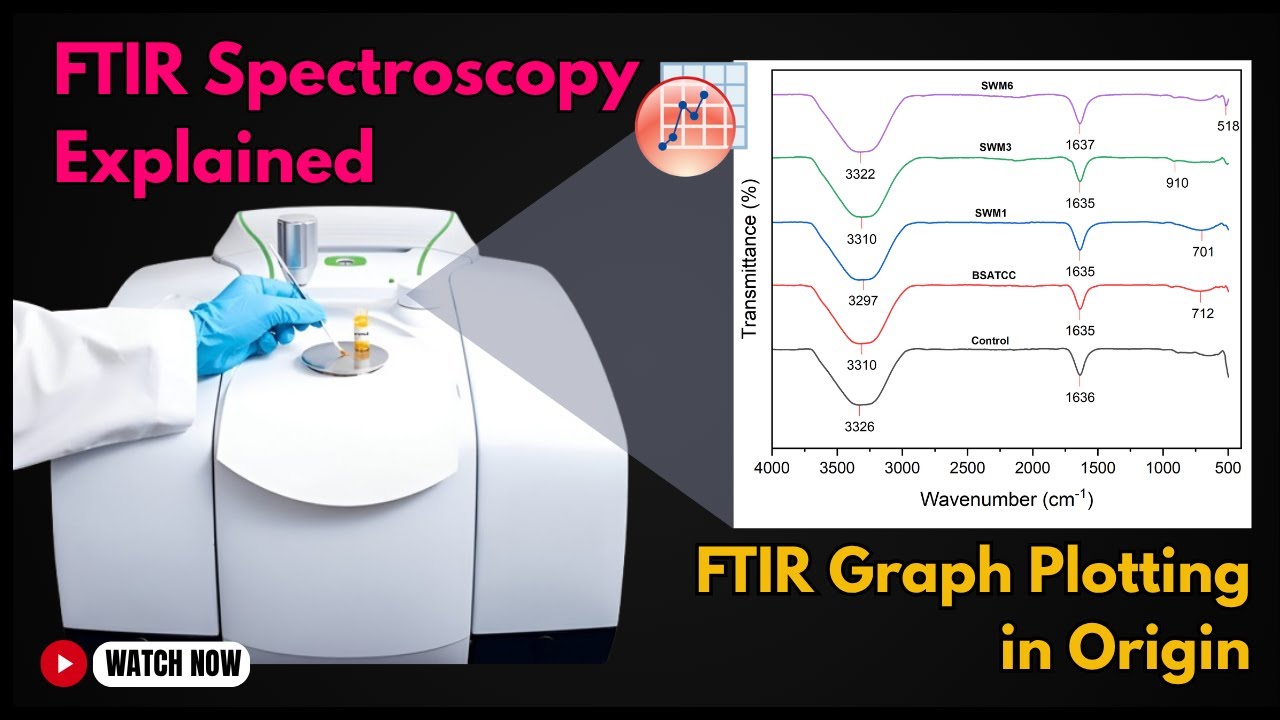
FTIR (Fourier Transform Infrared) spectroscopy is a molecular analytical technique that identifies organic, polymeric, and some inorganic materials by measuring how samples absorb infrared light, revealing unique chemical bond patterns; the analysis involves preparing samples through methods like potassium bromide pellet pressing, thin film insertion, liquid cell placement on sodium chloride plates, or attenuated total reflectance (ATR), then comparing the resulting absorbance/transmittance spectra against reference libraries to identify the material composition.
FTIR Analysis | Fourier Transform Infrared Spectroscopy
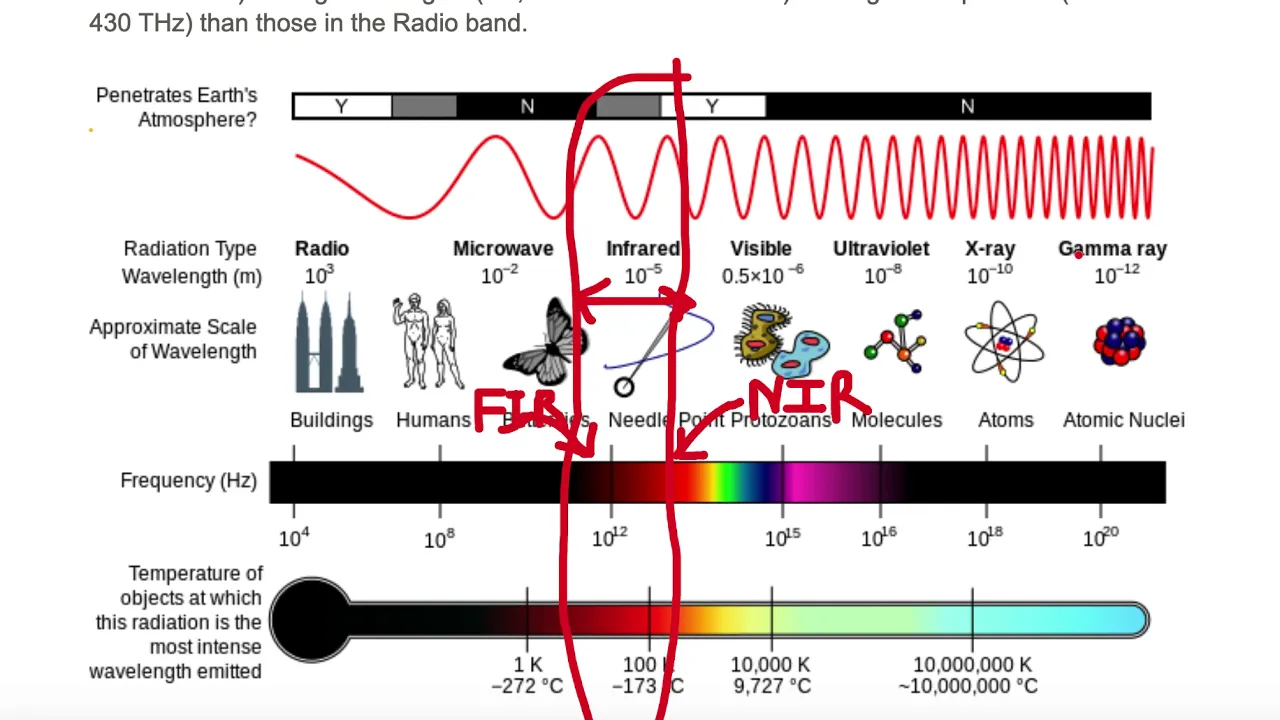
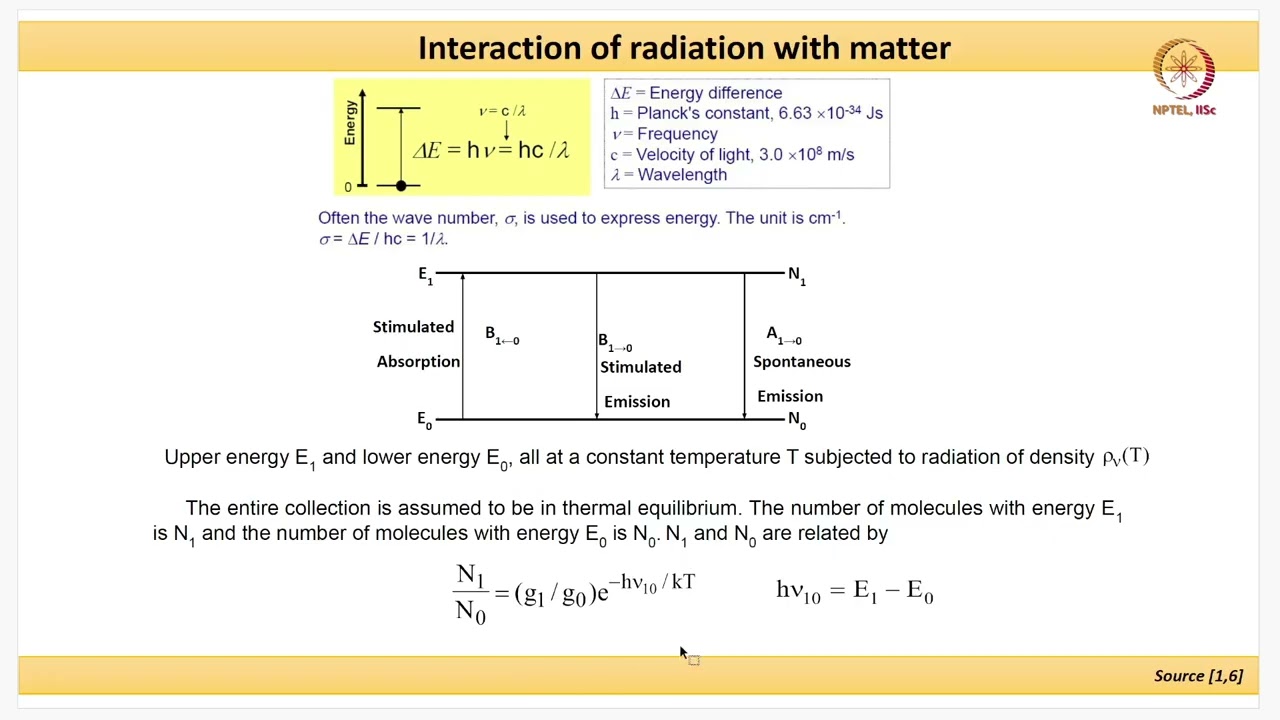
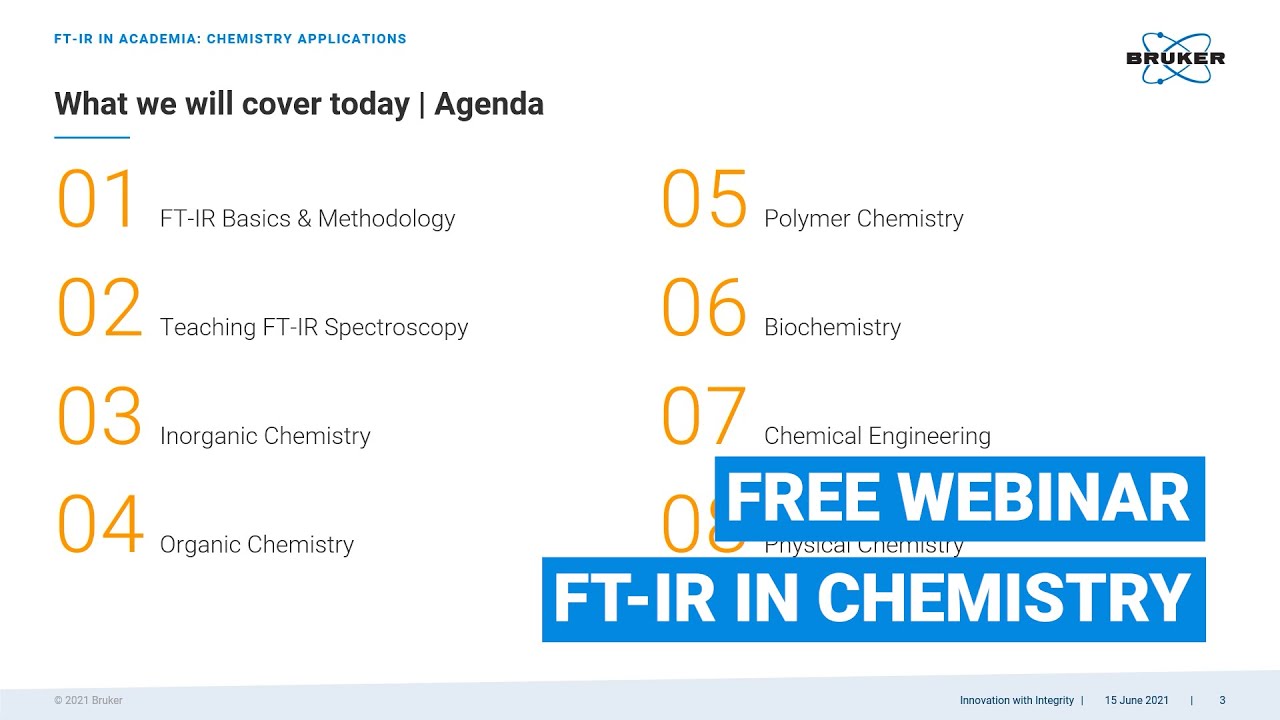
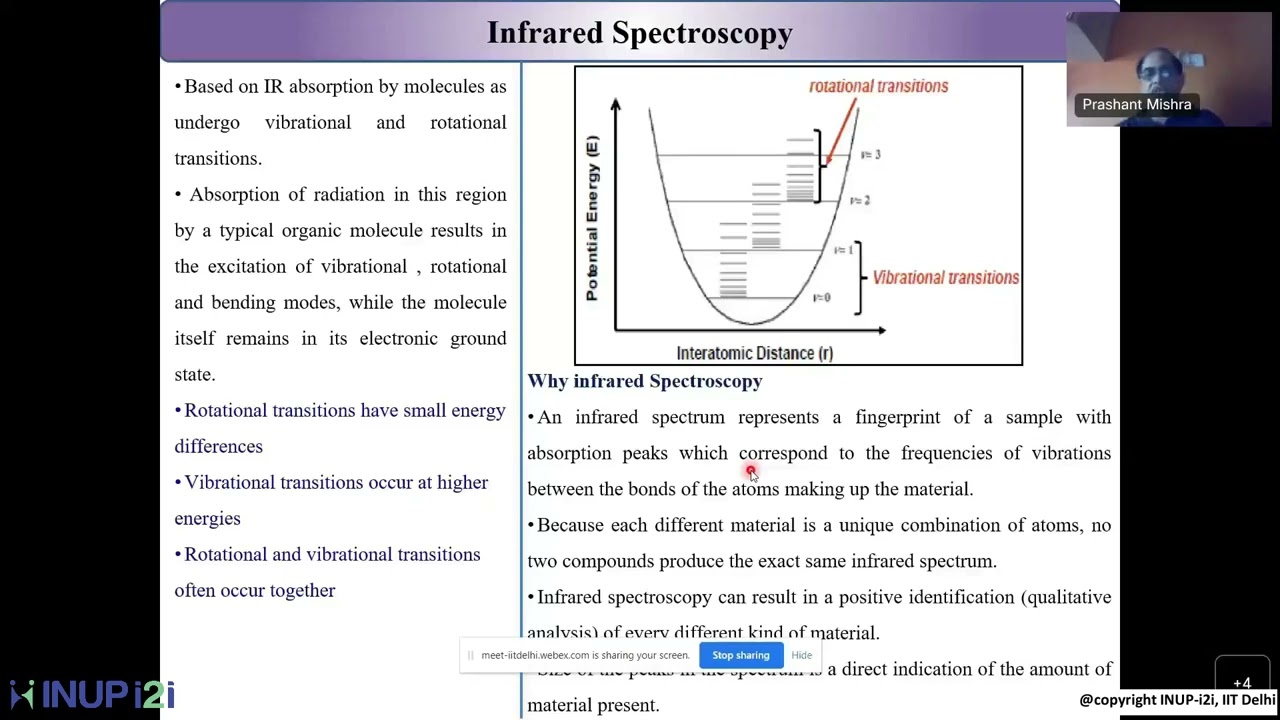
Added:Understanding the electromagnetic spectrum, specifically the properties of infrared radiation (wavelength, frequency, and energy).
Basic knowledge of chemical bonding and molecular vibrations, including stretching and bending modes.
Familiarity with the concept of molecular dipole moments and how they interact with electromagnetic radiation.
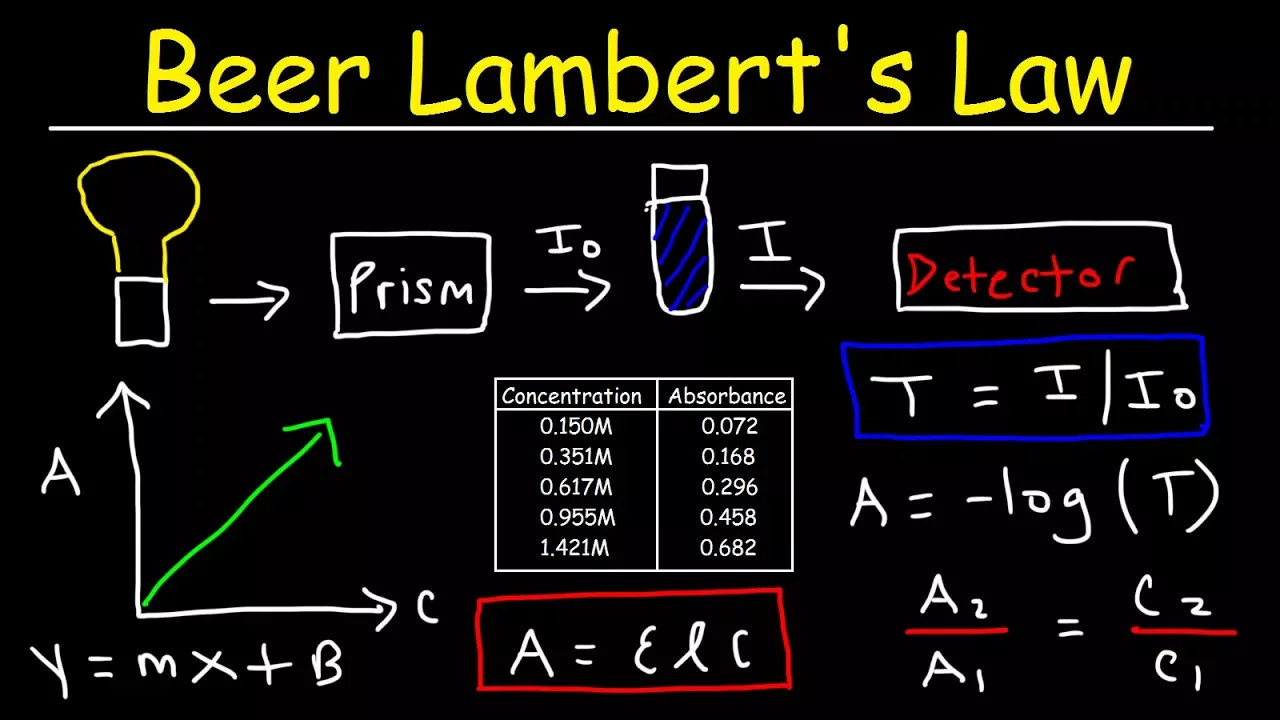
An introductory understanding of spectroscopy concepts, such as transmittance, absorbance, and Beer's Law.
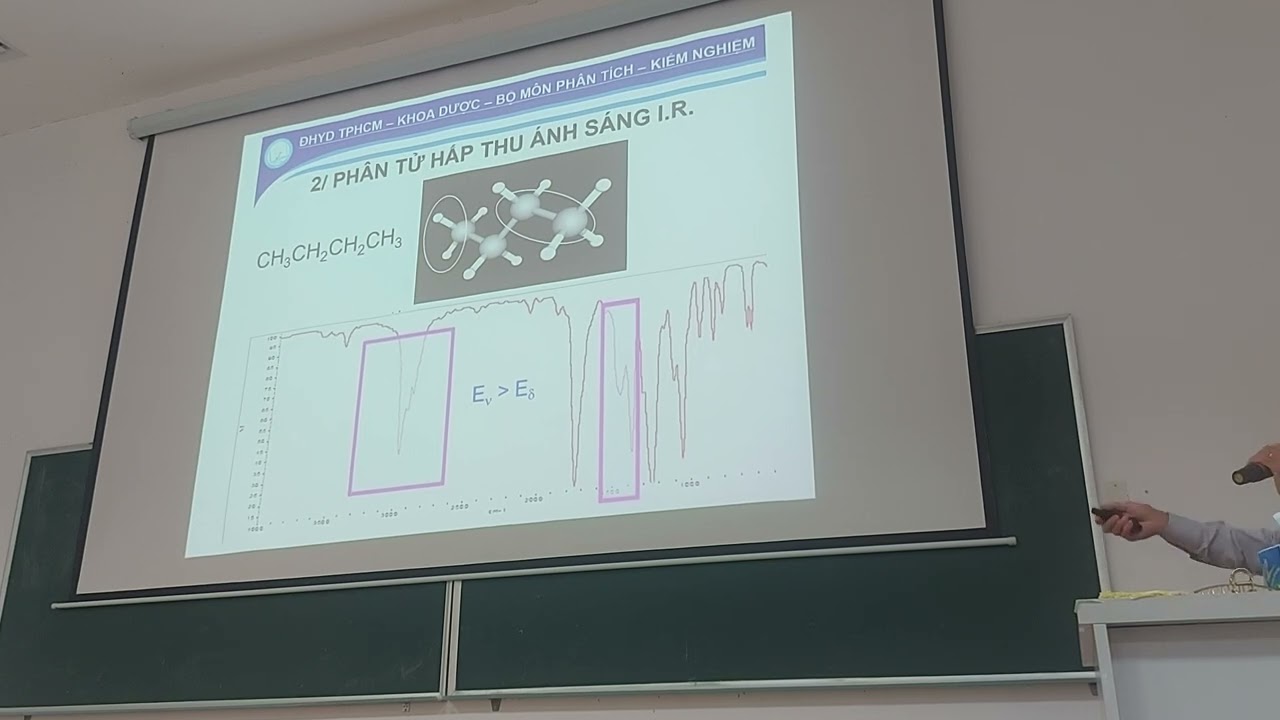
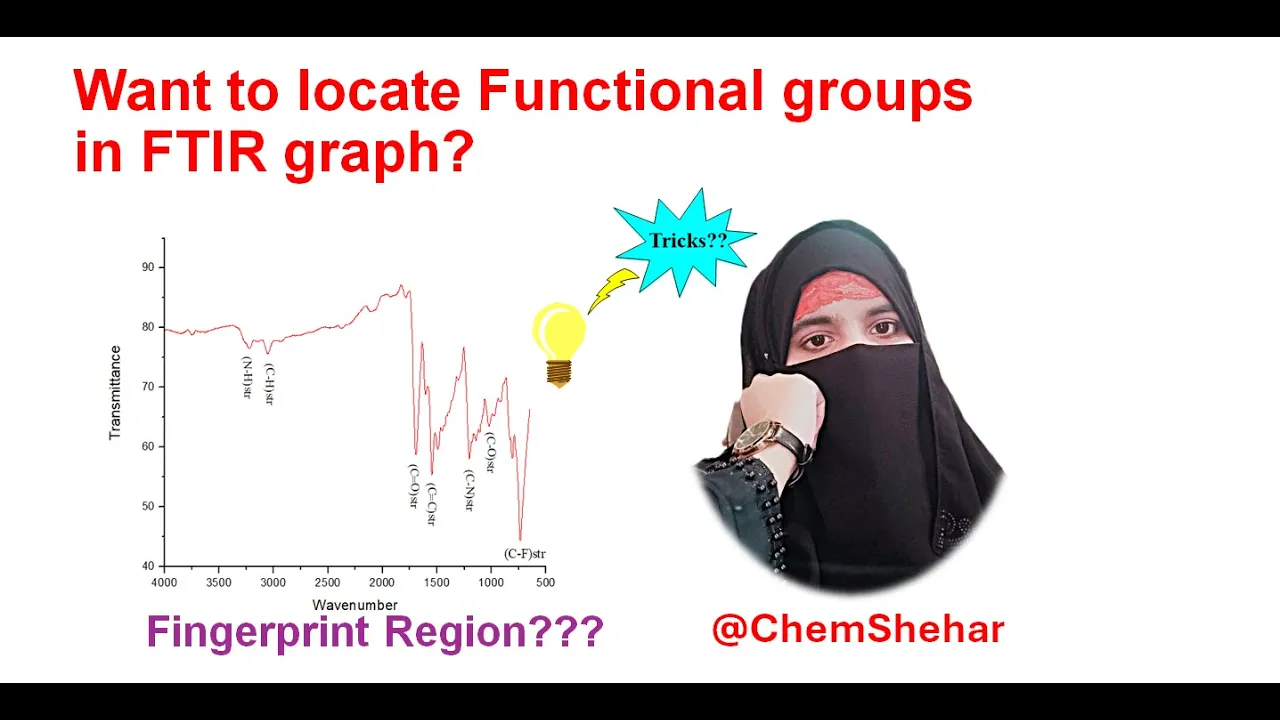
How to interpret an FTIR spectrum to identify organic functional groups and utilize the fingerprint region.
Practical sample preparation methods for FTIR analysis, such as KBr pellets, liquid cells, and Attenuated Total Reflectance (ATR).
Quantitative analysis techniques using FTIR to determine the concentration of specific components in a mixture.
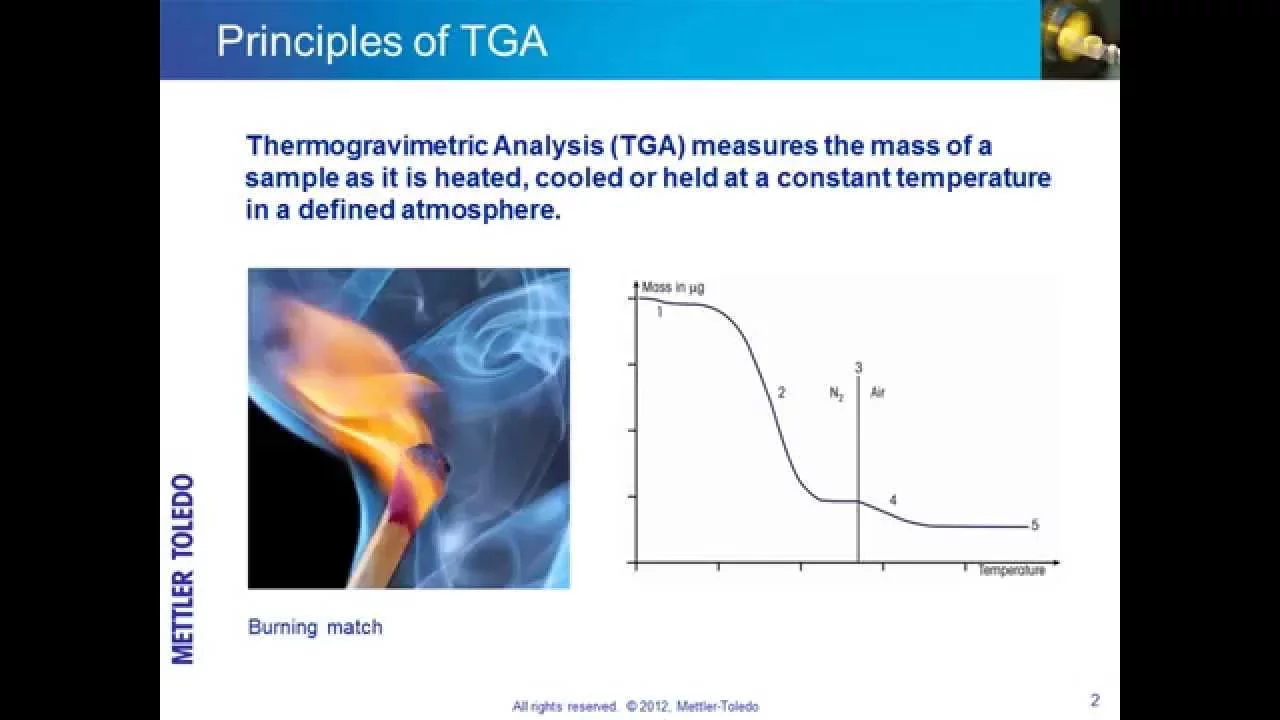
Hyphenated analytical techniques that couple FTIR with other instruments, such as GC-IR (Gas Chromatography-Infrared Spectroscopy) or TGA-IR.
Real-world applications of FTIR in industry, including polymer identification, pharmaceutical quality control, and forensic science.
459.5K views0likes5:46Original Release: 2013-05-10
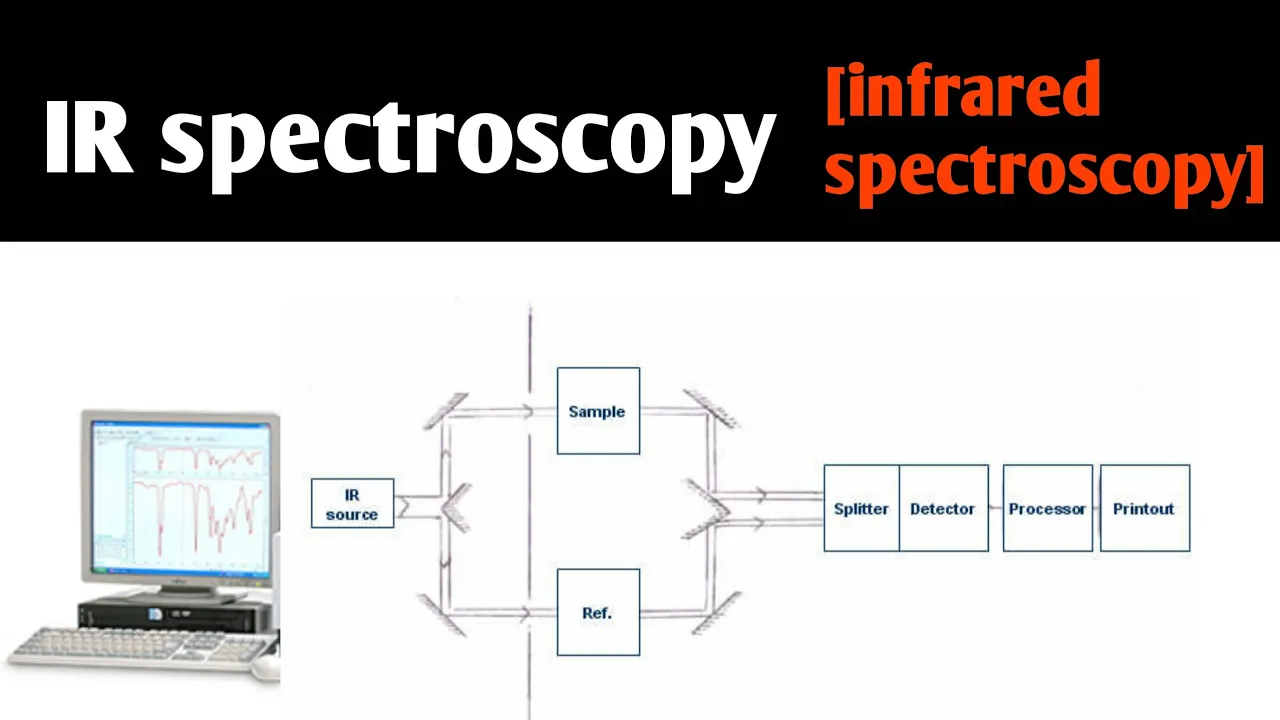
[Music] [Music] [Music] we're going to talk about ftir analysis ftir analysis is forier transform infrared spectroscopy it's a molecular versus is an atomic analysis which means that we're going to look at the molecule and not at the individual atoms it's qualitative versus quantitative however you can do quantitative analysis with it but at Laboratory Testing we simply do qualitative the analysis is performed in absorbance it can be converted to transmittance as well if you look at the screen on the left that's Spectra is in absorbance the screen on the right is in transmittance they're just inversions of each other this is the infrared spectrometer it has a infrared light source that is the Baseline of the energy and what happens is as a sample is put into that light source and then the absorbance of that sample is what is used to measure the bonds of the carbon atoms ftir analysis is Handy to use for several different types of samples we can have powdered samples we can have solid samples we can have thin film samples and we can have liquid samples there are several different ways to get the sample into the ftir One is using a potassium bromide along with a powdered sample screw it together and press it into a pellet and then we put that pellet on the rack that will go into the light path and we Shine the Light directly through there another way is with a thin film if the sample is already thin or it can be pressed into a thin film we put it in this cassette and then we put the cassette in the light path and and we read the analysis from that we can also do nuol which is liquids they're placed on uh sodium chloride plates put two of them together with the uh liquid between it and Shine the Light path through there put it in that holder and we can measure that material in liquid form through the glass plates another sampling method is attenuated total reflectance and that lets us put a solid sample on top of a crystal and then we tighten down the clamp so that the solid sample is held in tight proximity to the Crystal and then the IR light is bounced off of that and we sample the uh material in that method the first thing that we're going to do when we do an analysis is gather a back background Spectra so that that can be subtracted from the Spectra that we get so that all we're seeing is the actual sample that's gathered once the background Spectra is collected then we're ready to do an analysis this is attenuated total reflectance mode uh we have a piece of material material that is supposed to be polyethylene and we're going to place that onto the spectrometer tighten down the clamp and then we'll begin to gather the Spectra for that as you can see the Spectra is being gathered and from that Spectra that we'll then run it through our libraries so that we can determine what the material is the spectrometer runs many scans at one time so that we get a a good sampling of the material once it's done then we will take it and compare it to our libraries so that we can see what the material is the Spectra has been transferred to our library program and now we're going to search through the libraries to see what material the libraries come up with once we've run it through our library the library has determined that the material is polyethylene it comes up with the best match first and then decreasing percentage of matches down below and the best match was polythylene high density [Music]
Up Next

3:15
Melting vs Glass Transition Temperature in Polymers | Key Differences Explained
@Chemistry-For-Everyone
140 views•2025-08-16
83:56
Biocatalysis and Catalysis in Islatravir Synthesis | Merck Webinar
@SCIwheresciencemeetsbusiness
675 views•2020-10-08
10:06
1H NMR: Determining Number of Peaks from Structure
@MSJChem
59.2K views•2017-04-06
17:31
Edible Water Bottles: A DIY Guide to Sodium Alginate Spherification
@ryan
10.5M views•2019-06-21
Related Study Plans & Knowledge Roadmaps
Structured learning paths in Chemistry
chemistry
Nuclear Chemistry: Decay, Meds & Fuel Cycle
01Introduction to Nuclear Structure and Radioactivity
02Decay Dynamics and Kinetics
03Radiation Interaction and Detection
+ 2 more learning modules
24h5 modules
Explore Roadmap
chemistry
Supramolecular Chemistry: Forces & Machines
01Foundations of Chemical Bonding and Intermolecular Forces
02Introduction to Host-Guest Chemistry
03Thermodynamics and Dynamics of Self-Assembly
+ 2 more learning modules
16h5 modules
Explore Roadmap
chemistry
Photochemistry: Excited States & Reactions
01Foundations of Light-Matter Interactions
02Molecular Orbitals and Electronic States
03Photophysical Processes and Jablonski Diagrams
+ 2 more learning modules
18h5 modules
Explore Roadmap
chemistry
Coordination Chemistry: Bonding & Properties
01Introduction to Transition Metals and Ligands
02Crystal Field Theory (CFT) and Geometry
03Magnetic Behavior and Spin States
+ 2 more learning modules
14h5 modules
Explore Roadmap