The urban heat island effect causes cities to be significantly warmer than surrounding rural areas due to heat-absorbing materials like concrete and asphalt storing solar radiation, while vegetation provides cooling through shade and evaporation; this phenomenon makes urban areas up to 10°C hotter than nearby countryside, posing serious health risks especially to vulnerable populations, and requires increased investment in urban greening solutions to mitigate future heat waves.
Understanding the Urban Heat Island Effect in Cities | Sky News
Added:Deep Dive
The concept of Albedo and how different surfaces (such as dark asphalt versus light-colored sand) absorb and reflect solar radiation.

SOS ProEnem 2020 | Clima | Geografia | Leandro Almeida
37.7K
Albedo is the rate of solar radiation reflection. Dark surfaces have low albedo (absorb more radiation, causing more heating), while light surfaces have high albedo (reflect more radiation, causing less heating). This explains why wearing dark clothes feels hotter than light clothes in the sun, and why polar regions are cold partly due to high albedo from ice and snow reflecting solar radiation.
Click to watch →

Разбор 40 вопросов по Географии
134
Albedo is the measure of how much solar radiation a surface reflects. Dark surfaces (like wet sand or dark soil) have low albedo (10-40% reflection) because they absorb more solar energy. Light surfaces (like snow) have high albedo (80-90% reflection) because they reflect most solar energy. This explains why wearing dark clothing in summer makes you feel hotter.
Click to watch →

BPSC TRE 4.0 Geography NCERT ख़ात्मा Series Class 8 by Sachin Academy live 2pm Amit Sir
24.1K
Different surfaces reflect solar radiation differently: (1) Snow and ice-covered areas (albedo effect) reflect the most solar radiation; (2) Desert sand absorbs the most solar radiation. This is why polar regions remain cold despite receiving solar energy.
Click to watch →
![[1ERE GENE] L'effet ALBEDO](https://i.ytimg.com/vi/HfGZfxVj9GM/maxresdefault.jpg)
[1ERE GENE] L'effet ALBEDO
334
Albedo represents the mirror-like property of celestial bodies to reflect incoming solar radiation. The solar power received by a surface is calculated using: Power_received = Total_power × (1 - Albedo). For fresh snow with albedo 0.90, only 10% of solar power is absorbed. For sand with albedo 0.25, 75% is absorbed. To compare solar absorption between surfaces, calculate the ratio of absorbed power. The surface with higher absorbed power (lower albedo) causes more heating and is more likely to cause sunburn. Darker surfaces with lower albedo absorb more solar radiation and heat up more quickly.
Click to watch →
L5: Insolation and Heat Budget | Physical Geography | UPSC CSE 2021 | Anirudh Aggarwal
87.5K
When solar radiation passes through Earth's atmosphere, three main processes occur: reflection, scattering, and absorption. Reflection (albedo) is the process where radiation bounces off a surface and returns to space. Scattering occurs when radiation strikes molecules or particles and is redirected in different directions. Absorption happens when radiation is taken in by a surface and converted to other forms of energy. Albedo is the ratio of radiation reflected from an object to the total amount of radiation falling upon it, expressed as a percentage. Different surfaces have different albedo values: fresh snow has the highest albedo (reflects most radiation), while older snow has lower albedo. Ice and water surfaces have intermediate albedo values, and dark surfaces like forests and soil have the lowest albedo, absorbing most solar radiation.
Click to watch →
Deep Dive
The process of evapotranspiration and how vegetation regulates surrounding air temperature through moisture release.

Contre les canicules EP2 : La végétation qui marche vraiment !
2.3K
Evapotranspiration is the process by which plants release water vapor, consuming energy from the ambient environment in the form of heat. This energy consumption causes a decrease in the temperature of the surrounding environment. The process works because water evaporation requires energy, which is drawn from the air as heat, thereby cooling the environment where evaporation occurs.
Click to watch →
How Food Forests Cool Your Yard Up To 20 Degrees F!!
1.7K
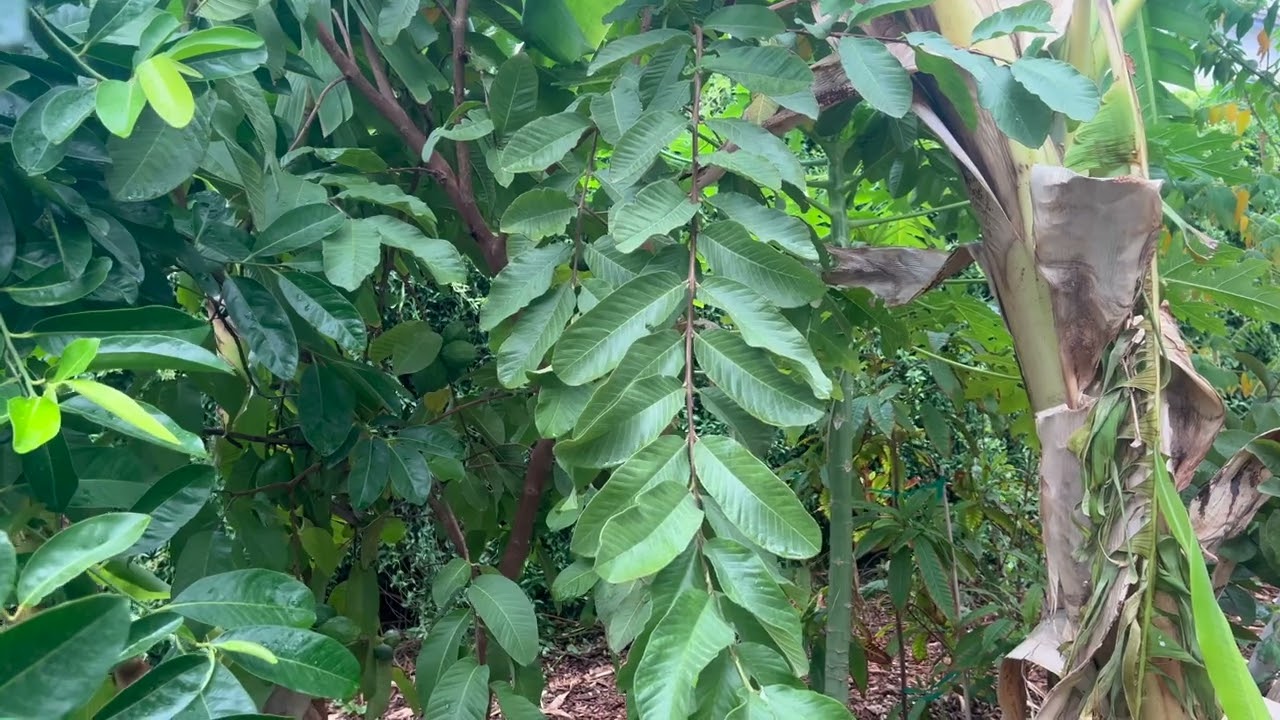
Evapotranspiration is the process by which plants cool the air through transpiration. Trees, shrubs, vines, grass, and weeds release water vapor through microscopic pores (stomata) in their leaves. This process is similar to human sweating. Plants pull water through their roots, up the stem, and out through the leaves. As the moisture evaporates into the surrounding air, it absorbs ambient heat, noticeably cooling the local temperature in the yard.
Click to watch →

5th January 2026 | The Hindu Editorial & News Analysis | Daily Current Affairs | Saurabh Pandey
5.3K
Evapotranspiration is the process by which water moves from the soil and plant surfaces into the atmosphere as water vapor. This process involves both evaporation (from soil and water bodies) and transpiration (from plant leaves). As water changes from liquid to vapor, it absorbs heat, which has a cooling effect on the surrounding environment. This is the primary mechanism by which vegetation cools urban areas.
Click to watch →
Judith Schwartz: Water in Plain Sight
938
Transpiration is the upward movement of water through plants, where stomata on leaves or grass blades open to retain or release moisture to cool the plant and nearby vicinity. This process transforms solar heat into latent heat, providing cooling. According to botanist Janka Corny, the transpiration activity of one tree on one sunny day represents three times the cooling capacity of an air-conditioner system in a five-star hotel. Research shows vegetation influences rainfall patterns: transpiration from plants accounts for 80 to 90 percent of atmospheric moisture over land, and about 40 percent of rainfall over land is recycled from evapotranspiration. Ecologists now use the term 'precipitation shed' to describe the source area of land and water that generate a region's rain. Plants release tiny particles and aerosols that provide surfaces for water droplets to condense around, called precipitation nuclei.
Click to watch →
Bioclimatología - Evapotranspiración: ¿por qué los árboles controlan nuestro clima?
793
Trees regulate their temperature and cool their surroundings through evapotranspiration, a natural process where water absorbed by roots is released as vapor through leaf stomata, creating cooling air currents that make areas beneath trees significantly cooler than their surroundings; a single tree can cool an area equivalent to 10 air conditioners operating continuously, making trees essential natural air conditioners that moderate climate, improve air quality, conserve water, and provide wildlife habitat.
Click to watch →
Deep Dive
Basic thermal properties of matter, specifically the high heat capacity and thermal mass of building materials like concrete and steel.

270126 Будівництво. Відповіді на ваше питання. Безкоштовний БліцВебінар.
1.7K
Building materials have different thermal properties affecting indoor climate. Concrete and ceramic materials have similar thermal mass (0.84 vs 0.8 kJ/kg·K), but concrete's higher density allows greater thermal mass participation. However, hollow concrete blocks and gas blocks have much lower effective thermal mass due to air-filled cavities. The key is calculating thermal mass at the actual operating temperature (15°C) and considering the actual material thickness that participates in thermal regulation.
Click to watch →
La climatisation : une nécessité ou une facilité… coupable ?
3.9K
Thermal mass refers to a material's ability to absorb, store, and release heat. Materials with high thermal mass (like concrete, stone, and dense wood) can absorb heat during the day and release it slowly at night, helping to moderate indoor temperatures. The key properties are: (1) Heat capacity - how much energy a material can store per unit mass, and (2) Density - how much mass is contained in a given volume. Materials with high thermal mass and high density are most effective for temperature regulation. Different building materials have vastly different thermal properties: mineral materials (silica, concrete, glass) have low heat capacity (820-900 J/kg·K) and low density; petrochemical materials (polystyrene, polyurethane) have moderate heat capacity (1200-1450 J/kg·K) and very low density; natural materials (wood, cellulose, linen) have high heat capacity (1800-2100 J/kg·K) and higher density. For summer cooling, materials with high heat capacity and density are superior because they can absorb more heat and release it more slowly, providing better thermal mass performance.
Click to watch →

【高校物理*熱力学講義10】比熱・熱容量
115
Concrete has low specific heat (0.88 J/g·K) but buildings have large thermal mass due to large mass. This causes slow temperature changes: concrete absorbs heat slowly during the day, keeping indoor temperatures cooler, and releases heat slowly at night, keeping indoor temperatures warmer. This explains why concrete buildings can be warmer at night than outside temperatures, contributing to nighttime heat stroke risks.
Click to watch →

ASTRONAUT TRAINING & MAGMA POWER - Oxygen Not Included: Ep. #15 - Building The Ultimate Base
41.6K
Different materials have different thermal properties. Steel has a heat capacity of 0.4 and thermal conductivity of 54, while lead has a heat capacity of 0.1 and thermal conductivity of 60. Steel is better for heat transfer applications despite lead having higher conductivity, because steel's higher heat capacity allows it to absorb more heat before transferring it.
Click to watch →

Transsolar World Academy | Building Physics: From Thermal to Site Energy | E. Roussel, T. Bitossi
460
Building materials' thermal performance depends on two key properties: thermal conductivity (λ, W/m·K) measuring heat conduction through solids, and heat capacity (J/K) measuring energy storage per Kelvin temperature change. Specific heat capacity (J/K/kg) and thermal capacity (J/K/m³) incorporate density effects. Insulation materials like mineral wool achieve λ ≈ 0.04 W/mK, compared to concrete's λ ≈ 2.0 W/mK—meaning one centimeter of insulation equals 50 centimeters of concrete in insulation value. Thermal mass (high-density materials like concrete and brick) stores heat absorbed during warm periods and releases it during cool periods, reducing temperature fluctuations. Buildings with high thermal inertia respond slowly to outdoor temperature changes, delaying peak temperatures and reducing amplitude. Simulation studies show concrete ceilings reduce overheating from 221 Kelvin-hours to 66 Kelvin-hours compared to lightweight ceilings, demonstrating thermal mass's effectiveness in hot climates.
Click to watch →
Deep Dive
The definition of a microclimate and how localized geographic and human-made features alter weather patterns on a small scale.
![Organism and Population Class-12 [SEM:4] One Shot in Bengali | COMEBACK ম্যারাথন | Suvojit Sir](https://i.ytimg.com/vi/qKKpD6XlqNI/maxresdefault.jpg)
Organism and Population Class-12 [SEM:4] One Shot in Bengali | COMEBACK ম্যারাথন | Suvojit Sir
5.3K
A microclimate is a small geographic area where environmental conditions like temperature and humidity differ significantly from the surrounding area. Examples include the shade of a large tree, which creates a cooler environment compared to the open area.
Click to watch →

Our varied weather (GRS8.3)
130
A microclimate is an area with slightly different weather conditions from the surrounding wider area. Five key factors influence local microclimates: Aspect (south-facing areas receive more sunlight and warmth than north-facing areas); Surface color (darker surfaces absorb more heat while lighter surfaces reflect it); Physical features (mountains create shade and wind shelter, water bodies provide cooling); Shelter (trees and hills block wind); Buildings (urban areas are warmer at night as buildings absorb heat during the day and radiate it back).
Click to watch →

Mostly Weather Audio Podcast - Microclimates
942
Microclimates are localized areas where climate differs from surrounding regions, ranging from continental scales to individual gardens. The term was coined by Thomas Bedford Franklin in the 1950s. Four primary geographic factors influence microclimates: latitude (northern areas are colder), altitude (higher elevations are colder), distance from large water bodies (water's high specific heat capacity creates temperature lagging effects), and urban versus rural location. These factors combine to create the unique climatic conditions that define microclimates.
Click to watch →

Briefly state about the microclimate. | 12 | ECOLOGY, ENVIRONMENT AND POPULATION | BIOLOGY | SAN...
117
A microclimate is a small-scale climate that differs from the surrounding area, typically influenced by local factors such as topography, vegetation, water bodies, or human structures, creating distinct temperature, humidity, and wind conditions in a specific location.
Click to watch →

All The Hay Work Just For Some More Rain?
20.8K
Local geography creates microclimates that significantly affect agricultural operations. The farmer describes how weather systems move from west to east, but the local geography creates unusual conditions. The farmer mentions that Cobleskill is always a weird area for weather, with storms coming through the valley. This demonstrates that local geography, including hills, valleys, and proximity to water bodies, can create microclimates that differ from broader regional weather patterns. Farmers in such areas must account for these local variations when planning agricultural operations.
Click to watch →
Prerequisite Knowledge
- Concept 01The concept of Albedo and how different surfaces (such as dark asphalt versus light-colored sand) absorb and reflect solar radiation.
- Concept 02The process of evapotranspiration and how vegetation regulates surrounding air temperature through moisture release.
- Concept 03Basic thermal properties of matter, specifically the high heat capacity and thermal mass of building materials like concrete and steel.
- Concept 04The definition of a microclimate and how localized geographic and human-made features alter weather patterns on a small scale.
Subsequent Learning
- Step 01Urban planning and green infrastructure design, including the implementation of green roofs, cool pavements, and strategic urban forestry.
- Step 02The public health implications of extreme urban heat, including heat-related illness vector analysis and environmental justice issues in low-canopy neighborhoods.
- Step 03Utilizing geographic information systems (GIS) and satellite thermal infrared sensors to map and monitor Land Surface Temperature (LST).
- Step 04Municipal policy tools and climate adaptation frameworks used by global cities to mitigate the economic and environmental costs of urban heat.
Urban Heat Crisis
Tree Planting Urgency
Urban Heat Crisis
0:00Playing Section
- 1
Victorian schools struggle to keep classrooms cool during extreme heat.
- 2
Cities can be 10 degrees hotter than rural areas due to the heat island effect.
- 3
Thermal imaging shows concrete stores heat, while trees cool the air.
Resource Trade-offs and the Compact City Paradox in Heat Mitigation
While urban greening (planting trees) is widely promoted to combat the Urban Heat Island (UHI) effect, critics and planners highlight significant ecological and structural trade-offs. First, the 'compact city paradox' notes that dense urban designs—crucial for reducing transport emissions—leave little physical space for trees, whereas spreading out cities to add vegetation promotes unsustainable suburban sprawl. Second, in arid climates, the massive water resources required to sustain urban forests can severely strain local water supplies, making greening ecologically counterproductive. Additionally, some researchers argue that focusing on high-albedo materials (reflective roofs and pavements) is a more resource-efficient cooling strategy than irrigation-dependent vegetation. Finally, in colder climates, the UHI effect actually offers benefits by reducing winter heating demands and cold-related mortality, meaning UHI mitigation is not universally beneficial.
Deep Dive
Urban planning and green infrastructure design, including the implementation of green roofs, cool pavements, and strategic urban forestry.

Секция "Белгородчина - рукотворный парк"
126
Urban green infrastructure addresses critical city challenges through green roofs, vertical greening, and strategic urban greenery. Green roofs retain 50-90% of precipitation, reducing stormwater burden on urban drainage systems. Cities like Stuttgart, Chicago, and London have successfully implemented green roof programs, with London targeting 32% of roofs to be green. Vertical greening using climbing plants offers aesthetic enhancement, facade protection from overheating and precipitation, biodiversity support, microclimate improvement, and noise reduction. Urban greenery should be viewed as strategic investment rather than cosmetic expense—research shows 10% investment in landscaping yields 20-25% property value increase. Cities like Toronto evaluate trees as economic and ecological assets, while Curitiba maintains 60 sq meters per resident. Greenery reduces crime by 30-50%, addresses flooding through strategic planting, and improves quality of life. The approach requires professional maintenance, appropriate species selection for climate, and integration with urban planning.
Click to watch →

Climate change, extreme events and health risks
422
Long-term solutions to urban heat involve climate-sensitive urban design and green/blue infrastructure strategies. Green infrastructure includes green roofs (which reflect more incoming solar energy than dark surfaces), reflective road surfaces (cooler materials reduce heat absorption), urban forestry (trees provide shading and increase evapotranspiration—a cooling process), and blue infrastructure (lakes, ponds, rain gardens that increase evaporation rates). These interventions can mitigate urban heat at both building scale and wider city scale.
Click to watch →

Grüne Dächer gegen den Klimawandel - Projekte und Strategien
331
Green roofs work best as part of comprehensive urban greening strategies: (1) facade greenery provides more direct street-level cooling than green roofs, (2) tree planting provides additional cooling and stormwater benefits, (3) combined green infrastructure approaches maximize benefits, and (4) green roofs should be integrated with other measures for optimal urban climate adaptation. No single measure provides all benefits.
Click to watch →
Rethinking Indian Cities | K Ashok Vardhan Shetty IAS | Roja Muthiah Research Library
3.4K
Green infrastructure includes green roofs (Toronto has mandated that any building with more than 2,000 square meters built-up area must put up a green roof), green walls (the first green wall in the world was built in Paris near the Eiffel Tower), bioswales (ditches that allow water to flow naturally), rain gardens, constructed wetlands, avenue trees, pocket parks (in Netherlands and Europe, many small streets were converted into parks), and urban forests. In Chennai, 50% of the area is paved. The trick is to not pave more and allow the water cycle to behave naturally.
Click to watch →

7. Sitzung des Bauausschuss
202
Urban green infrastructure planning involves systematic approaches to integrating nature into city development: (1) Identifying suitable urban areas for ecological enhancement, (2) Developing comprehensive green infrastructure concepts including vegetation, water management, and habitat creation, (3) Implementing measures such as green roofs, permeable surfaces, and native plantings, (4) Creating climate adaptation strategies including cooling effects and flood management. These measures contribute to urban resilience and environmental quality.
Click to watch →
Deep Dive
The public health implications of extreme urban heat, including heat-related illness vector analysis and environmental justice issues in low-canopy neighborhoods.

Mapping Urban Heat Islands Jeremy Hoffman PhD Science Museum of Virginia | Katie Patrick
121
Heat events cause more deaths annually than storms, wind, or tornadoes combined. Urban heat islands create significant social justice concerns because extreme heat disproportionately affects vulnerable communities—those lacking access to parks, cooling centers, or financial resources for air conditioning. These communities often have higher concentrations of dark surfaces and fewer green spaces. Without heat island data, systemic problems remain invisible. The combination of structural disenfranchisement and environmental hazards creates compounded vulnerability, particularly for elderly populations, outdoor workers, and children. Refrigerants used in air conditioning rank among the most significant climate solutions, making reducing cooling demand a dual benefit for both climate change and public health.
Click to watch →
Blum Center Program: Hot Days and Bad Air – Dangerous Dance Partners
110
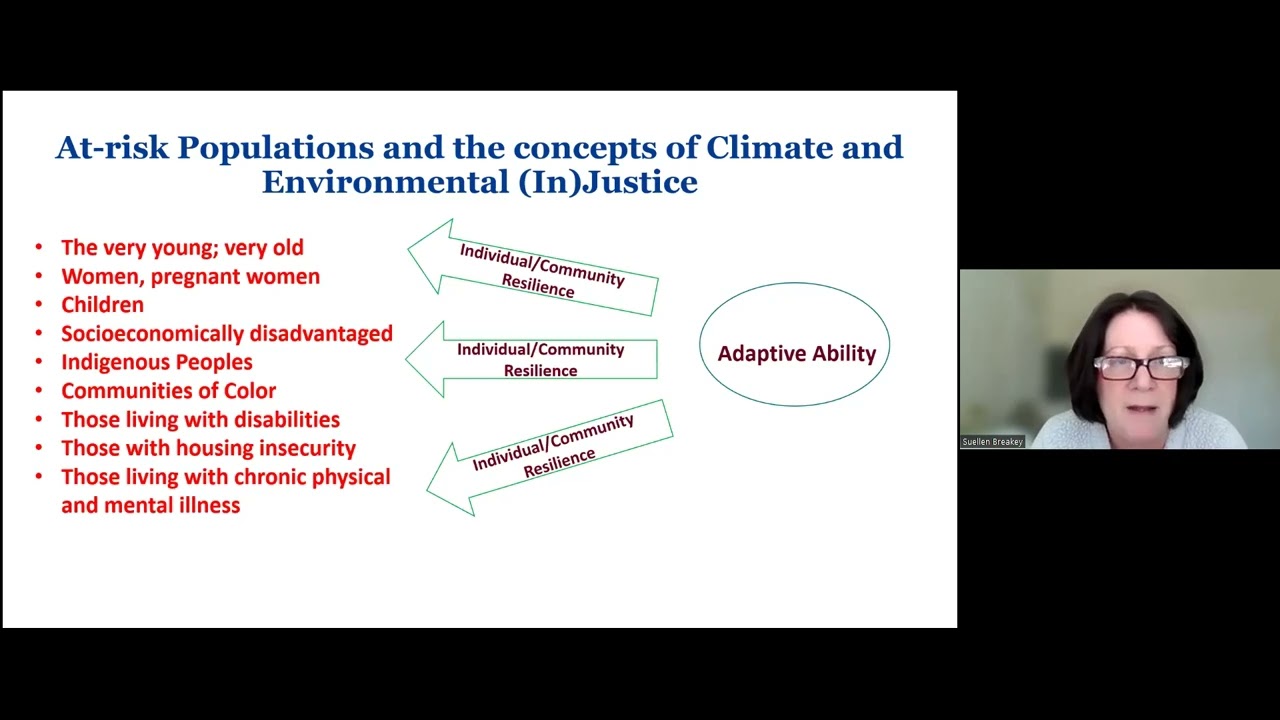
Climate projections indicate extreme heat events (heat index above 125°F) will impact 8 million people this year, rising to 107 million by 2053, concentrated in central U.S. regions lacking coastal relief. The heat index combines temperature and humidity—90°F at 75% humidity feels like 109°F. Urban heat island effect intensifies this problem: asphalt and pavement absorb heat during the day and radiate it at night, preventing cooling even after sunset. Trees and grass provide natural cooling through shade and evapotranspiration. Vulnerable populations include very young and elderly individuals, pregnant women facing poor birth outcomes, children, socioeconomically disadvantaged communities, indigenous peoples, communities of color (often residing in environmental justice communities due to historic redlining policies), people with disabilities, those with housing insecurity, and individuals with chronic physical or mental illness. Geographic analysis shows densely populated urban areas with less tree cover experience higher temperatures and compounded health risks.
Click to watch →

Throwing Shade: Heat Islands, Public Health, and Clean Water
694
Urban heat islands—areas where human-made surfaces like asphalt and concrete absorb and retain more heat than natural landscapes—create significant public health risks, particularly in historically marginalized communities that have been systematically disadvantaged through practices like redlining; expanding tree canopy coverage serves as a critical intervention to reduce urban temperatures, improve air quality, decrease stormwater runoff, and address these environmental inequities.
Click to watch →

Kimberly Garza - Cool Conscious Cities: Promoting Cool Equity for All
166
Disadvantaged communities face disproportionate heat exposure due to historical disinvestment in green infrastructure. Juanita Cruz Perez in San Antonio exemplifies this crisis, forced to choose between running her AC or paying bills. The urban heat island effect intensifies these conditions, making cities significantly warmer than surrounding areas. Heat kills over 1,700 Americans annually, with deaths rising 245% since 2000. Low-income communities have 41% less tree canopy coverage than wealthier areas, a legacy of redlining that excluded investments in parks, trees, and open spaces. The Tree Equity Score tool helps identify areas needing intervention by analyzing canopy coverage, demographics, and surface temperatures.
Click to watch →

6th Annual Equity Indicators Symposium
190
Urban heat islands occur when concrete and asphalt surfaces absorb and retain heat, creating significantly higher temperatures in urban areas compared to surrounding rural areas. These effects disproportionately impact low-income communities of color who often live in areas with less tree canopy and green space. Extreme heat is the leading weather-related cause of death in the United States, and addressing urban heat islands through increased tree canopy and green infrastructure is essential for environmental justice and public health.
Click to watch →
Deep Dive
Utilizing geographic information systems (GIS) and satellite thermal infrared sensors to map and monitor Land Surface Temperature (LST).
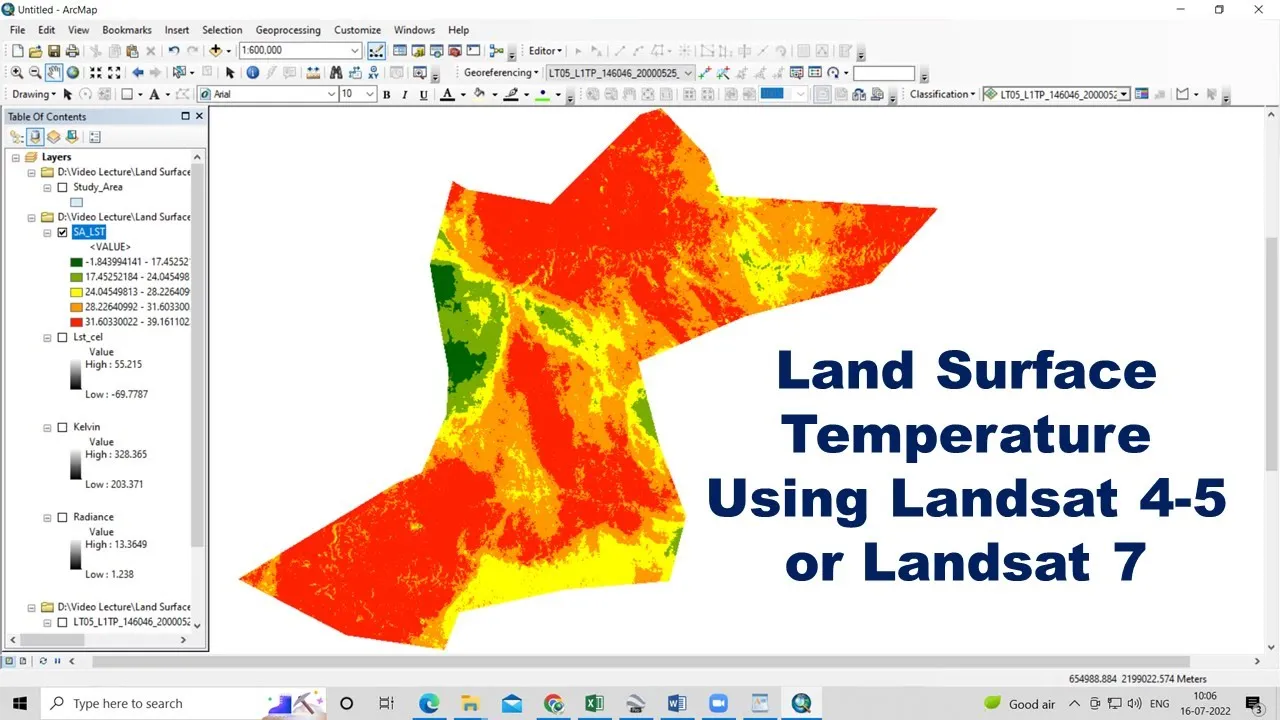
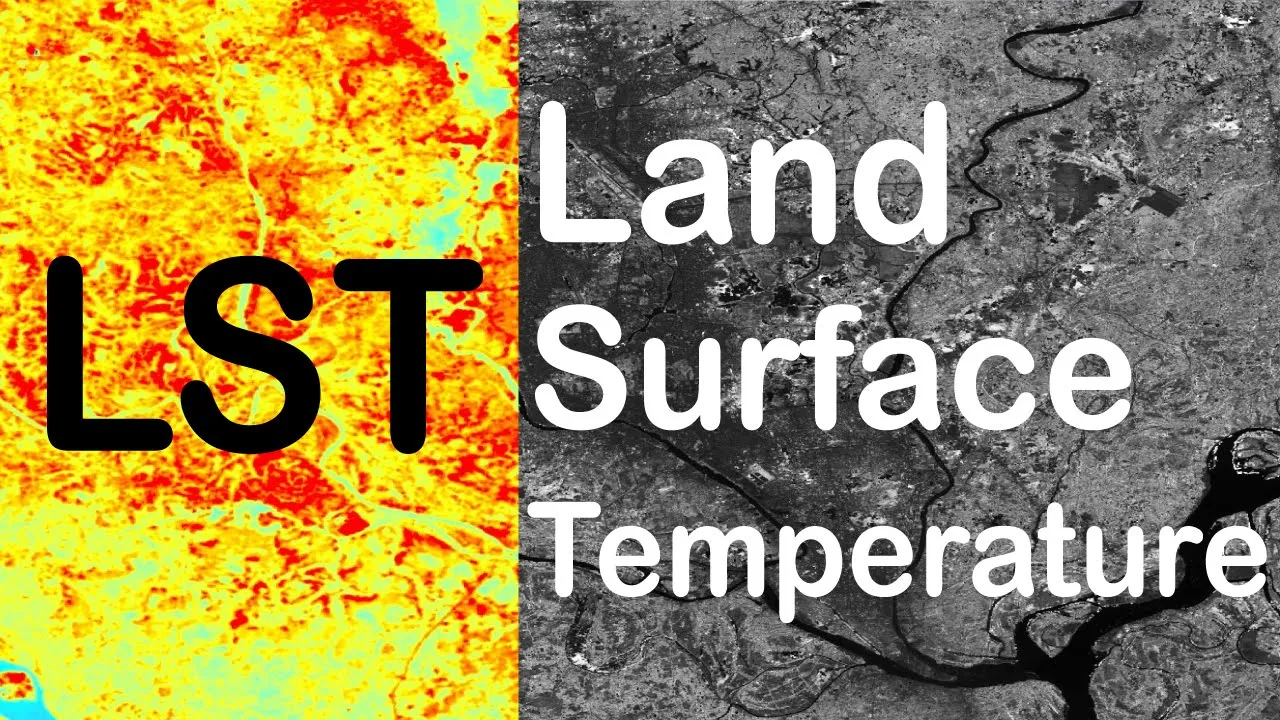
Land Surface Temperature (#LST) Using Landsat 4-5 or Landsat 7
17.9K
Land Surface Temperature (LST) can be calculated from Landsat 5 or 7 thermal infrared band (band 6) data through a three-step process: (1) Convert Digital Numbers (DN) to radiance using the formula Lλ = ((Lmax - Lmin)/(QCalMax - QCalMin))*(DN - QCalMin) + Lmin, where Lmax, Lmin, QCalMax, and QCalMin are obtained from the metadata file; (2) Convert radiance to brightness temperature using BT = K2 / ln(K1/Lλ + 1), where K1 and K2 are sensor-specific calibration coefficients; (3) Convert Kelvin to Celsius by subtracting 273.15. This process requires using ArcGIS Raster Calculator and involves extracting the thermal band, applying the formulas sequentially, and optionally masking the output to a study area.
Click to watch →
Land Surface Temperature (LST) from Landsat 8/9 with ArcGIS | ArcMap
14.5K
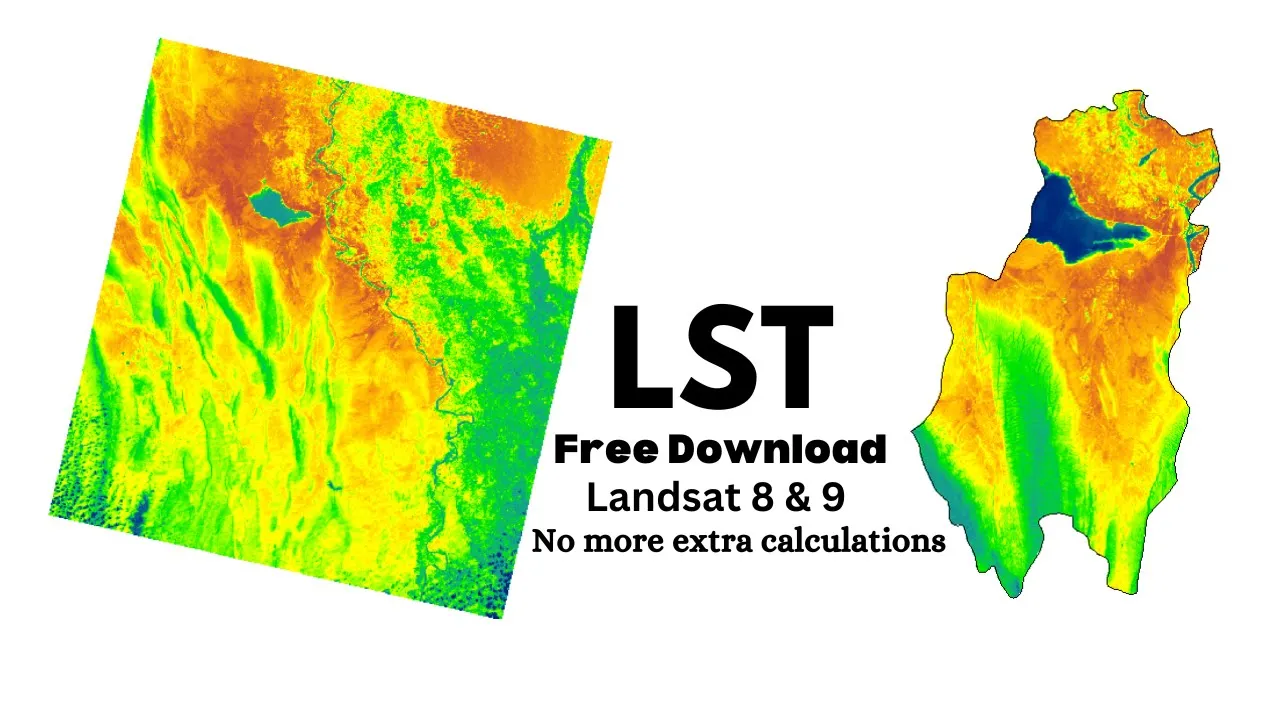
Land Surface Temperature (LST) can be calculated from Landsat 8/9 thermal infrared band 10 data through a five-step process in ArcGIS: (1) Calculate Top of Atmosphere (TOA) spectral radiance using Lλ = ML × DN + AL, where ML = 0.003342 and AL = 0.1 for Band 10; (2) Convert TOA radiance to brightness temperature using BT = K2 / ln((K1/Lλ) + 1), with K1 = 776.04 and K2 = 13211; (3) Calculate Normalized Difference Vegetation Index (NDVI) using (Band 5 - Band 4) / (Band 5 + Band 4); (4) Compute land surface emissivity using ε = 0.004 × PV + 0.986, where PV = [(NDVI - NDVI_min)/(NDVI_max + NDVI_min)]² and NDVI_min ≈ -0.21, NDVI_max ≈ 0.99; (5) Apply the final LST formula incorporating brightness temperature, emissivity, wavelength (λ = 10.8 μm), and Planck constant (C2 = 14388) to generate the LST raster map.
Click to watch →

LST, Urban Heat Island Effect, and UTFVI Analysis using Google Earth Engine and Landsat dataset
162
This comprehensive section covers the complete technical workflow for monitoring Land Surface Temperature (LST) using Landsat satellite data in Google Earth Engine. The process begins with selecting appropriate satellite data based on study scale—MODIS (1,000m resolution) for large-scale analysis versus Landsat 8 (30m resolution) for detailed local monitoring. Students learn to import study area boundaries, filter image collections by cloud cover, date, and geographic bounds, and create median composites. The core technical workflow includes: (1) Calculating Normalized Difference Vegetation Index (NDVI) using Band 5 (near-infrared) and Band 4 (red) with the formula (Band5-Band4)/(Band5+Band4); (2) Determining statistical parameters including maximum and minimum NDVI values using reduceRegion; (3) Computing vegetation proportion (PV) using the normalized formula: PV = ((NDVI - NDVI_min)/(NDVI_max - NDVI_min))²; (4) Deriving brightness temperature from Band 10 (thermal infrared); (5) Estimating surface emissivity using the empirical formula: Emissivity = 0.004 × PV + 0.986; (6) Applying the physical formula for LST: LST = (TI / (1 + (λ × TI) × ln(ε))) - 273.15, where TI is brightness temperature, λ is Planck's constant (1.438 × 10⁻² m·K), and ε is surface emissivity. The result is converted from Kelvin to Celsius by subtracting 273.15. Visualization techniques using color gradients are demonstrated, with blue indicating low temperatures and red indicating high temperatures.
Click to watch →
Download Free Landsat LST Data | How to Calculate Land Surface Temperature | Quick LST Data
1.1K
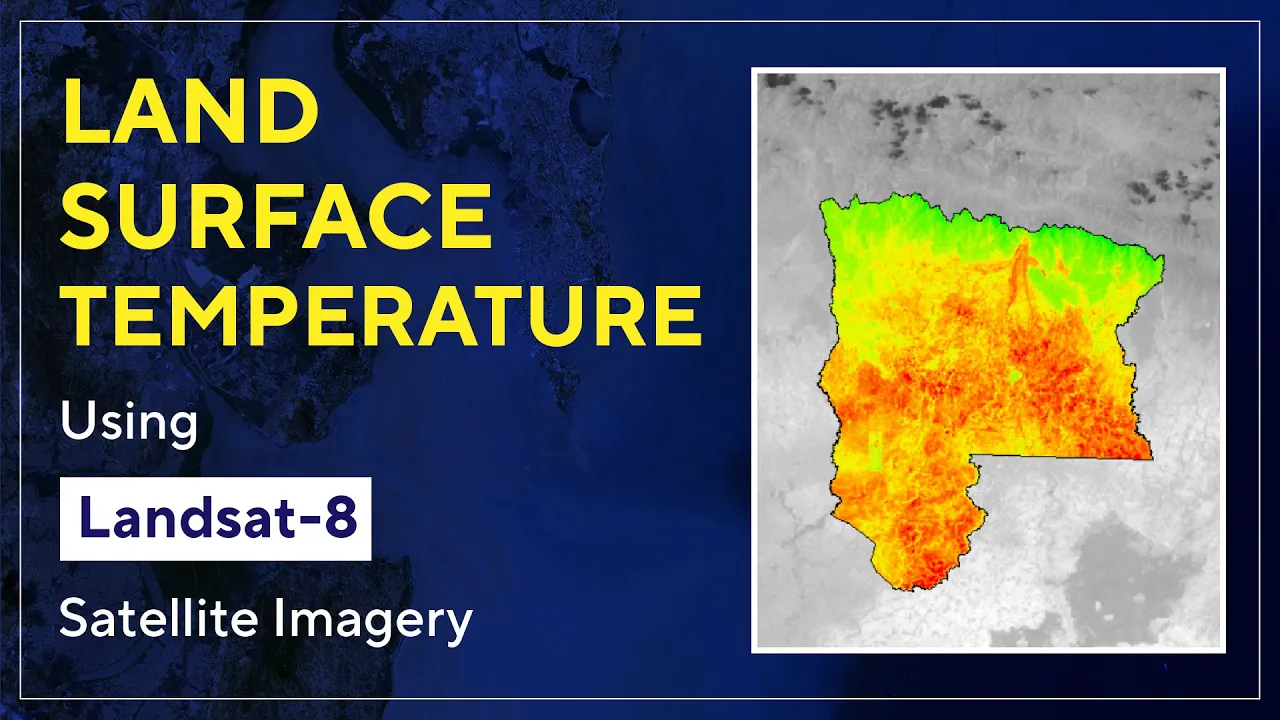
This video tutorial demonstrates how to calculate land surface temperature (LST) from Landsat 8/9 thermal infrared bands (Band 10) using a systematic workflow: first download Landsat Level-2 science products from USGS Earth Explorer, then apply the scale factor and additive offset values from the .MTL metadata file to convert raw digital numbers to Kelvin temperature, followed by converting Kelvin to Celsius by subtracting 273.15, and finally clip the output to your study area using a shapefile for targeted analysis.
Click to watch →
Calculating Land Surface Temperature Using Landsat 8 Imagery In ArcGIS || The GIS Hub || #LST #gis
11.3K
This comprehensive tutorial demonstrates the complete methodology for estimating land surface temperature using Landsat 8 thermal infrared band 10 (10.8 micrometers). The workflow involves sequential processing: (1) Converting digital numbers to radiance using ML and AL coefficients from metadata; (2) Calculating brightness temperature using BT = K2/ln((K1/Lambda)+1) - 272.15; (3) Generating NDVI from Bands 5 (NIR) and 4 (Red); (4) Calculating vegetation proportion (PV) and emissivity; (5) Deriving LST using the formula incorporating brightness temperature, wavelength, and emissivity; (6) Extracting results for the study area using the Extract by Mask tool. Results show temperature ranges from 24°C to 41°C, correlating with land cover types.
Click to watch →
Deep Dive
Municipal policy tools and climate adaptation frameworks used by global cities to mitigate the economic and environmental costs of urban heat.

EMF-ECBC Academy - Professor Mattheos Santamouris, University of New South Wales, Australia
211
Two contrasting scenarios illustrate urban development paths. The gray scenario follows current trends: emerging economies adopt Western air conditioning models, resulting in 30% discomfort increasing to 70%, 40% mortality increase, 70% ozone rise, and 150% energy consumption growth. The green ecosystem approach prioritizes improving urban quality first—reducing temperatures 4°C through mitigation technologies, decreasing energy consumption or maintaining stability, reducing discomfort from 30% to 20%, lowering mortality 30%, and cutting pollution 20%. The global cost of urban overheating is $500-700 billion annually, projected to reach $1.33 trillion by 2050 without action. Proactive mitigation costs $100-350 billion annually. The primary barrier is economic, not technological. A proposed market-based system would require entities increasing urban temperatures to pay, while those reducing temperatures receive credits. Current built environment research suffers from disciplinary fragmentation—effective policy requires holistic approaches integrating technological, financial, environmental, health, and economic factors simultaneously.
Click to watch →

Adaptación del cambio climático en ciudades. Herramientas para ayuntamientos
145
This comprehensive section establishes the urban climate adaptation framework. Cities concentrate 70% of population and 80% of energy demand, making them primary climate contributors. The project provides municipalities with tools for local adaptation strategies, focusing on adaptation rather than mitigation. Key global frameworks include Sustainable Development Goals, Paris Agreement, and UN Urban Agenda. Climate change presents multi-dimensional risks: physical impacts like rising temperatures and sea levels, and transmission risks from policy changes. Multiple urban sectors face impacts including coastal zones, water resources, financial systems, infrastructure, transportation, and public health. Effective adaptation requires cross-departmental governance beyond environmental departments.
Click to watch →

International Roundtable Exchange on Urban Adaptation Governance
134
Milan is exploring a climate budget approach to make choices among environmental impacts, climate impacts, and economic impacts of municipal actions. This approach considers both CO2 and money costs, integrating mitigation and adaptation measures together. The approach is still being piloted and represents an experimental method for making choices about environmental and climate impacts of municipal actions. This tool helps cities balance different priorities when allocating resources for climate action.
Click to watch →

Ciclo de Eventos Mudanças Climáticas e os Desafios das Cidades
228
Urban climate policy operates on a tripod structure: mitigation (emission reduction through inventories and targets), adaptation/resilience (territory preparation for climate impacts), and governance (institutional frameworks). This tripod is embedded in the Paris Agreement and IPCC AR6, emphasizing local government protagonism. The ISO 37000 series provides technical standards for sustainable, smart, and resilient cities, offering comparable metrics for municipal planning. Climate-resilient development requires integrating climate considerations into master plans, zoning laws, and building codes using risk maps for heat, water, and vulnerabilities. The Sendai Framework organizes disaster risk reduction around understanding risk, strengthening governance, investing in reduction, and enhancing preparedness, with 'build back better' as a core principle.
Click to watch →

Globaler Klimawandel: Veränderungen des lokalen Stadtklimas - Ein Vortrag von David Stoitner
1.6K
Climate adaptation differs from climate protection: protection reduces emissions to prevent change, while adaptation responds to unavoidable impacts. Both strategies are complementary, with more protection reducing adaptation needs. Offenbach developed an integrated climate concept combining both approaches. Climate function maps identify thermally stressed and relieving urban areas by integrating satellite data on surface temperatures, cold air formation, and air flow patterns. Color-coded zones indicate areas with high thermal stress on human circadian rhythms. Future scenarios show currently stressed areas will become even more stressed. Vulnerable populations (over 75, children under 6, the sick, pregnant women, economically disadvantaged) require particular attention in urban planning. Green-blue infrastructure combines vegetation and water management to reduce urban heat, with albedo increase and urban trees having the greatest cooling impact.
Click to watch →
Urban Heat Crisis
Tree Planting Urgency
Urban Heat Crisis
0:00- 1
Victorian schools struggle to keep classrooms cool during extreme heat.
- 2
Cities can be 10 degrees hotter than rural areas due to the heat island effect.
- 3
Thermal imaging shows concrete stores heat, while trees cool the air.
Resource Trade-offs and the Compact City Paradox in Heat Mitigation
While urban greening (planting trees) is widely promoted to combat the Urban Heat Island (UHI) effect, critics and planners highlight significant ecological and structural trade-offs. First, the 'compact city paradox' notes that dense urban designs—crucial for reducing transport emissions—leave little physical space for trees, whereas spreading out cities to add vegetation promotes unsustainable suburban sprawl. Second, in arid climates, the massive water resources required to sustain urban forests can severely strain local water supplies, making greening ecologically counterproductive. Additionally, some researchers argue that focusing on high-albedo materials (reflective roofs and pavements) is a more resource-efficient cooling strategy than irrigation-dependent vegetation. Finally, in colder climates, the UHI effect actually offers benefits by reducing winter heating demands and cold-related mortality, meaning UHI mitigation is not universally beneficial.
The concept of Albedo and how different surfaces (such as dark asphalt versus light-colored sand) absorb and reflect solar radiation.
The process of evapotranspiration and how vegetation regulates surrounding air temperature through moisture release.
Basic thermal properties of matter, specifically the high heat capacity and thermal mass of building materials like concrete and steel.
The definition of a microclimate and how localized geographic and human-made features alter weather patterns on a small scale.
Urban planning and green infrastructure design, including the implementation of green roofs, cool pavements, and strategic urban forestry.
The public health implications of extreme urban heat, including heat-related illness vector analysis and environmental justice issues in low-canopy neighborhoods.
Utilizing geographic information systems (GIS) and satellite thermal infrared sensors to map and monitor Land Surface Temperature (LST).
Municipal policy tools and climate adaptation frameworks used by global cities to mitigate the economic and environmental costs of urban heat.
67.7K views485likes2:40@SkyNewsOriginal Release: 2022-07-15
our towns and cities just weren't built to be this hot baked by the sun with little shade urban living can be stifling at mossborne parkside academy in east london the children are well drilled the school is victorian and keeping the classrooms cool is a challenge all our windows are open and as much as possible before and after school and during the day we have blackout blinds so we actually have them closed when the children aren't learning and just to try and keep those classrooms as cool as possible temperatures could top 40 degrees in parts of england early next week but in the cauldron of the concrete jungle the heat is intensified still further studies have shown the centers of london and manchester can be 10 degrees warmer than surrounding rural areas it's an effect called the urban heat island and with a thermal imaging camera you can see it in action the brick the concrete the asphalt is all glowing red hot as it absorbs the sun's radiation and stores it as heat but look at the contrast of a tree it's not just the shade beneath which is a cooler blue but the leaves themselves are kind of in between on that color spectrum as they're absorbing some of the sun's energy but evaporating water keeping them cool and the surrounding air data given to sky news shows how that makes a difference even in a relatively small town sensors dotted around guildford in surrey show the heat rising on monday morning by early afternoon the temperature in the built-up area was seven degrees higher than a nearby park and it took longer to cool still three degrees warmer at midnight you will not feel comfortable you know the thermal comfort is an issue but if you are an elderly or having any pre-existing you know the the conditions so you are higher at risk for the heat stroke or cardiovascular or the respiratory you know the impact and that can be fatal that can be fatal 90 of the uk population is expected to live in an urban area by 2050. the charity trees for cities is planting shade for the future but warns it can't do it fast enough there's never been more focus and funding for trees in general which is fantastic we should recognize that but a lot of that funding historically has been focused on on the the royal environment on the countryside and we believe that we need to shift that balance in order to invest much more into our cities the government says it wants to plant 150 000 trees in urban areas but the money for this year has already run out the sooner they go in the ground the greater the shade and the even more intense heat waves of the future thomas more sky news
Up Next
3:03
Albedo Explained: Urban Surfaces & Climate Impact
@CSHubMIT
54.8K views•2019-04-12

15:54
Life in Biosphere 2: Sustainable Ecosystems & Human Survival
@TED
334.9K views•2009-06-16
14:30
Microplastics Everywhere: How Plastic Impacts Our Lives
@TEDx
100.9K views•2018-05-08
10:28
Ice Stupa Artificial Glaciers: Solving Ladakh's Water Crisis
@SonamWangchuk66
3.2M views•2015-05-03
Related Study Plans & Knowledge Roadmaps
Structured learning paths in Environmental Science
environmental-science
Ocean Noise: Cetacean Impacts & Mitigation
01Fundamentals of Underwater Acoustics
02Marine Mammal Bioacoustics
03Anthropogenic Noise: Shipping & Seismic Surveying
+ 2 more learning modules
16h5 modules
Explore Roadmap
environmental-science
Road Ecology: Corridors, Overpasses & Fencing
01Foundations of Habitat Fragmentation and Carnivore Ecology
02The Road Barrier: Ecological Impacts of Transport Infrastructure
03Principles of Ecological Corridors and Connectivity Mapping
+ 3 more learning modules
14h6 modules
Explore Roadmap
environmental-science
Ocean Acidification: Kelp Buffering & Shellfish
01Fundamentals of Ocean Chemistry & pH
02Chemical Pathways of Coastal Acidification
03Bivalve Physiology & Calcification Under Stress
+ 2 more learning modules
18h5 modules
Explore Roadmap
environmental-science
Ice Stupas: Glacial Retreat & Water Security
01Foundations of Glaciology & Mountain Hydrology
02Climate Change and Glacial Retreat Dynamics
03The Science of Ice Stupas & Artificial Glaciers
+ 2 more learning modules
14h5 modules
Explore Roadmap