

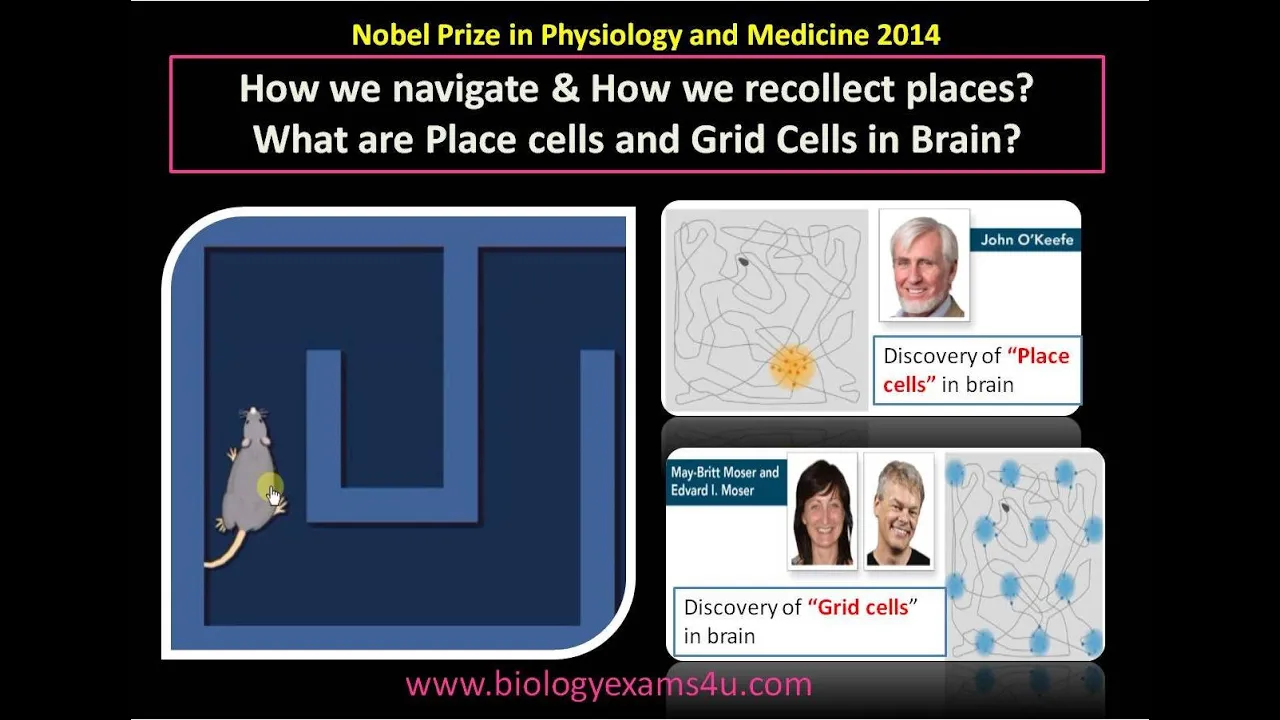













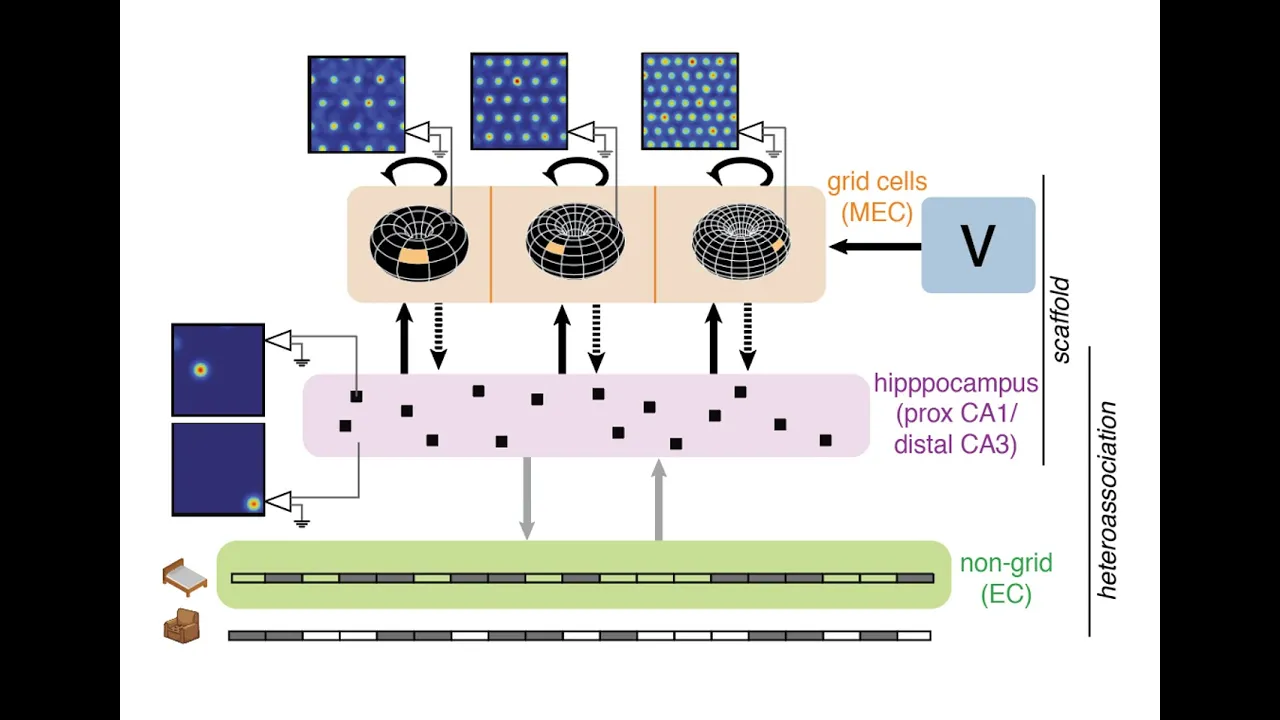

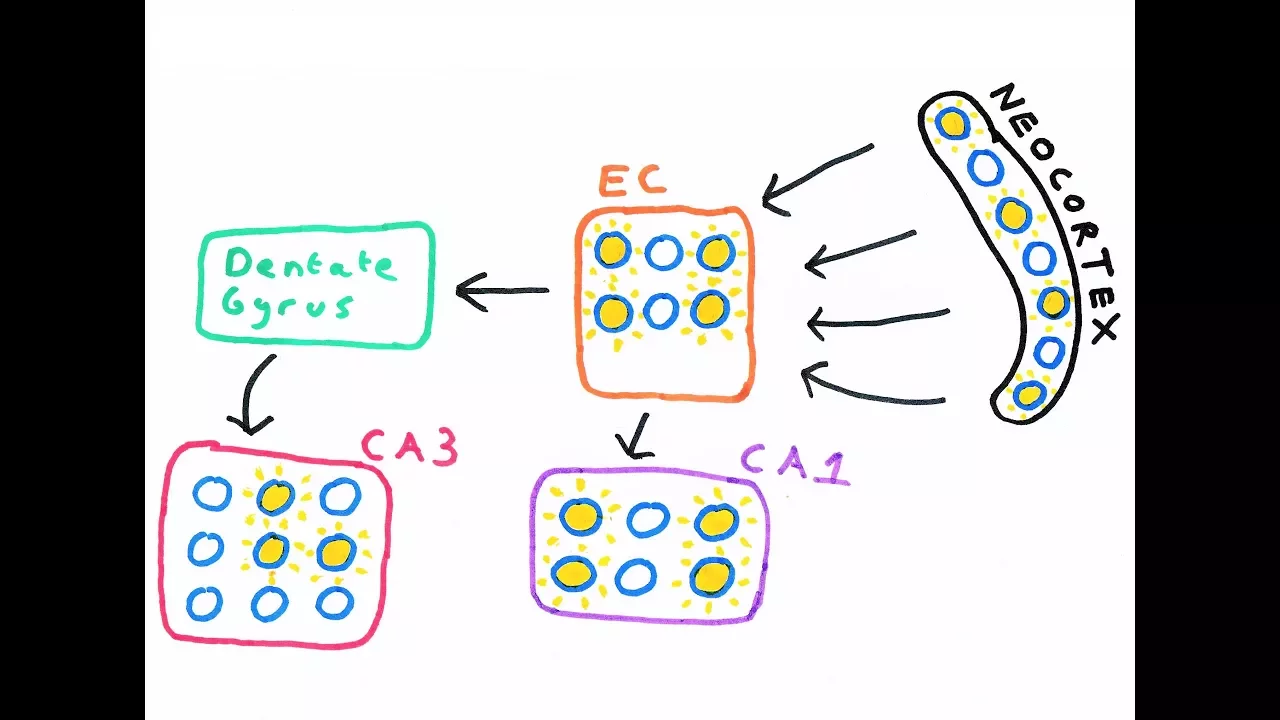



The entorhinal cortex contains grid cells that fire in a regular hexagonal pattern across space, providing a metric representation of location that complements the place cells in the hippocampus. Unlike place cells, which remap their firing patterns in different environments, grid cells maintain a stable map that is simply shifted or rotated across environments. Grid cells are organized into modules with different spatial scales that increase in a geometric progression, allowing efficient representation of space. The entorhinal cortex also contains other spatial cell types including head direction cells, border cells, and object vector cells that encode positions relative to environmental landmarks. Recent research has shown that the lateral entorhinal cortex encodes time in a manner similar to how it encodes space, with time representation being experience-dependent and adaptable to different behavioral contexts.
Grid Cells and the Brain's Map of Space | Moser Lecture
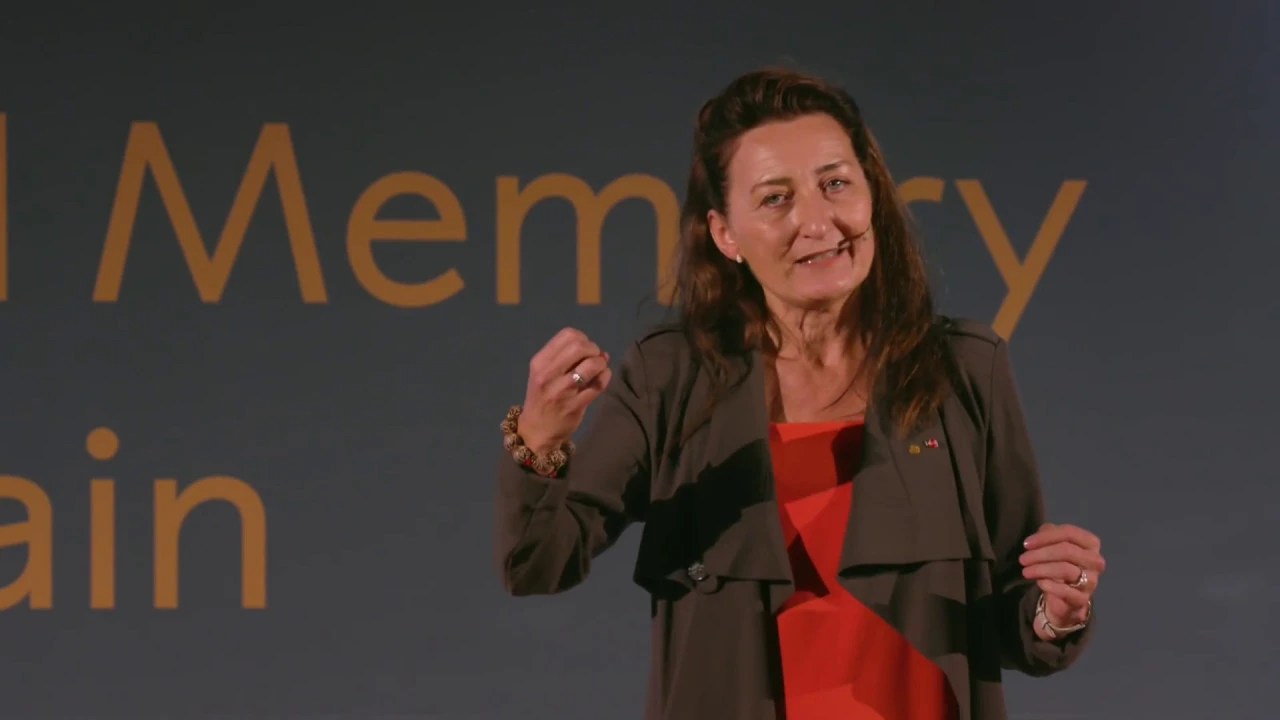
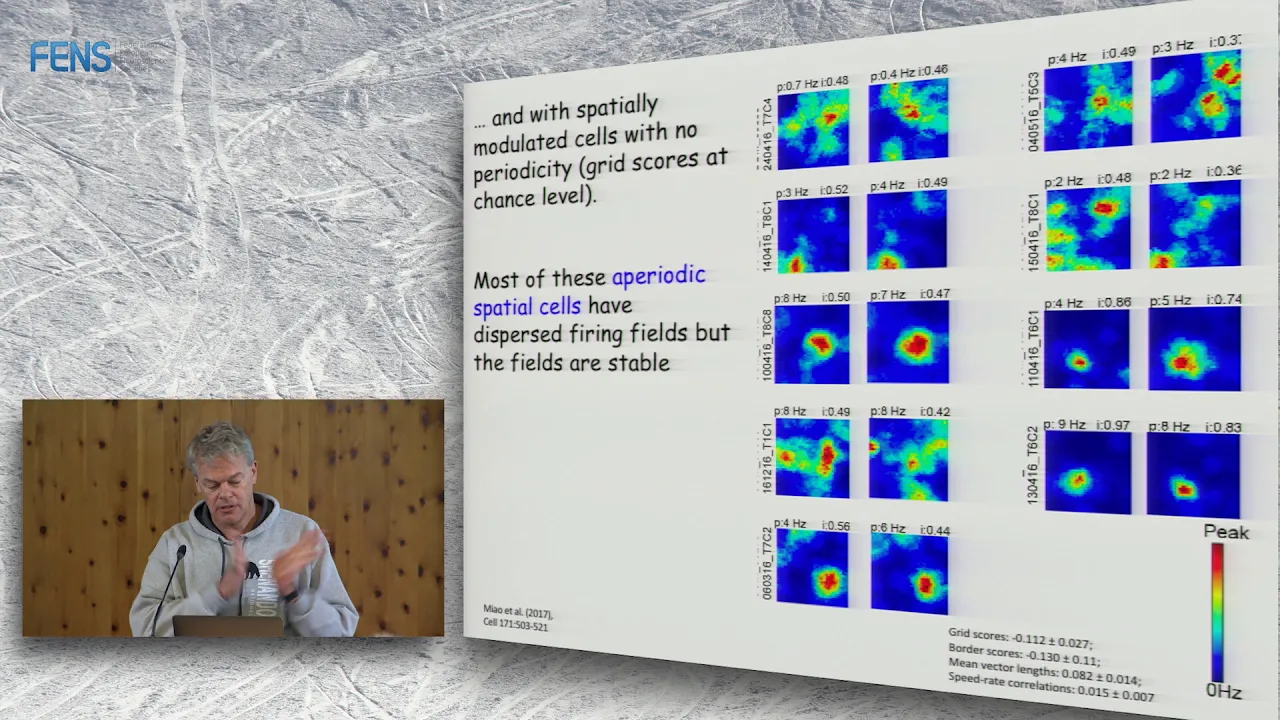
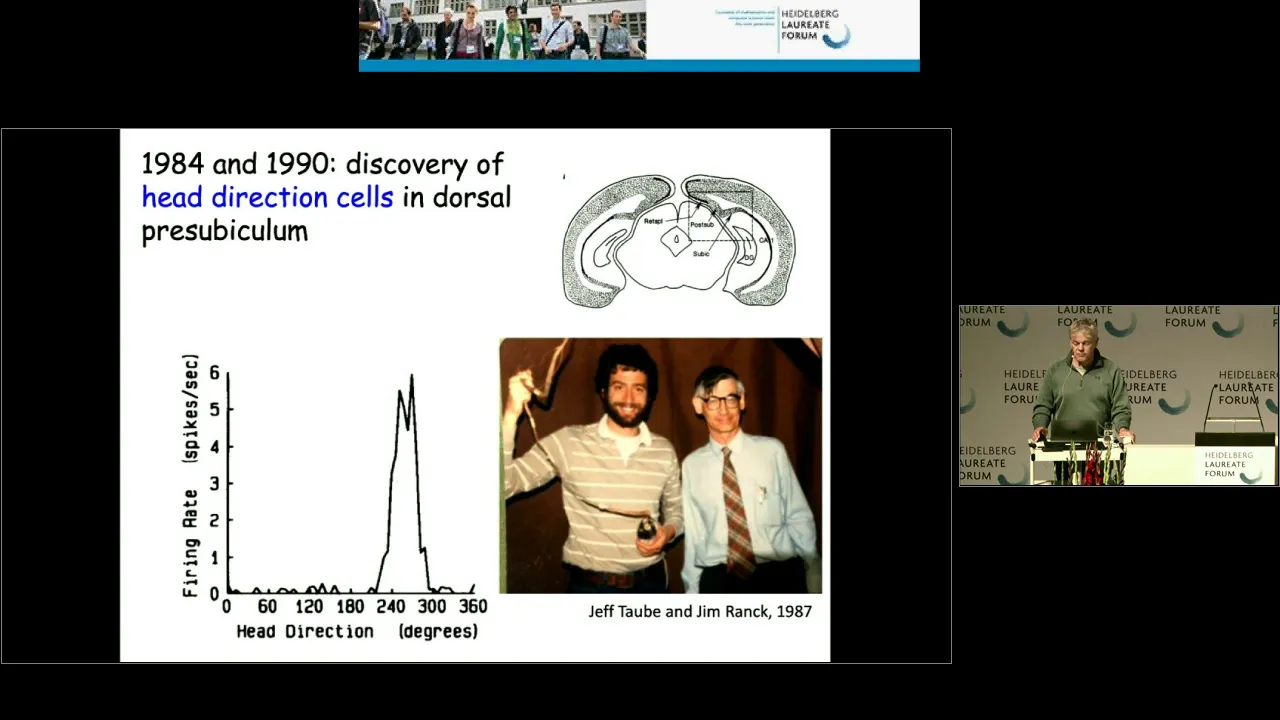
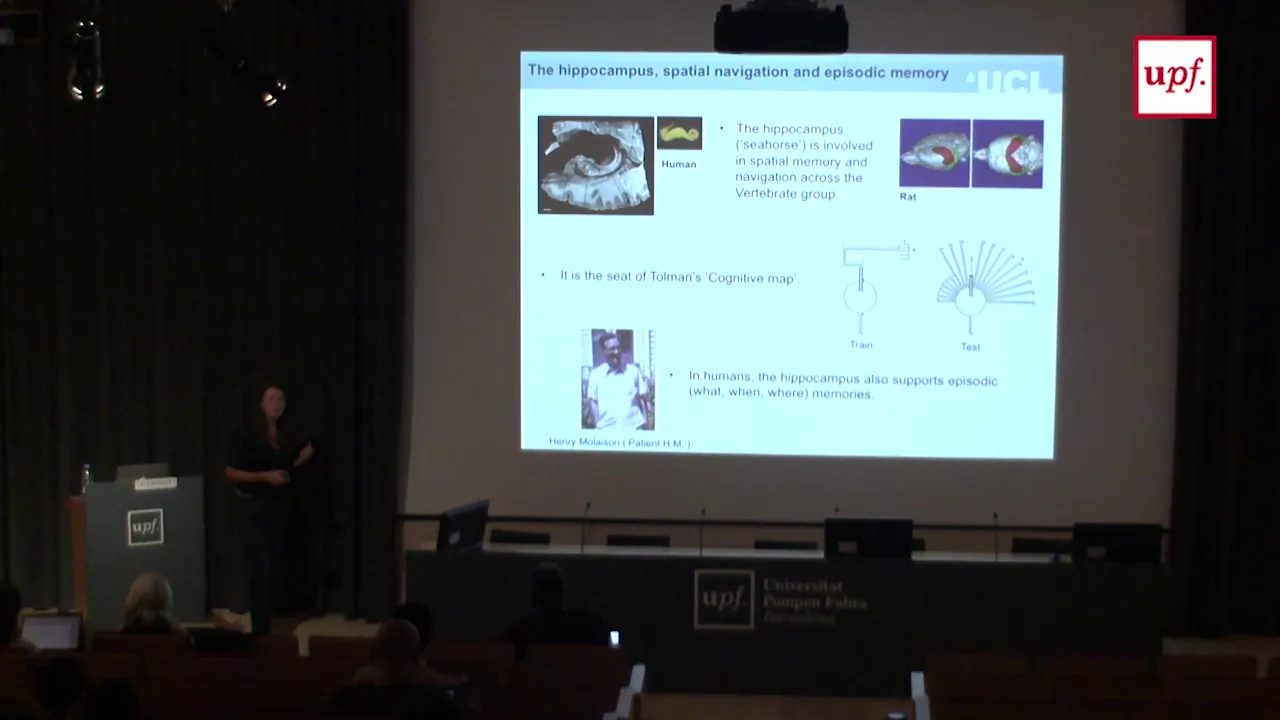
Added:[Music] it's my privilege and my honor to be able to introduce our keynote speaker today and I just want to spend a couple of minutes I don't want to eat up too much of his time because it's already been long enough that I've taken but I would just want to tell you a few things about him he is a professor of neuroscience and the director of the Cavalier Institute for systems neuroscience at the Norwegian University of Science and Technology in Trondheim Norway he did most of his formative training at the University of Oslo with Pierre Anderson which I think he shares in common actually with many people in this audience he then did a postdoctoral fellowship with John Okeefe and with Richard Morris at University of Edinburgh and UCL and the work that he's going to talk about today is really the the the large corpus of work that he has done in his career in collaboration with my great Moser focuses on how spatial memories and spatial locations are encoded in the brain and the mechanisms that are required to to formulate some sense of where you are and how you can navigate in space now this work was incredibly influential and transformative it earned him my bread Moser and John Okeefe the 2014 Nobel Prize in Physiology or medicine some of our speakers more recent work which I hope he will have an opportunity to talk about today also focuses on taking this premise of understanding neural computation underlying space and memory in the brain to try to understand time and understand how time is also processed in the brain and maybe there are shared mechanisms there maybe there are differences I think we'll have to wait to hear from him on that but that's something I'm particularly excited to hear from him about some of these new directions in the work one of the things I want to mention about our speaker also is that if you have a chance to spend more than a couple of minutes with him you'll realize something very very special aside from his global renown and his accomplishments he's also one of the most humble people I have ever met and I think you'll know this just by talking to him for a few minutes he's very generous with his time with students with colleagues and I've always had a listening ear what I've tried to reach out to him and chat about data and science I also want to thank take this opportunity to thank Nura Lynx who have sponsored this keynote lecture near Lynx and our speaker actually have kind of a history they go way back and this is something that I think is really just spectacular for us to be able to have their support for this conference and in particular for this keynote lecture now I know you're in for quite a treat I don't want to take up any more of your time so with that ladies and gentlemen please to help me give a warm welcome to our speaker edvard moser [Applause] so thank you a lot Mike for the my introduction and thanks to both you and Manuel and everyone else who has organized and prepared this conference I think the size of the audience the number of people who testified you don't have that slide up the whole time not only to the great work that is being done here but also to to the importance of this Center in the history of modern neuroscience and especially where the focus on learning and memory and my congratulations especially to Jim macaw for starting all of this so my talk will be I was told explicitly when we started when when I prepare this that this is a combined public talk and scientific talk which is something that's really hard to achieve actually but I will start out at the primary school level in the beginning and then I will go gradually up and during the second half of my talk I will move into unpublished territory and include some new principles of the position coding in the entorhinal cortex and then move over to as Mike said to time which is the most recent work and which will serve as an introduction to another talk that my former PhD student Albert South will go into more detail on tomorrow but let's begin with location and space so I thought I could not be worse than both Jim Lynn who both had pictures of gulls so I'll do the same and here's my gull brain it shows the different faculties or abilities or properties and how they are labeled onto the brain and I think both speakers made the important point that this had actually tremendous influence on neuroscience it set the stage and then was forgotten for many years but actually today with trajectories into circuits and not only areas and principles for cooperation collaboration interaction between many cells we are actually getting back to the point where we can start to understand some of the psychological functions that are enabled by the brain and especially the cortex however since the 18th the 19th century concepts have moved forward - and that's also one of the reasons now with a more conceptual advances and better ideas and models for how the brain might work at the psychological level we are actually making some advances but there's more advanced in some areas than others and one of those areas that over the last 40 years or so really have seen a lot of advance is our understanding of how space is represented because this is one of the first in mammals one of the first high order non-sensory non motor functions that that are really beginning to understood in in neural language in terms of how cells work together and how cells have different functions and how this is all put together to produce something that probably gives rise to our sense sense of location so I want to start very simply and now we'll go to primary school level and simply ask what what would it be like if we didn't have this ability to conceive of space and where we are in space so I have an animation that you made for the purpose not for this purpose but I will show this and that takes about two minutes and so let's begin with this now sound should be on world wait is sound on okay try again so this is suggest this positioning system from an ancestor what this system [Music] so where is this system well them many many parts of the brain are involved in space but there are still as we have learned earlier today there are two areas that have received a lot of attention that are critically in war involved in in in representation of space that's the hippocampus and it's the internal cortex it's just a point let's see yeah okay so this shows the human brain and this shows a rat brain this is all from collaborative work with manometer it shows the human brain in the red area which is embedded on the deep in cortex here and the blue area here is the internal cortex in the rat's brain it's located somewhat differently but very far back the hippocampus here and to rhymin cortex here and in these areas they have turned out to be important but because it is all much easier to investigate in in animals then a lot major advance was made about forty five years ago as you've heard already earlier in this meeting when John Okeefe and Janet and Ostrovsky started to record electrical activity or action potentials spikes from single neurons in the hippocampus of rats so this shows a rat that is walking freely in a box or it could be other types of a Pavarotti maysa but in any case what John did was that he recorded activity from single cells and viewdoze on on the screen or now oscilloscope and stored them and then found that single neurons in hippocampus are responsive to the location of the rat so I will illustrate this with a movie now we see the rat from a Bob that is walking in a box box is 1 meter by 1 meter in the box occasionally thrown out crumbles of chocolate which rats like that keep them walking around in the box and visiting every possible place and at the same time we are recording cells from the hippocampus you will hear those soon as spike sounds or noise sounds like noise but each time there is a sound popcorn sound then this cell is active and you will notice that this cell example cell is active only at certain places in the box so let's start to move it and each time the cell is active or fires you'll also see a red dot up on the screen so you probably already know have noticed that this cell is active on at one place in the box in this case in the upper left pot and otherwise the cell is very silent this can also be illustrated with a heat map a color code where red is high activity blue is low or no activity and and it turned out then during the years to come after this discovery that different cells have different preferred areas in the hippocampus and together it became clear that these cells cover the entire environment visited by rats and for this based on this data than John Okeefe and Lynn Adele suggested in 1978 that the hippocampus is actually the basis of cognitive map that or at old mania not view heard in the morning about Tolman's contributions a map that that encodes spaces locations in environment but also more than that also experiences associated with those locations this was a major conceptual advance put things together tied it up as you heard this morning a very chaotic literature so during the next decades a lot was learnt about place else but there were a few things that still weren't clear when we came into the picture after three months visit with John where he taught us all the essentials so when we started up in 1996 in our own lab in Norway there were several questions that were interesting but one on perhaps the most important one was which hadn't been resolved where and how is this place and signal generated because this remember this is not sensory cortex so these signals they they have properties that are as clear as you might see in sensory areas because they really strictly respond to the location of the rat but so you all know you don't have space sensors on your fingers not in your ears not in your eyes so how is this generated whether they come from so to a large extent this is probably generated inside the brain by the brain itself based on with the help of sensory inputs but this was really not well understood and one idea that was around in the 1990s was that if anything this signal if it wasn't created in hippocampus was at least enhanced quite significantly in the hippocampus and because the hippocampus operates to a large extent like a circuit the unidirectional circuit consisting of sub areas that project from one to the other in a loop through the hippocampus in through it and out then and most of the cells have been recorded in ca1 which is one of the last stages of the circuit then it was believed by many people at that time that essential things happened in the earlier stages just before the area where most of the activity had been recorded so knob vyas thing to do when we started out was simply just to do to try to get rid of the inputs from ca3 that that that was postulated to be so important and what we found which actually was in agreement with earlier work using other methods from from the McNaughton advanced lab was that a lot of the activity actually survived so this shows examples of seven different cells from a recording when the ca3 is inactivated Alisha and you can see that these seven cells this is a boxing from above and color indicates color indicates activity of the cell you see that these cells are still specially selected by still fire in certain areas and not in other areas so although the spatial firing was not strong maybe as it is in the control animal it was still not really noticeably different so that then led us to get interested in the entorhinal cortex an area that feeds in most of the cortical input into the hippocampus and by that time we had strength and connections with many victor who then participated in this study and was one of the world's experts on just this area and this work and we showed them here that with me know that this was the case that the trace signal survived despite in animals where there was absolutely no input from the ca3 left which we showed by using anatomical methods so that led us to the entorhinal cortex and tried we try to record directly from that area together with manual and with the students Mariana Fein and total hosting and we put in the recording electrodes into the dorsal part of the medial and renal cortex and this dorsal part is the area that has the strongest inputs into the dorsal hippocampus where almost all play cells have been recorded so it was an obvious area to go to but at that time in that part of internal cortex I don't think anyone really had recorded yet so it was new territory and what happened was and that cells in that area had a different type of pattern first of all they were very strongly spatially modulated so what you see here now to the bottom right is the box again now it's a bigger box in this case a 220 by 220 centimeter large box the great race is where the animal walked so shows the part of the animal over half an hour and each black dot is where that one particular cell was active when the rat was running around so what you can see is that that is so like other cells in the area was active in certain places but no longer just in one place or maybe in is active in many places and the other thing that you may notice is how regular this pattern is which you can see when you put these lines on top which I did in the left diagram here that is actually repeating triangle or hexagonal pattern that in many ways expresses a metric that was certainly not present in the place and signals of the hippocampus so apparently here we had another component of this spatial or cognitive map that contain information about distances and directions that were not so easily extractable from the hippocampus so this is now two thousand four five so one of the things that became clear from the beginning is that grid cells there are many there were many of them and especially they were abundant in the superficial layers of the medial internal cortex which project into the hippocampus but varied in various ways so they could have different phases they could at different scales or I could have different orientations relative to the environment so phases means that the grid patterns are shifted in XY space relative to each other so you see that illustrated here for a green grid cell and for a blue one and you can see that I have different the peaks of the grid pattern all at different places or they might differ in the scale which you see here with the blue one compared to the green one so you see the blue one has both larger fields and larger distances and the third is and that they may be tilted relative to each other as well so we asked them early on whether there is any organization according to these dimensions and both yes or no so first of all for the face of the grid there was no very striking organization or that that means that whatever we recorded on this illustrates our recording electrodes using Tet Rhodes which I don't have to explain how that I don't have time to explain how that works but anyway it picks up signals in a way that makes it possible to differentiate between cells and to isolate them from each other so here you have a blue cell rick green cell and a red cell and you can see that the grid patterns on the three cells all of them have grid patterns but they are shift in XY space and this is pretty representative of what you get in most places so that it is similar to what in sensory or visual neuroscience often is referred to as salt and pepper organization is pretty mixed what that is totally mixed that is still uncertain and there are various indications recently that there may be some organization to it or may also be not an equal distribution of faces but by and large every location is represented at every place every anatomical notion in location in the entorhinal cortex which is very different from the spacing of the grid because it was clear from the outset that spacing varied depending on how far up or down you are in the brain so this is a side view of the hippocampus and internal cortex hippocampus is this ear like structure here and the red structure here is the medial internal cortex if you start at the top which we often refer to as the dorsal part and then go down towards ventral or the bottom what we typically see is that it starts out with only a small scale grid cells that's not so small and very close to each other this is a box of 2 by 220 by 220 centimeters and the distance here is down to something like 30 centimeters between each node as you go down this increases and so you get into the middle here it may already be a meter or more and we go even further then it's difficult to assess because we don't have environments that are big enough or didn't at least at that time so there is a clear gradient of topographical gradient where it begins with the smallest at the top and goes towards the largest at the bottom so this can be organized in many ways but one important question was whether it is a continuous gradient well you go smoothly from smallest to largest or on actually discrete steps so does this depend consist of sub networks that each have their own scale and certain ideas about how grid cells arise actually require the latter so that we did look more into this and this is work with to 110 solar in about 2012 were able to record up to almost 200 grid cells from the same animal which at that time was quite unique and by doing so they were able to then plot the scale of grid cells from the same animal in in one diagram so what you have here is on the x-axis you have dorsal to ventral so top to bottom in the internal median internal cortex and then on the y-axis you have the scale of the grid or the distance between the peaks and then each dot is one cell and what you can see is first of all as I told you as you start from dorsal and go to ventral then the scale generally gets large and large and larger but what you also see is that it is a step like increase where what actually just a small number of scales present and almost every cell can be put into one of these steps so these steps we call them modules and we call them module one the smallest one and then module 2 3 and module 4 so it turned out they even have a certain relationship so that you when we asked what is the what is a factor that you have to multiply m1 with in order to get em to how much helium how to melt multiply M 2 with to get M 3 and so on turns out that it's actually a constant factor in this case under those conditions in rats it was approximately or on average the mean was one point 42 of course there's a lot of variation but still the scale factor is is the same so that you can actually describe the the levels of the of the grid cells or the modules or the grid cells as organized in like a geometric progression so and what's the advantage of that well that is still not clear but it has been hypothesis that leads by various people that that this might be the best way to organize grid scales if you want to represent space in the most possibly the most most efficient manner with the fewest number of cells so I want to emphasize at least one major difference between the place map and the grid cell map so we can go back to the place cells now you heard also again from the morning talks and also from Carol's talk that one property or place cells is that they remap as we say that means that you have that you have different Maps or different different combinations of play cell maps in different environments so we can also say that the map is high dimensional because it just what this means is that the maps are uncorrelated are as different as possible and this was shown already by starting with a mother and could be and and then has been developed by many labs over the years but I like to show this experiment that we did quite recently because we demonstrated effect in as many as 11 different recording rooms so here's a picture of eleven labs where rats were tested and I like to show them because those labs are so similar that I can't tell the difference in no way that I can say the difference between lab number n8 and lab number and two for example but the question is whether rats are able to so what shall not all in our lab did was that she recorded play cells many many play cells from the same rat sequence where the rat was tested sequentially in all these rooms one familiar room which has a label F and then ten different novel rooms where they were exposed for the first time label from N 1 to N 10 and then asked whether place cells in those rooms are they similar is it one map that is carried over or as we expected because of the their ability to remap from one room to other that they are uncorrelated so what what we found in this experiment is that all combinations of maps in all of these rooms or actually as difference as it is possible so what you see here is first of all maps from place else in this is cell number one cell number 2 3 4 and so and so on until cell number n and then they are correlated using a population vector approach and this is a correlation matrix and this is all the different rooms on one axis and all the different rooms on the other axis and then the Condor indicates the correlation between the maps and of course along the diagonal when you color correlate the room with itself you get a correlation of 1 so that's no surprise the same recording committed itself but on all other combinations you see that it's in the deep blue range which means essentially what you would get by by chance is absolutely not different if you just shuffle the data completely except for a very few places here which all are marked by a star on master risk and those are the instances where the room was actually repeated can the exposure to the same room and then so that shows that it's not just the fact that a new new map is pulled up each time but it actually the same is reexpress 22 to the environment but otherwise those maps or play cells are as different as they can be which is probably quite useful and what you want to have in a structure that stores memories including special memories for many many places you don't want to mix them up you want to keep them separate so this is in line with all the work that has implied a role for hippocampus in memory which we heard more about this morning so this is quite different from what we see in the entorhinal cortex because in the entorhinal cortex there is not this scrambling between environments so I'll illustrate is first again now the same type of approach you compare two different rooms this is roommate this is room B in one of the room it was a circle in the other it was was a square but anyway many cells were recorded at the same time in both rooms and then and then cross correlated so similar correlation between the maps for different environments and it shows the result for one two three four five six cells and the first row shows when you correlate the map with correlate the map with the recording in the same environment so a times a and of course you get the grid map because there's no reason why it should change and of course you also get a peak in the center because there's no reason why where the map should move but if you now correlate the a versus the B you also get a grid map except that the map is shifted slightly to the right in this case which means that the cell has the same pattern is just slightly displaced in one direction but the important thing here is that this shift is expressed in a every single cell that was recorded they all show the same shift which then means that actually here you have one map but it's just shifted in X or Y or maybe could be even be rotated but it's the same map say map and this is even the case if you put all the cells on top of each other and cross correlate them all together again you get the same map but just slightly shifted so what this suggests is that it's really just one map that is used over and over again at least as long as you stay within one of the modules so at that time we didn't know about modules and but they're still reasons to believe that most of the cells were from one single module so based on those data which is a study essentially all from study by a Malian F Finn in 2007 seven and in the collaboration with Alessandro Travis then we're asked more recently how much does this is this a single map that actually is expressed even when the rat has no behavior for example when it's sleeping and not walking around so this is a study that we did and actually has been shown the same result has been shown altering in Laura Collins lab where they did the same at the same time with exactly the same result so then I believe it so what we found and this is Richard gardeners work in our lab what he did was first to compare pairs of cells that were in phase that means that the grid pattern is more or less overlapping so you see two grid cells here and you can see that the peaks are more or less in the same place you can also see that from the collar but may be easier to see here so these are examples of T cells are fired in the same place when the rat is awake and walks around in the box and as you would expect if you cross-correlate those two cells in time so what is the probability of cell two to fire when cell one is active we get the strong peak around zero because when one side and the other files - that's all as expected but you learn record from the same cells in sleep in slow wave sleep you get the same peak so that means that those cells that fire together in the wake state also fire together in sleep and conversely if the cells are out of phase if they have their dots peaks at different places then on the fire out of phase in the wake state and they also fire out of phase in sleep so it's the same thing and if you do this now for 1267 combinations or pairs of grid cells what you find is that and you can plot that and in one line per cell pair and then now you can transform this one this plot to color so that yellow is high cross correlation and and black is low so what you then find is that those pairs that have the high cross correlation in the awake state when the rat is walking in this open field environment they are also the ones that have the highest in sleep and those that have the lowest correlation in the awake state when it walks in the box other ones that have the lowest correlation in in the sleep states and the same applies also when in a different type of sleep REM sleep which in humans corresponds to when we dream you say it's the same thing again a bit more noisy because there's much less data from that but what is essentially shows is that confirms the suggestion that that this entire map is really low dimensional or Express has only one or at least only a few ways to express itself very very differently from the hippocampal maps which can appear in all kinds of combinations and this is exactly as would be predicted by attractor type models for grid cells or models that propose that grid cells actually arise as a consequence of how the network is wired together and these connections and these interactions they are present also in the sleep State even if these animals don't walk around so with that I then that is a little bit of introduction about grid cells I should also mention though that there are other types of cells which already some of you may have heard that from the symposium earlier today and also was also mentioned in earlier but not the least the head Direction cells so head Direction cells are cells that fire in when the animals face is pointing only in a certain direction he cells were discovered by Jim ranked and then Jim ranked with a student Jeff Thurber followed up and showed them they found them originally in in the dorsal pre-super column which is adjacent to the dorsal medial and to Reiner cortex but it turned out them that they are very abundant also in the medial internal cortex so this shows again a side view in a rat brain and the area between the two red areas lines here is medial internal cortex and what you see here is that these cells they don't really have this grid dots like you saw in the other in the other cells but what I have as you see here in this is a polar plot that shows firing rate as a function of direction of the rats head you can see that this cell for example only fives only is active when the rat has its right head pointing in the left or west direction this cell is only active when a rat is walking from bottom right to top left so these are strongly directionally tuned cells some of them are very very sharply directional to others a little bit broader and some of them can also be head Direction cells and grid cells at the same time there are also other cells border cells we name them cells that fire exclusively when the rat is walking along one or several borders of the local environment so here again you see the box from the top color indicates activity or firing rate red is the highest rate and you can see an example here of a cell that fires only when the rat is on the right part of the box and that happens even if you stretch the box either in the horizontal or in the vertical or either in the X or in the Y direction still just fire at or a long that particular wall this shows the same cell in a different room so now the cell chooses the left wall instead and what you see here in the middle is that if a wall is inserted in the middle here then the cell actually fires along that wall - and on the corresponding side so on the right side here just as it does on the right side for the peripheral wall so this it's a very different type of cell a grid cell is never a border cell and a border cell is never a grid cell at least not in in our hands so different classes of cells and as some of you may have heard in the morning they respond differently to two sensory inputs visual inputs versus locomotion for example but these cells coexist are intermingled in in the superficial layers of the internal cortex and very closely shows associated also with head Direction cells which are also there but shift slightly more into the deeper layers and more cells that many which are actually you heard about some of you may have heard about speed cells this ourselves that don't really as you see that 12 example cells here they don't really have a preferred location of firing they the color code on heat maps here show that they are active anywhere in in the box but what line diagrams here show is that they their activity is strongly correlated linearly correlated with with the firing rate over the speed of the animal and that's also clear from the examples here seven different cells shown in different color on a background of the speed of the rat so the speed is shown in gray over it period of two minutes and then the color shows the firing rate of the cell and you can see for example if you focus on the yellow one here you can see how closely the cells firing rate actually follows the speed of the rat it's extremely closely tied to the to the speed so and the existence of these cells is also kind of predicted because the itself motion is necessary for updating these cells if these cells actually use path integration to to decide whether they fire then motion in self motion or speedy entities it's just a success essential as the direction input and finally there are many cells that actually have spatially localized firing fields that aren't anything really they're not borders they just blob so firing at particular locations of course there could be grid cells that for some reason either they have so so the large grid patterns as you just see one peak or the other grid fields are so low in rate that you don't see them but nonetheless they are hard to explain and there are many many of them they have been around for a long time but until quite recently at least I thought they were mostly just garbage heap cells that you couldn't really put into any category but changed my mind slightly when when when Chang Lee now in our lab showed that they are modulated in a different way than many of the other spatial cells so what he found which you can an example here is that if you block someone to start in expressing cells interneurons and you silenced them using kim from thermo genetic methods then what you find you see in the middle column here is that those cells under blockade of these somatostatin expressing interneurons actually have get much more dispersed firing and then when the drug is out of the body again then they go back to what they were so this happens only to these cells so a grid cell for example would not respond to that treatment and conversely if you block another type of internals per volume and type of interneurons then there's no effect on these cells so as you can see here but there is a very there is a strong effect on grid cells instead so seems like these are actually different classes or cells that are modulated separately so all in all this then brings me back to the movie where I started which suggests that that but these cells they're widely expressed actually they are present in many species they were found first in rats and came then in mice not surprisingly but then they were discovered in bats in the ulanovsky group and bats are on a completely different branch of the mammalian evolutionary tree and then grid cells or at least grid like cells were found in monkeys with Buffalo's work and then finally from Josh Jacobs and it's afraid in humans so the fact that they are spread around among mammals probably suggest that they arose quite early on our present widely among mammals so that applies not only to grid cells but it applies at least to several other types of cells like border cells and head Direction cells so that was my long long introduction but I did want to save some time for a few new things so one of the first questions and probably come up already - to everyone who is here who is not working in the field so may ask why do they only test these animals in these empty boxes because rats don't really walk in empty boxes in the natural lives so how about more realistic environments and realistic environments how are they different from empty boxes well at least they contain objects things in the environments so there is some precedence from other type other approaches that suggest that rats or animals may actually use objects for navigation and that includes both behavioral work and especially the work of incarnate which is illustrated here and just the five second version of it is that tested garbles in in an area which contains two landmarks the two circles here and then the X indicates the location where they could dig for food and they were tested over and over trained over and over and on this again but then on a test trial the two landmarks the two objects were pulled apart and then what they observed was that the animals did not search in the middle here but actually searched at a certain distance away from each of those objects suggesting that they actually encoded the distance and direction from individual objects to find the food and this together with theoretical work that was inspired partly by this and that includes the work of McNaughton and at all and Jim Kinnear was also on that paper which suggested that the must be cells in the the kampl system somewhere that actually respond to locations defined by distances and directions or vectors from from individual objects and the idea of vector encoding was also proposed by O'Keefe and Burgess based on their work but they suggest that it was walls or LAN walls or boundaries that that were used by animals to encode positions in the open space so the idea was there so based on this and even hurdle who's a PhD student in our lab recorded from mice when these mice were running around in very simple environments like the ones we have seen already but there was now an object a very prominent tower-like object in the environment and it turned out that every eye actually indeed very many cells that responded to the location of the object they did not fire at the location of the object but they fired at some distance away from it in a certain direction and such a cell and example cell is shown here you see it has a one single peak of one single aerial firing and that area is displaced from the object in a certain direction so the typical design is like this starts out with no no object trial there's no object in the circle environment then an object is introduced somewhere near the middle and then the object is displaced and what he see is like in the two example cells as shown here is that the cell starts to express a strong field strong area of activity at a certain place defined to the object in this case on the north side of the object some twenty thirty centimeters away then the object is moved so in this case in object is moved down you see the white circle here and still the cell files some twenty thirty centimeters north of the object and the same thing what is shown here and that can be plotted so you could plot the firing rate as a function of distance from the object and the orientation of the object and you can measure that on trials with objects in different places and then you find for these cells that I have that they have correlations between those two trials that are way beyond what you would expect by by chance so how is this how are these object vector fields distributed so this shows just data from from a part of it there are actually many more cells now since I had this figure but what you get here is still the point this shows one line per cell and color indicates firing rate and this shows orientation relative to the object and what you can see is that essentially all orientations are expressed if it was perfectly distributed you will have a line along the diagonal here so this is the distribution of orientations a slight bias tree was 90-degree cycles but actually that bias has been almost gone now in the larger dataset this shows the distribution of the distances so you can see typically firing field is about 5 10 15 centimeters away from the object but it can be anything up to 45 probably more than but we couldn't test beyond that because the environment wasn't really larger than that if you wanted to have the object in different places it's not dependent on the exact type of object so this shows 13 different types of object so many of them quite similar they are tower like that could be prisms or they could be cylinders but looked quite differently and if you then use several of them or replace them it doesn't really matter so this is shown here for five example cells so you can for example see cell number two here responds in the same way to two objects placed here so there are two circles you can see it files on the left side at a certain distance away from each of the two objects so you can also see it here and this cell three different objects among this and again on the southeast side of each of them and this one here you can even construct a grid cell if you like because if you put objects in a certain pattern you can get fields on the in this case on the north is north west side of each of them so this suggests that it's not really the identity of the object that is encoded but more like positions and actually vectors directions and distances away from any prominent object in the environment and that even includes some that are very different like the flat cylinder here and even a wall like this so these cells is something that has to be learned while it turned out not to be because these cells that were recorded multiple times in familiar environments they were also tested in a novel environment novel room with a novel object and you can see that you get the same exactly the same type of firing both in the familiar and in the normal room and their own if anything just very very minor differences in the information content or in how special is selective they are so I mean I also wonder if is the intrinsic relationship between different cells of this kind maintained so what you see here is to simultaneously recorded cell so one has a field on the southeast side and one has a field on the northeast side in room a and if the right is then recorded in room B well then it all rotates for this so this one goes or flips almost 180 degrees and now you see that the file field is on the northwest side and this one also then flips by 180 degrees almost and the same happens to a head Direction cells that's recorded to the same time so this suggests that actually the insuk relationships between these cells and even between these cells and other directionally oriented cells are is maintained between environments so again this is part of the low dimensional analogy of the internal map where both grid cells and head Direction cells which I didn't mention actually turn out to be more or less one map that is maintained across environments so are these cells different from other cells like grid cells well largely yes so we calculated scores for both border cells and grid cells and speed cells and Direction cells using different criteria that we have used previously to identify such cells and essentially what you can see here is that that for example grid scores are around zero that means that it's not different from what you would expect by chance and also for the head Direction tuning it's what you see in the middle column is the object vector cells when there's no object and then to the right you see an object vector cells when there is an object present and what you see in the left column here or the left one is it's the rest of the cells so it's not really different from the population so no head Direction tunings low grid tuning and not really definitely not more border like activity than border cells however yeah I'll skip this but however there is some overlap with border cells and that may be not so surprising because I'm border is also an object so I mean how you really distinguish those because a border is just an object that is elongated in one direction so when does a border become an object and when does an object become a border I think this is it's not totally obvious where whether the boundary is so but using the criteria we have used to identify both object vectors and border cells and we do find that there's a small subset 11 out of approximately under 50 cells that actually satisfy both criteria and you see some examples over here so if you look at the bottom first you see a typical borders and recorded with no object present then the object is introduced here and this in the middle you see a white dot here and then the cell adopts a field on on one side just like it helps for the border and here at the bottom you see another cell of the same type which files along the border of this cylinder and then when you introduce the object in the middle here you get another field as well but many many don't most actually don't so you see an example at the top here where there's no object it's a border field along one border here and then you also see that in the net neighboring cell or in the one below here and you introduce the object and nothing happens so what is the difference between these cells it's not quite clear but there are many many things that suggest they are not just they are not object vector cells are not just border cells that in they are different in many ways so what we show here is that this shows just the relationship between the orientation of firing of yourself so this is the direction of firing relative to the border so this is for the border cells and you can see that they essentially line up along the orientations of the walls as expected but when it comes to the object like two cells which you see here to the right they have all kinds of orientations and the same with the distance from the object versus the wall so this shows this shows four border cells so this shows the orientation of the object vector field versus orientation of the border field for those cells that had fields impulse and you can see there is really no correlation you would expect bands along the parallel with the diagonal if they were and they'll feel distance so this is the distance from the wall or the border this is the distance from the object for those cells that filed in relation to both and you can see that the distance from to the object is much larger so this could be because of the way the cells are defined but nonetheless they are different in many ways so then to try to tidy up in that then we have an ongoing work work which is the busting undersells worked where he tried to manipulate the shape of the objects to make a more-or-less border like so first of all he tried to ask whether it's the hate of the objects that matters so we had small objects and then big objects and then put them in different same place in the same environment and then could see that if they're very very small sometimes they don't elicit object vector fields but consistently as they get larger and the same when he changes the width of the objects so this shows anything from about two centimeter with to 30 centimeter width and you can see that the cells fire in the same orientation in the same way regardless so and he even tried to morph the objects from what we call an object originally to a border or a wall like you see the object here getting bigger and bigger and bigger and then going back so essentially the cell fires all the time but this cell which clearly is an object vector cell by definition as as we had it still doesn't even it files along most of the wall here it never files along the peripheral walls so I think these cells there have many properties that distinguish them although it still is yet to be finally determined what is the difference between an object and on the border so finally before I leave this topic I just want to say that these cells have some similarities with cells that have been recorded before so first of all I want to mention the object cells not of object vector cells but the object cells of the Lateran to run a court which gin-clear him and his students have observed for many years but these cells essentially fire at or around the object so they are different in that sense but the object vector cells are more similar possibly identical or these more similar to what they call the landmark vector cell in the hippocampus which are cells that also fire displaced from the object so this shows four objects and this shows the firing fields which are in this case on the south east side or to other objects but they are also different in some ways like for example many of them fire only in relation to some objects and not others and as I understood it also took quite a while for many of them to develop whereas the ones in internal cortex are expressed from the outside so and finally just to sum up again and come back to where I started with these cells so these cells they suggest them that the internal middle and trynna cortex may encode position in several ways not only by a metric defined by a regular grid but also by actually using completely different principle a vector based principle based on locations relative to to two objects in the environment individual objects in the environment so and then I promised to come back at the end to another dimension time which is we heard in this morning that especially from Lin Modell's talks that hippocampus is very important for episodic memory where space has an absolutely essential role but space isn't all there is also in episodic memory a time component and our understanding of how time is really encoded has not been at the level of our understanding of space so this is the work of Albert Hsiao who was a PhD student in our lab and it's also collaboration with the kiram lab which are contributed some of the data this will be presented in more detail tomorrow in a symposium so I don't want to steal the whole show from Albert so I just presented very briefly and put it into context and I'm hopeful many of you will find an opportunity to listen to Albert himself tomorrow but let's put it in some background so how what do we know about encoding of time in the hippocampus at least to two aspects that is worth emphasizing first we have the so called time cells which are cells that were described initially by postal cover at all from bushwalking lab and then followed up more extensively by by series of studies from the icon bomb lab which showed that when this is the original task when rats run in a certain pattern like in a figure eight pattern like you see here and then in stop in a running wheel to run for delay until they continue to run in the maze again then during that delay the cells actually fire at certain times in the interval so this is plotted here by a new number one two nine thirty here and then you have time in the wheel on the run and what you can see is that these cells fire at specific times during the interval and that it's a very orderly firing just like cells fire orderly in space when rats for example run on a linear track they fire in a certain order when they're on on the wheel even if they don't move at all so it is not it's not and this even happens when when they control for movement so so this was proposed then to show that hippocampal cells can actually also Express time the very cells saying terms that express space in other contexts so this so-called time sells there's a lot of attention to that now but nonetheless these cells this is described across timescales of not much more than ten seconds a little bit more and probably this also has to be launched but then there's a totally different expression of time in the hippocampus so going first back to studies again by I can bomb where they showed in this is a study from 2007 where rats were trained in you know auto sequence memory tasks but the essence of it is shown in this figure so this is the trial lag or the distance between trials and on the y-axis you have the differences in the population activity and what you can see is that regardless of where they actually find their food the distance increases with time so there is slow there's a change in which cells are active at any given time in the hippocampus that could be an expression of time and then worked from Jillian Stephon nightcaps lab and also started from Seattle in weather when he was at mark schnitzer showed that in c1 this is strong yes but is even stronger in in the CA to the area of the hippocampus this is where we were when albert saw started but we wanted to find out more about this and also where it came from and try to understand how such a code is expressed outside hippocampus and we we then directed our attention to the lateral internal cortex which i haven't talked much about at all today but where cells are not really very strongly especially selective as was shown by jim theorems about the same time when we found the grid cells but we wonder whether much of the activity of and lateral internal codex could actually be explained by a role in coding of time so what Albert did was that he tested rats in a sequence of trials extending over a period of more than one hour so going from alternating between two types environments so it's a black environment and a white environment that means that the balls are either black and white otherwise totally similar and then alternating in a semi random sequence from over a series of 12 trials and then in between the resting trials or post trials so that total is 24 different recording epochs as I said total a little bit more than one hour and then he asked how its activity or cells in the lateral internal cortex during recording in over this time sequence and first of all he did find some cells in the lateral internal cortex that are strongly modulated by time that means that their firing rates change in various ways across the across the experiments and this is not due to instability of the changes of the cells because he showed in many ways that is totally totally stable but the cells you see the activity of the cells shown here for four different types of cells this is across the alternating trials or sessions or black and white trials and what you can see here it's made a little bit difficult to see but in this sense ramp either up or down within trials as in this one so firing at begins low and gets higher and higher and higher the next trial begins long goes higher and higher and higher and so on or it might have activity that could could ramp up or ramp down over the whole one hour or one hour class session or you may have combinations where the activity ramps up or down just in certain just in the black boxes or in the white boxes and so on so based on this he then performed general linear model analysis GLM and identified the fractional cells that has significant modulation by the various factors that he put into the analysis which included the color of the wall black or white the position of the rat or the combination of the two or time or mixtures of them all and what he found first of all if we begin at the bottom with the medial internal cortex and with the ca3 not surprisingly there's a very strong influence of positions you can see both here in the middle internal and also to some extent in in ca3 of course not much in lateral internal cortex when it comes to the color of the wall quite low in all of them but some in ca3 and in the latter and run a cortex but when it comes to time I say that possi Etrian and the middle internal are quite low but when it comes to the lateral and to renal cortex it's a very high proportion that has significant modulations about 25 to 30 percent that past that significant threshold doesn't mean that the others don't but they may have weaker influences but then under the c1 and c2 they are somewhat in between but none of them really reach the level of the lateral internal cortex but any Austin while these are individual cells but could it be that those cells that don't pass the threshold perhaps also contribute to the coding so it took a totally different approach them uses looking at the whole population instead and use them machine learning approach or linear support vector machine to to determine the contribution of time for the three areas lateral internal cortex III and medial internal cortex so what he did was that he trained the network based on on he chopped it into ten blocks and then trained it online and then used that to predict that for the tenth one as a test case what time this actually was recorded in across those blocks of twenty four egg box and the success of that shown here so this is in this confusion matrices here so what you have here on the X and y-axis is the predicted attack on the horizontal axis and the actual Epoque on the y axis and then color indicates the proportional hits and you can see the strong almost everywhere every case is is a hit here and very very few were actually miss hits so he could almost all the time predict when the recording actually took place this is not the case in CA three as you can see here and just weekly the case in the middle and triangle cortex correlate corrected for populate for size of the sample don't want to go into that and this is also it was not only able to predict epochs or blocks of trials it could even go within trials and predict the right twenty second block or even ten second block or even one second I mean of course we had much lower success if it was one second but it still you see the step in line here at the bottom that's the chance level so it actually means that this representation of time was present at multiple time scales finally then one could ask is this something is this an internal clock that is present in the lateral internal cortex so this is a clock like thing that goes on regardless of what happens or is it actually dependent on the experience of the animal and it may turn out to be the latter which I will show in this final data slide which again now it's a new tripod task the rat is not walking in the open field box like he did before but now it's running in a maze in a figure eight pattern so alternating left and right or maybe second trial what he found in the tasks and also in one other task where where the animals just run in a circle over and over and over and over again is that in those tasks if you then decode the identity of the trials which trial recording was from actually the success is lower than it was in the open field so it's much reduced in those 2000 figure 8 tasks and in the circular track was compared to the task when the rat was what working in the open field and you can see here there's very little activity really very little few hits along the diagonal here but what was the at the same time as this was lower social implication has lower in in the success of hitting the right try and whether it was trial number 5 or 7 or 9 when it comes to when in the trial the recording was from then it's reversed so what he did was either he chopped up segments each time the wrath past a certain point on this track and then he did that for every lap that the rat went through and through and through and through and then he asked is this from an early one or an late one in that trial then the success is actually reversed so now when in this task the Heat success was much higher than it used to be in when the rat was running freely in the open field so this then suggests that the encoding of time in the lateral entorhinal cortex is not a fixed thing it depends on the experience that the animal has and this network the representational time can actually be adapted to what the animal experiences going from a kind of absolute in quotation marks representation of time that is just running freely to one where you actually encode time relative to some temporal landmark like for example the start of the trial or passage of a certain point on the track and that then brings me back to the person who introduced me who was so Mike was kind enough to allow me to show one slide from his own date asking for him because Maria Mancha from his lab has done work Newman's human fMRI studies where they actually find that have data that are entirely consistent with the data from the and lateral internal cortex in rats so what they find very very very very briefly summarized is that they let subjects new a movie a famous TV thing that I have never heard about but the point is that after the movie they were asked to put on a timeline when still for a still image from the movie was shown was this early or later whenever and then they could measure how well they hit and hit rate was actually very highly correlated with activity in the lateral internal cortex no correlation with medial and also high the Carolina cortex not with a part of which imperial is very strongly linked to the lateral and to run on cortex so this I think this is those two sets of data fit very well together and with that I think I come to the conclusion so these are people from the Institute and from the lab as Mike mentioned might be from also participated in all of it there are also other people who have listed Heather so many can't really mention them but put a new work I would again then mention Albert's South role and who is going to present it tomorrow and also for the object vector cells especially even and also the more recent work Sebastian under some so with that and a lot of people pay for this a mewling sponsor the lecture so with that then I'm done and thanks you for your patience sitting here so long and I'll hope you'll have a nice evening [Applause] [Music]
Up Next

How Grid Cells Map Space in the Entorhinal Cortex | Moser Research
@NTNUUniversity
21.2K views•2011-01-25
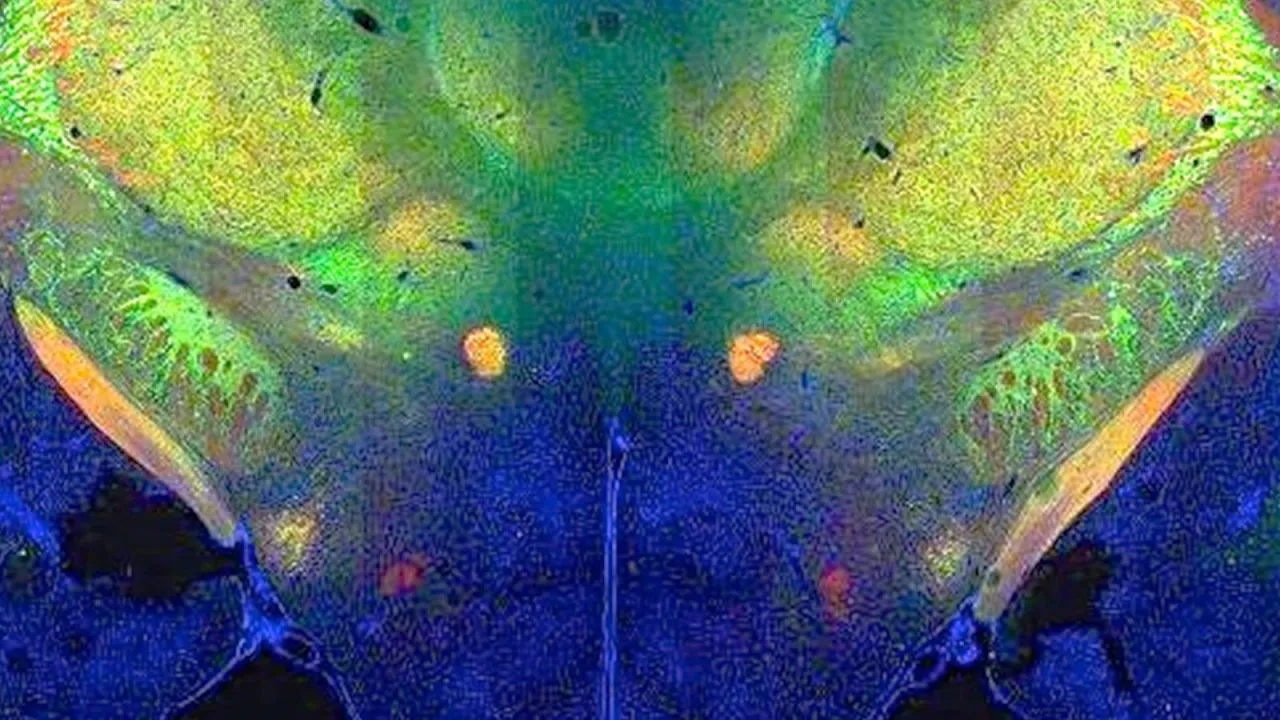
Deciphering Neural Circuits Controlling Anorexia in Mice | Richard Palmiter
@AllenInstitute
2.3K views•2011-10-10

Vagus Nerve (CN X): Anatomy, Nuclei & Functions Explained
@Alilamedicalmedia
305.2K views•2022-10-31
How Exercise Benefits Your Brain: Science Explained
@TED
11.4M views•2018-03-21
Related Study Plans & Knowledge Roadmaps
Structured learning paths in Neuroscience