




















Inductive loops observed in high-frequency regions of Nyquist plots during EIS analysis of screen-printed electrode biosensors are primarily mathematical artifacts rather than physical phenomena; they arise because inductors are the only circuit elements that exhibit a direct relationship between frequency and impedance (impedance decreases as frequency decreases), whereas capacitive elements show the inverse relationship. These loops can be modeled using a three-tiered circuit configuration consisting of a resistor-capacitor element, an inductor-resistor series combination, and a Randles element with Warburg diffusion, allowing researchers to extract meaningful electrochemical parameters like charge transfer resistance and capacitance for biosensor characterization.
EIS Circuit Fitting of Screen-Printed Electrode Biosensor with Inductive Loop
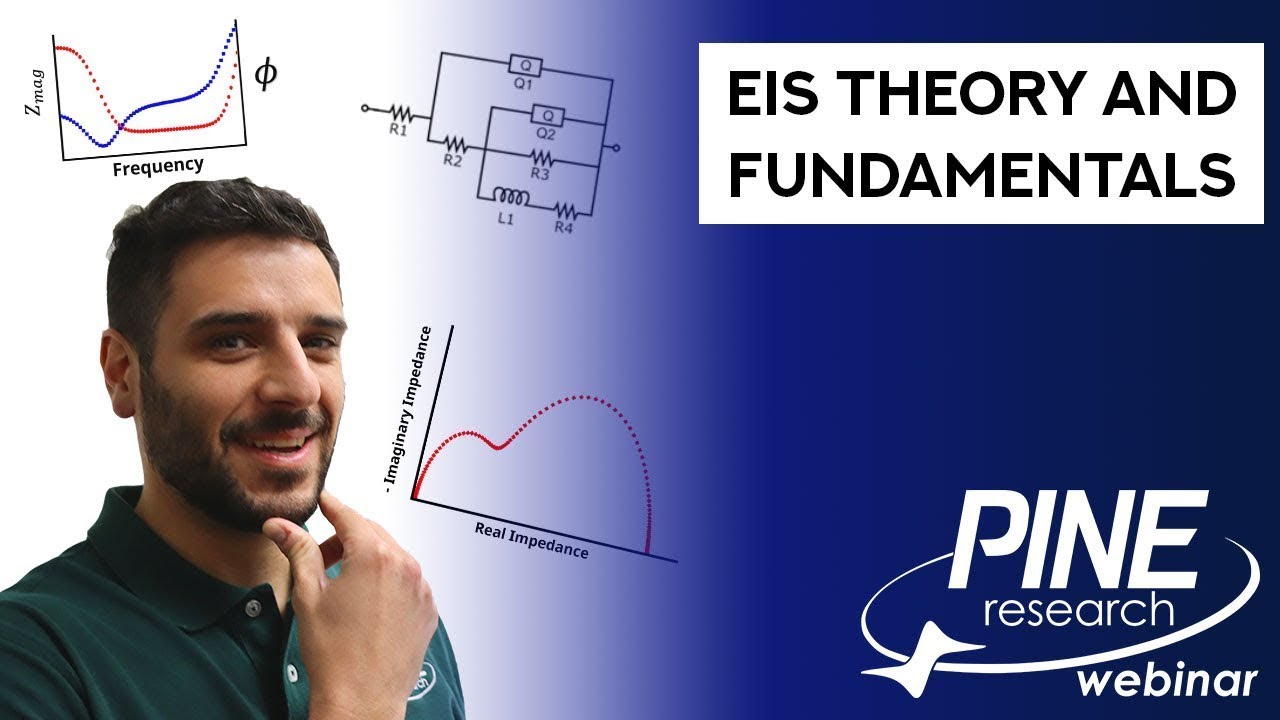
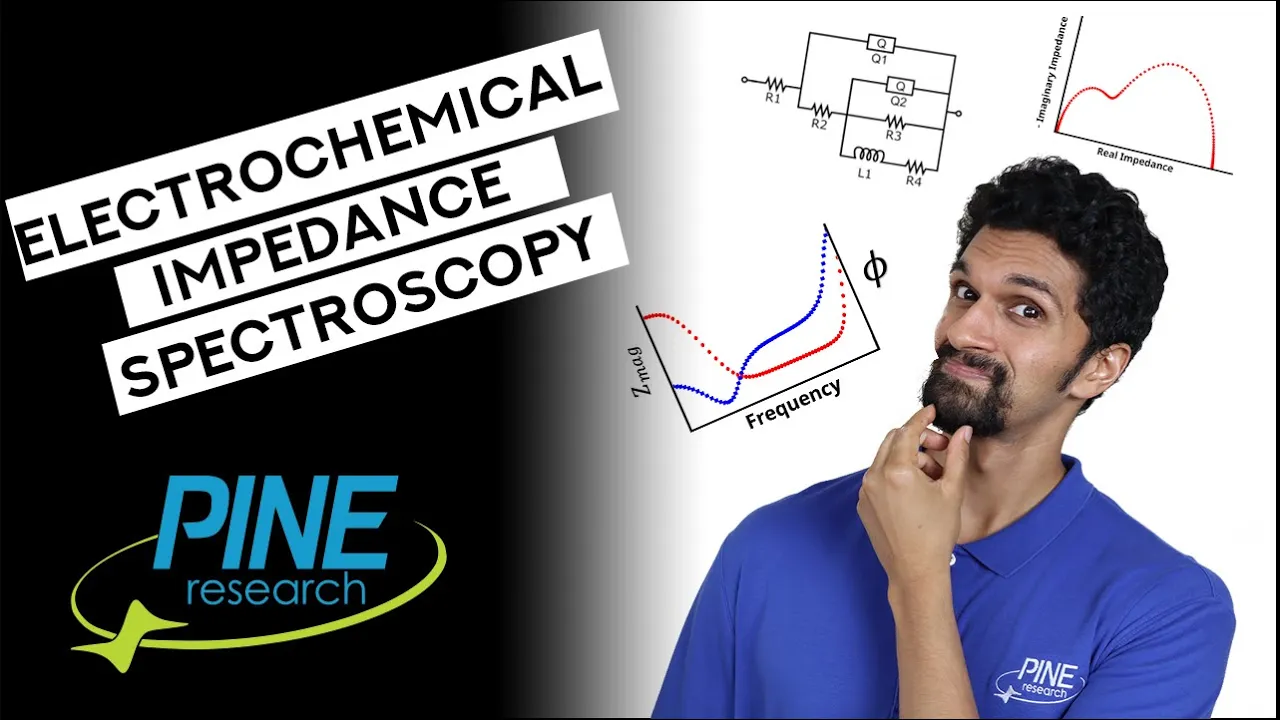
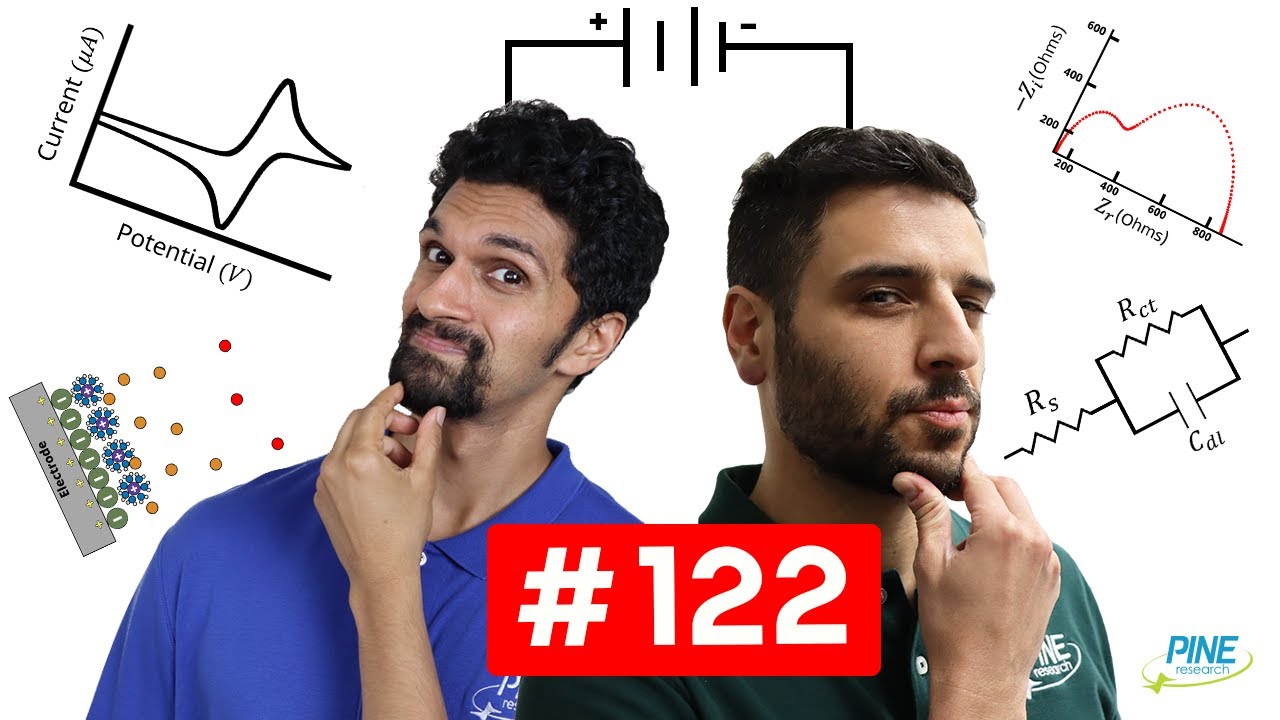
Added:[Music] hey folks in this video we're going to be talking about electrochemical impedance spectroscopy of a screen printed electrode biosensor this is based off of eis data submitted by you the researcher as part of an advanced eis webinar series led by my colleague neil spinner if you're interested in future webinars from pine research instrumentation go to pineresearch.com and stay tuned for more this video is broken up into several sections first we're going to discuss the electrochemical system itself the screen printed electrode biosensor and its different stages we're then going to look directly at the eis data specifically looking at nyquist plots that contain an inductive loop we're then going to discuss what this inductive loop is and then we're going to move into eis circuit modeling of the system timestamps are in the description below and lastly before we begin please don't forget to like comment and subscribe person submitted their data and they were studying a sensor of a modified screen printed electrode or carbon screen printed electrode so an spe or spce and the full disclosure again similar to the last data set is that i've done my best to learn and read and represent appropriately this person's data but i am not a an expert on biosensors by any means and so i will certainly just do my best to describe the process going on here but if any of you do study sensors you may certainly know more than i do about these kinds of processes or how they work and as i understand it this is used for detection of biomarkers for diseases is the field and so there are four steps and five states where impedance was done so the first state was just on the naked bear spe the first step was treatment with this compound which is paba or para aminobenzoic acid with a chemical electrochemical step and the second that leads to the second sort of stage which is this paba grafted carbon screen printed electrode the next step the second step is treatment with this edc and nhs chemicals that creates the third stage which is this carboxylic nhs ester grafted or the word activated is used for this stage of the electrode the third step leading to the fourth stage is involves the attachment of a particular ligand which i believe is essentially some kind of long chain nitrogenated hydrocarbon carbohydrate some kind of organic material that is is the um almost like the the fingerprint for the biomarker so you would you would attach a different ligand depending on what you're trying to sense uh for for your different disease biomarker i believe and so now this is this activated grafted with a ligand and the final step that leads to the final stage where impedance was done is treatment with bsa which uh as i understand is uh bovine serum albumin which is some kind of protein that is used to i believe attached to active sites and it actually blocks active sites on the electrode and that i believe in turn improves the selectivity of the um the biosensor so the last stage is this activated ligand plus bsa and so the reason this person submitted their data was again to try and ask what circuit model should be used to analyze the data but the primary question was with respect to this inductive loop that was observed at high frequency so i'm going to get into the data here and what i'll do is i'll first show the first three steps because i'll just give away the answer that this high frequency inductive loop showed up and the last on four and five the last two so i will somewhat quickly go through the circuit fits for stages one through three and i'm not going to give too much analysis because i want to try to focus on that high frequency inductive loop that was the interesting feature for this data so the first naked spe data you see pretty standard kind of semi-circle with a little bit of a diffusional tail a little bit of drift going on for sure probably just from some diffusion some normal kinds of drift perhaps at low frequency um this fit is pretty standard i can just increase this cpe and i get a decent fit i could probably iterate this more and get a little bit of a better fit maybe two randles elements etc but for for these purposes now this is this is adequate the paba grafted data was mostly just a simple randall's element in fact it just looks kind of like a single randal's element and then there was a little bit of noise at low frequency for sure you see that the kramer's chronic doesn't fit this portion too well so i wouldn't expect the circuit fit to really fit the end very well either but it just kind of looks like a simple uh randal's element almost like one semi-circle and so this is probably good enough honestly for this fit the third stage was a little more interesting actually the uh graft activated with this nhs ester you see a little bit of drift at low frequency but for sure more things are going on here it looks like we kind of have one two three and a half randall's elements and so the circuit that i fit for this would be just that i would have one two three randall's elements with an extra cpe or almost like warburg element for diffusion and so uh the same kind of circuit fit can be done here where i lock all of the alpha values at one and do my calculation and then unlock them and probably need to increase the range for one of these yep this one is hitting its maximum limit so i'm going to increase that range and get that see if this fit will lock into place and you can see that it looks pretty good i could probably iterate a little again on this part it's it's kind of not quite fitting also this angle seems like it's a little bit too high this needs to come down a little bit i could probably decrease that 0.5 that alpha there but anyway for now this is this is adequate um and i'm gonna get to the interesting data if you will so steps four and five again were the ones really of interest and on a large view you see it kind of just looks like a semicircle with diffusion almost basically just something as simple as that but when you zoom in at the higher frequency you see this loop so some of you may be familiar with this kind of phenomenon or you may have seen data like this or you may have data this yourself this loop here so what's going on with this high frequency loop so it's an unusual feature and it can occur at high or low frequency um this kind of a loop um in this case it's at high frequency uh and and i say it's unusual and the reason is not because it's just a i don't know a strange looking thing i say it's unusual because we for the most part i don't think anybody really knows why it happens um and that to me is unusual you know you would think that people observing the same feature over and over again someone would be able to find the conclusive evidence but that's you know the joy of science sometimes we don't always know uh for sure and so um i've i've kind of scanned literature and tried to find as much information on this circuit as i can and as best i can tell these are some of the explanations that people have provided for such a loop or such an inductive feature is that something like a passive film formation relaxation of species or transients absorption of species like oxygen or water for example like water uptake water absorption or things like corrosion or pitting and that is typically seen at the lower frequencies so perhaps you know maybe not at the higher frequencies i'd expect that more at low frequency during my five-part webinar series i discussed this phenomenon as well in this circuit which is usually represented with this kind of three-tiered um circuit that has almost like a randos element with an inductive um and an inductor in it and the value of this inductor is often meaningless so i'm going to get into that as well and why i say that so let me point out something about all impedance data for the most part first and so if i look at this this data here and i sort of take a a step back a wide view of my impedance data and this is almost true for for basically all impedance data on my nyquist plot if i draw a line from the origin from 0 0 to any point i have an x component which is the z real and a y component which is the zi the vector distance from the origin to any point is equivalent to the impedance magnitude now now recall for a nyquist plot as i go from left to right or i basically go along you know the nyquist plot my frequency goes down and what we see is that my impedance goes up and so this is fairly universal for almost all um data sets you're going to get in impedance is the nyquist plot goes this way which just means as frequency goes down impedance goes up and this makes sense because almost every uh system involves capacitive elements or is dominated by a lot of capacitive elements especially as frequency drops and so capacitors as i mentioned previously have an inverse relationship between impedance and frequency so as a result this behavior is pretty dominating however if i zoom in on this part with my inductive loops i get a you know a different trend and so looking at it through the lens of what i just mentioned in terms of the vector and that distance being my impedance magnitude what i can see is that as i move along my nyquist plot i go from some value to a lower value these points are getting closer to the origin and then they get farther away so for some period of time i have the reverse trend as the frequency drops the impedance also drops and then as the frequency continues to drop it goes back up and so the reason why you have to use an inductor is almost purely mathematical it's not even really physical it's mathematical because if you recall again as i've been saying a capacitor and even for that matter a warburg element a garisher element almost every element that you use to fit your data has the situation where as frequency goes down impedance goes up the only one that behaves differently is an inductor an inductor has a direct relationship between frequency and impedance as it goes down for impedance goes down so that's why inductors is needed and and it's it's interesting to me to think about this because almost all the time and i've said this in my previous webinars you want to try to use models that have physical meaning just like i did in the previous example i showed randall's elements applying to interfaces well this is almost the exact opposite i'm i'm applying a model that doesn't necessarily have physical meaning it's just an inductor to make this loop happen but i'm doing it because i want to fit the rest of my data i want to get a value for the you know resistor and the capacitive element of the rest of my data and so to do that i have to fit this part and so to do that i need an inductor so that's kind of a roundabout way of saying why i need to use this inductor so now i'm going to try and fit this data and show you how that works so essentially what i want is a leading resistor and i want to make this sort of three-tiered element where i have my resistor and my capacitor or my cpe and then i have my inductor and resistor in series and then i have my i have like a randall's element with diffusion that's in series after that so that's why this is a little bit of a tricky model because it's not just this um you know this inductive loop kind of model i also have that randall's element and diffusional element coming after it so it's it's a bit of a complicated model and now what what you'll find possibly when you do this fitting in software is that sometimes that loop can be kind of hard to fit it doesn't always software doesn't always do the best job at that i'm going to see if my my normal you know fitting alpha here will will get a decent fit on that loop and right away you can see let's see if it got it so it does seem to have captured that loop which is quite fortunate it's not always the case where the loop will show up right away um so that's that's that's really pretty nice that the software was able to get that and in the case where the software doesn't capture that loop the most common thing you need to do is to adjust the ratio between your inductor and your cpe in that three-tiered model so this q2 and this l2 or this l1 and this q2 you can see that if i change that ratio for example i can make that loop kind of go away so just the ratio of those two elements is what kind of determines what and how much of that loop you know i'm gonna have basically so uh but again the main you know benefit to this this model is that i've got a fit for the rest of it so i can you know theoretically get a value for like the the the capacitance and the resistance of you know uh the rest of my of my data and that that's that has a lot of value to it so now i'm gonna do is i'm gonna take this fit and i'm gonna apply it to number five as well to try and get that last data set and see if i can get a fit for that loop as well and let's see if this can get a good fit so it appears like it's it's not quite matching that cpe there so i think what i probably need to do is adjust some of these parameters one of these one of these cpes is probably not quite you know right or one of these resistors needs to be adjusted to get that behavior that i'm looking for so that one doesn't seem to be the one and if i mess with this one that seems to get that behavior see now i'm getting kind of that shape that i want so let's see if this kind of locks into place yeah there we go that seems a little better and let's see if i zoom in i want to make sure that loop is still here so okay that loop is here but actually the other thing is i see it's it's kind of there's a little bit of noise at high frequency in this data set so i i'm gonna try unity fitting sometimes i just have a hunch if you change unity or parametric sometimes it'll be a little better sometimes a little worse i i think that fits a little better i would i would probably you know you could exclude the first maybe four or five points possibly if those are just scatter but overall i've got that loop kind of behavior fit and i've got the rest of the data fitting as well so again same sort of concept i'm just using this this inductive element to be able to fit the data um as accurately as possible and then as a result i should be able to get values for my you know charge transfer resistance and my capacitance for the biosensor and that's you know a pretty useful useful thing to be able to do all right folks i hope that you enjoyed this video please don't forget to like comment and subscribe and i'll see you soon
Up Next

Cyclic Voltammetry Explained | Electrochemistry Basics (Emily Penn) - YouTube
@chuehgroup
387 views•2020-10-29

Biocatalysis and Catalysis in Islatravir Synthesis | Merck Webinar
@SCIwheresciencemeetsbusiness
675 views•2020-10-08
1H NMR: Determining Number of Peaks from Structure
@MSJChem
59.2K views•2017-04-06

Edible Water Bottles: A DIY Guide to Sodium Alginate Spherification
@ryan
10.5M views•2019-06-21
Related Study Plans & Knowledge Roadmaps
Structured learning paths in Chemistry