




















FastQC is a bioinformatics tool that analyzes raw sequencing data through multiple quality control modules including per-base quality scores, per-sequence quality distribution, base composition analysis, GC content profiling, sequence duplication detection, and contaminant screening to identify potential problems in sequencing runs and guide data processing decisions.
FastQC Tutorial: Sequence Quality Control for High-Throughput Data
Added:Fundamentals of Next-Generation Sequencing (NGS): Basic understanding of high-throughput sequencing technology (such as Illumina) and how raw sequencing reads are generated.
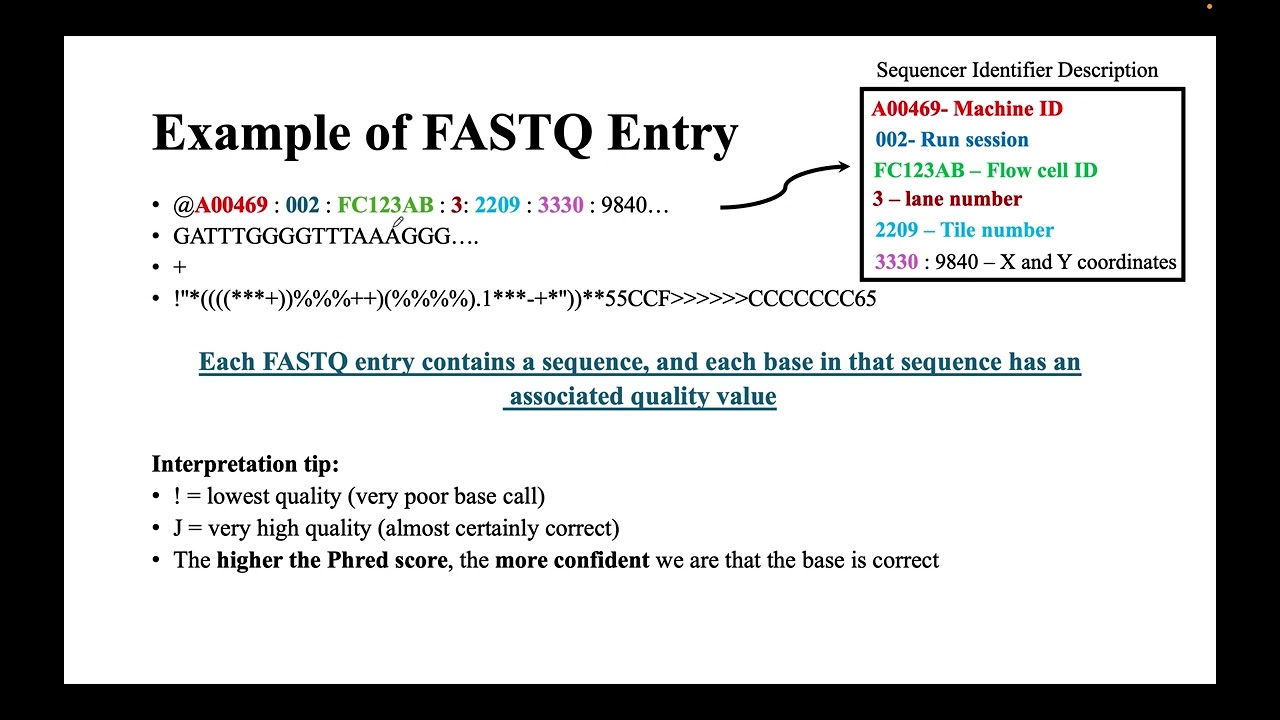
The FASTQ File Format: Familiarity with the structure of FASTQ files, including sequence headers, base calls, and quality score encoding.
Phred Quality Scores: Understanding how sequencing quality is numerically represented (e.g., Q30) and what it implies about base-calling error probabilities.
Basic Biological Sequencing Artifacts: Awareness of common issues in sequencing library prep, such as adapter sequence contamination and GC content bias.
Read Trimming and Quality Filtering: Utilizing tools like Trimmomatic, Cutadapt, or fastp to clean raw data based on FastQC diagnostic results.
MultiQC for Aggregated Reporting: Learning to combine multiple FastQC reports into a single, cohesive summary report when analyzing large-scale datasets.
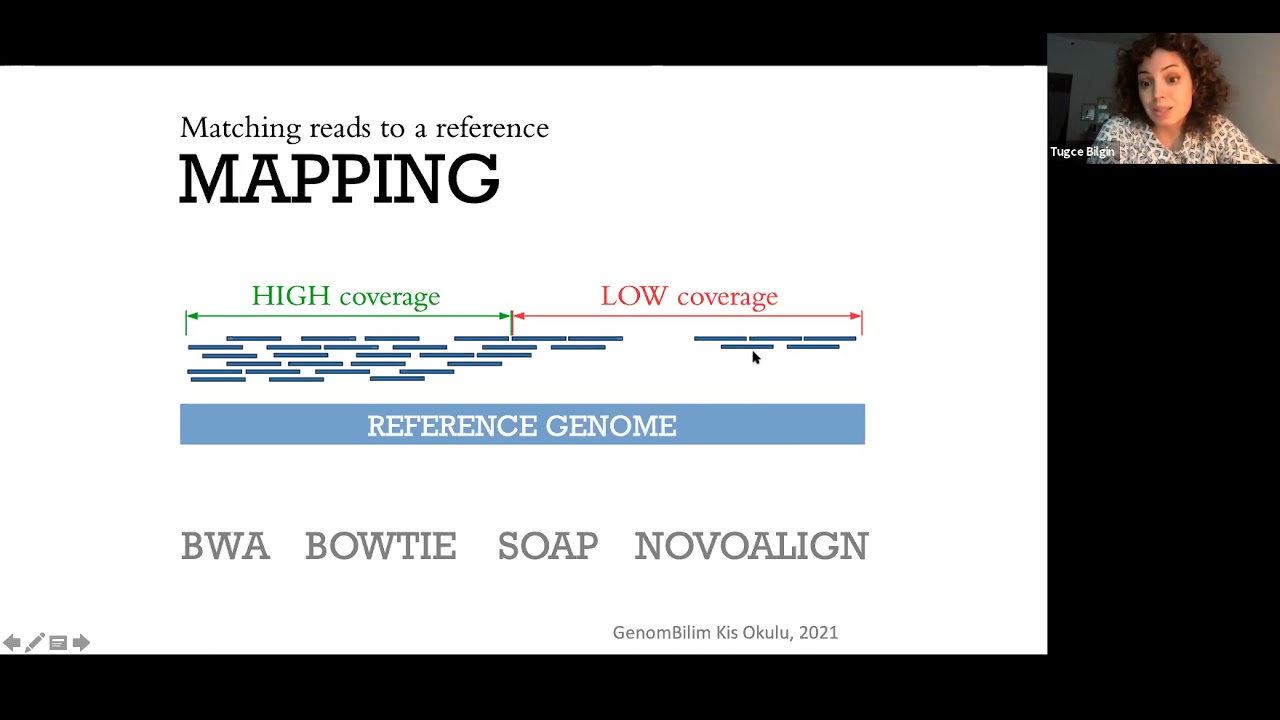
Sequence Alignment and Mapping: Moving on to map the cleaned sequencing reads to a reference genome or transcriptome using aligners like BWA, Bowtie2, or STAR.
Downstream Analysis Workflows: Exploring how quality control decisions impact variant calling (DNA-Seq) or differential gene expression analysis (RNA-Seq).
201.9K views1.5Klikes11:33Original Release: 2010-09-22
we're going to have a look at the use of fast QC for doing some initial quality control validation of some raw sequence that's come straight off a high throughput sequencer fast QC can be running one of two modes you can either run it as part of your normal sequence analysis pipeline in an offline mode where it produce an HTML result or you can run it as we're showing here as an interactive application in both cases the results that you see are exactly the same and in both cases it takes in a fast Q file either a base call file or a color space file as import to run the program you simply need to go to file and open and select one or more fast Q files that you want to analyze in this case I've got two example files a good one and a bad one when I open these up I'll see two little tabs open at the top and the files will start to process both of these files are shortened for the purposes of this demonstration normal files will take maybe a couple of minutes to process it's really the size of the file that limits it for every file that you process what you will see is on the left hand side there are a series of modules which are run and for each module you'll either see a tick if that module passed and everything was okay an exclamation mark if it was slightly unusual and it's something you should look at or an X if it was really unusual and it was something that may well would just be wrong what you would hope to see for instance in the good sequence is a big line of ticks I've got one warning which I'll go and look at but for the bad sequence I can see I've got quite a few warnings and a least one error so it's probably easiest to go down through the modules one by one and just see what you get in each one and what you might want to look for if I look through the good sequence first then we'll come to the bad and see what that looks like so the basic statistics just tells you which file was pre processed what type of base calls it was was it conventional based calls or color space color space analyses are operated just by converting them into base space and then analyzing that how many sequences were processed what the sequence length was if there was a range of lengths you'll get the range in here and what the overall percentage is GC for the library was the next view then is the perb a sequence quality so what this does is along the x-axis on this graph are all of the individual bases for the read so in this case this was a 40 base pair run so I have 40 bases that were called for every sequence and then for every base call it plots out the distribution of values that you see so what you have in here is a bit difficult to see on this it's probably easier to see on the the bad quality one but you have a yellow box that shows you the interquartile range so from the 25th the 75th percentile you have a red line which shows you the median value you have black whiskers that go between the 10th and the 90th percentile and then you have the blue line which is the mean quality score there are several different ways to encode quality scores in fast queue files and fast QC will try and work out which encoding is used in this particular file and we'll put that at the top so here it says this is Illumina version 1.3 encoding so it should try and guess that automatically in this case you're looking for the quality scores to stay high all the way across your run quality scores generally you want to have something that's well above 20 to be a good quality base call if I have a quick look at my bad sequence in my bad sequence you can see it's a very different picture where my quality initially starts well but then tails off at about sort of 18 and by the time you're down to sort of base 23 this is not quality I'd really want to trust so quite a high proportion of my library is descended into very poor quality and if I was working on this data at the very least I'd probably want to trim my data back to about sort of base 23 24 something like that to actually be assured that the base calls that I've got were actually any good the next thing that I can look at rather than looking at the quality scores on per base is I can look at the quality scores per sequence so in this case what I'm doing is I'm taking every sequence working out the mean score across all the bases in that particular sequence and then plotting out the distribution of those means so what I see in the good quality sequence is that all of my sequences form 1 very tight distribution with universally high quality and there really are no sequences with low quality in here in the bads sequence it's not so bad so still the majority of sequences that I have still have this high average quality score but I can now see that there is a second population coming up which is sequences that for whatever reason have overall a lower quality so I could if I was choosing to filter say while actually I'll keep the set of sequences that always have universally high quality and remove these so instead of trimming the sequences I could filter the set to remove this set of lower quality sequences sometimes this can be sort of positional effects something like that where part of your flow cell had a problem or it may just be that a subset of sequences was bad next thing to look at then is the per base sequence content so all of the things being equal with a diverse library you should see an even distribution of the four bases which doesn't change with base position so the relative amounts of GC will be determined by your library but what you should see on here is parallel lines going across your plot so that the position that you're looking at doesn't influence the base call if you have a biased library you may see some influence in that for this library I can see this is wobbling about a bit and the reasons for that will become clear a bit later but this isn't too bad even so you if you have a really biased position then you'll see spikes that go up to sort of 80 90 percent something like that it'll be very obvious next thing I'm looking at is a similar sort of plot which is the per base GC content so is my GC content changing across my read and really no not really in this case again it should be flat a little bit of a wobble at the start but that's not a too unusual particularly with your doing RNA sequencing you'll find the nature of the primers used for RNA sequencing means you see quite a wobble in the first sort of nine or ten bases of your libraries but for most libraries it should be fairly flat for my bad sequence I've got a warning for this because I can see there is some variation across the run and again the reason for that will become clear in a minute next thing I can look at is the per sequence GC content so this is plotting out the dish of GC contents across all my sequences and actually for my good sequence this is the one bit that's not very good on it so I should see on here is a completely normal distribution so the red line on here shows me what I actually see in my sample and the blue line shows me a theoretical normal distribution with the same mean and standard deviation as my real library has and there should be good overlay between the two and actually in a good library there is so this one isn't actually great you can see there's actually a slight shift towards lower GC content on here and the plot isn't completely symmetrical having said that it's not a disaster it's not terribly far away so I'm not going to get too worried about that in my bad library I can see it actually looks a bit worse so it's actually a slightly closer fit over the main part of the distribution but I can see I have this sort of secondary peak coming out of the top and this is normally an indication of some kind of contamination in my library so if you see a smooth peak with a one or two spikes coming out of it those are normally indicative that there are specific contaminants in your library per Basin content just tells me if there are any uncalled bases in my library it shouldn't really be many and in this case there aren't any in my other bad library I've got a few that come up between 25 and 31 but still not too bad length distribution is just an informative plot telling me if my library is all the same length or not so in this case everything is 40 bases which is normally the case room and lumina libraries for other technologies you may see variations in the sequence length and that will just tell you what the distribution is you can also having trick quality trimmed your library you can then run it again to see what length of sequence you've got left sequence duplication levels is looking at a way of finding out how unique your sequences are within your library what you should see is that most of the sequences in your library only occur once so here I have duplication level one and I have they're automatically set to 100% and everything else is measured relative to the number of unique sequences so here I can see it almost immediately drops to two and ghost stays flat all the way to ten ten is actually ten or more and it's still flat my overall duplication level in this library is only six point four percent so only six point four percent of the sequences in here on non-unique in my bad sequence library it's a little bit worse so you'll see that actually it doesn't look too bad on the plot because okay two's up a bit three's up a bit but 10 is also up a bit so remembering this is 10 or more but what this is telling me is that although there's not a systematic problem in that way overall 34% of my library actually comes from duplicated sequence and so there's probably something in there that is problematic finally we come to the over-represented sequences module this looks at duplicated sequences in a different way where it actually looks for individual sequences which are over represented within the set so that means they have to represent more than 0.1% of the total sequences in the library in my good sequence file I don't have any over-represented sequences which is what you'd hope to see but in the bad sequence file I can see that actually I have a number of sequences which each make up more than 0.1% to the library for each of these sequences I get the sequence listed the number of times it's observed and the percentage of the library that represents and then we also screen that sequence against a source of part a set of possible contaminants the default set of contaminants is all of the primers and adapters used in the various sequencing platforms but you can add your own sequences on top of that and down here for instance you can see that there's a hit to the Illumina paired-end PCR adapter or PCR primer in this case so if you have got a known contaminant it will try and tell you that but the rest of these there's an unknown source you can add your own sources of sequence on top of this if you have other contaminates you know might be present in your sample so aside from just looking at your files within the interactive program you can also save this off so having done the analysis you can review it very quickly if you want to save a report the saving will apply to whichever report you're currently viewing in here so you need to click through the various tabs to save all of the files that you've opened to save a report it defaults to giving it the same name as the input sequence with tasks you see on the end the default file type is a zip file where it makes an HTML report but put into a zip file and when you unzip that it will make a folder inside which will be an HTML document and there will also be subfolders containing all the various analysis images the program also produces a computer readable for form of all the data that you see in the interactive application so if you do want to pass that to put it into some sort of automated system that should also work as well
Up Next

18:56
nf-core/mag pipeline: Metagenome Assembly and Binning
@nf-core
785 views•2023-03-03

12:54
Triumph of Orthodoxy Icon: Byzantine Art & History Explained
@BenCallan
2.1K views•2024-08-06

9:49
FastAPI vs Flask vs Django: Choosing the Right Python Web Framework
@TechWithTim
302.5K views•2024-05-26

1:42
Game of Thrones Opening Credits: A Cinematic Analysis
@gameofthrones
46.3M views•2011-04-18
Related Study Plans & Knowledge Roadmaps
Structured learning paths in General & Interdisciplinary Studies
general-studies
Elevator Engineering: History, Physics & Cities
01From Hoists to Safety Brakes: The Dawn of Vertical Lift
02Hydraulic vs. Traction: The Engineering Physics of Elevators
03Modern Speed, Safety, and Algorithms
+ 2 more learning modules
12h5 modules
Explore Roadmap
general-studies
Rubber: Material Science, History & Geopolitics
01Origins of Natural Rubber & Mesoamerican History
02The Chemistry of Natural Rubber & Vulcanization
03The Geopolitics of the Rubber Boom & Colonization
+ 2 more learning modules
12h5 modules
Explore Roadmap
general-studies
Containerization: Evolution, Logistics & Trade
01Ancient Trade & Bulk Cargo: Amphorae to Barrels
02The Industrial Revolution & Cardboard Packaging
03The Containerization Revolution: Malcom McLean
+ 2 more learning modules
12h5 modules
Explore Roadmap
general-studies
Textile Tech: Evolution, Labor & Global Impact
01Pre-Industrial Textiles: Handloom & Cottage Industry
02Mechanization: The Spinning Jenny to the Power Loom
03The Factory System & Global Labor Transformation
+ 2 more learning modules
10h5 modules
Explore Roadmap