












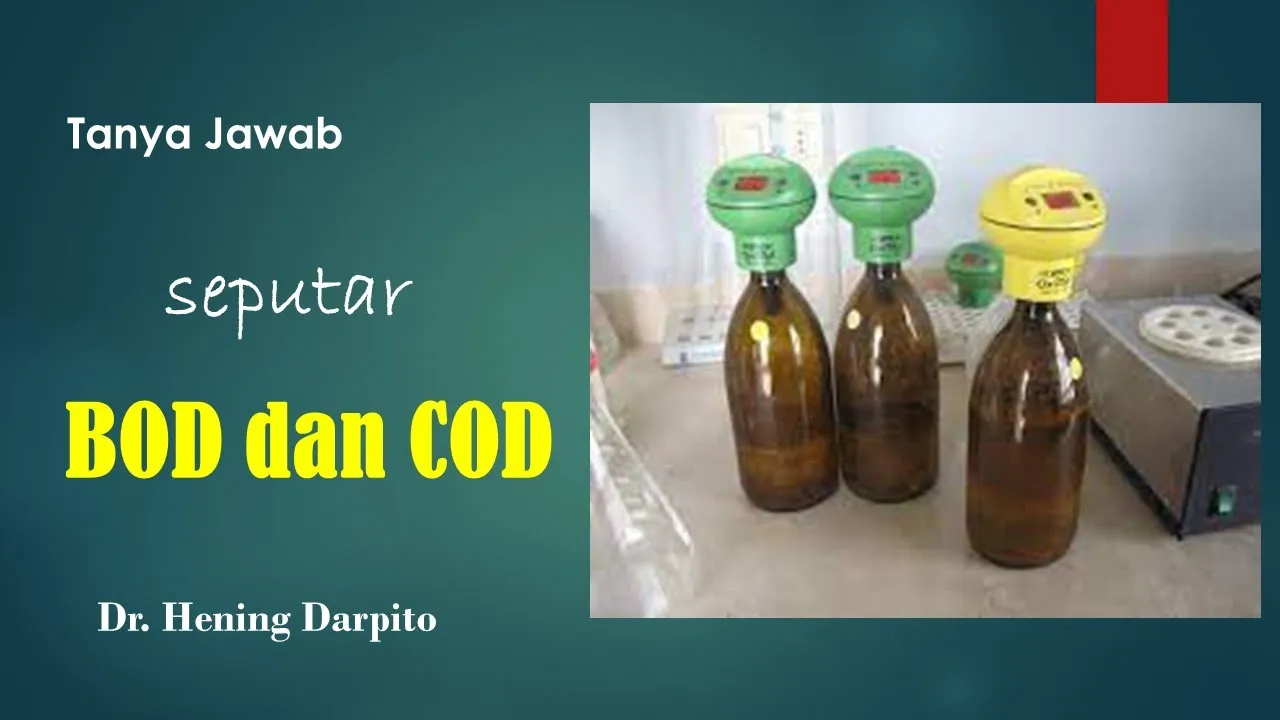


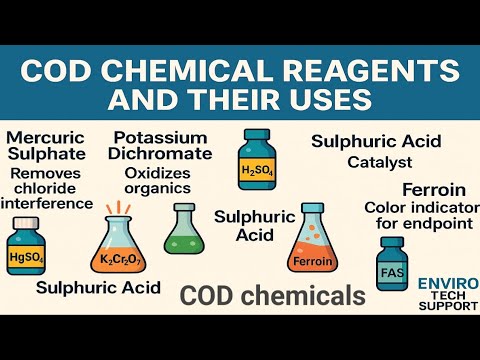





Chemical Oxygen Demand (COD) is an empirical laboratory assay that measures the total organic matter in water samples by determining the amount of oxygen required to oxidize all organic material to carbon dioxide and water, using a colorimetric method where dichromate ions are reduced to chromium ions during digestion, and COD concentration is calculated from absorbance measurements at 600 nm using a calibration curve.
Chemical Oxygen Demand (COD) Analysis Tutorial
Added:Understanding of basic redox (reduction-oxidation) chemistry and the role of strong chemical oxidizing agents.
Fundamental principles of spectrophotometry, colorimetry, and the Beer-Lambert Law.
Basic water chemistry concepts, specifically what organic pollutants are and how they affect dissolved oxygen levels.
Standard laboratory safety protocols, particularly regarding the handling of hazardous reagents such as concentrated sulfuric acid, potassium dichromate, and mercury salts.
Comparing COD with Biochemical Oxygen Demand (BOD) and Total Organic Carbon (TOC) to evaluate wastewater biodegradability (BOD5/COD ratio).
Application of COD parameters in the design, operation, and efficiency monitoring of municipal and industrial wastewater treatment plants.
Methods for identifying and mitigating chemical interferences in water samples, specifically chloride interference using mercuric sulfate.
Exploring green chemistry alternatives and automated online instrumentation for continuous organic load monitoring.
197.4K views1.6Klikes11:09Original Release: 2015-12-01
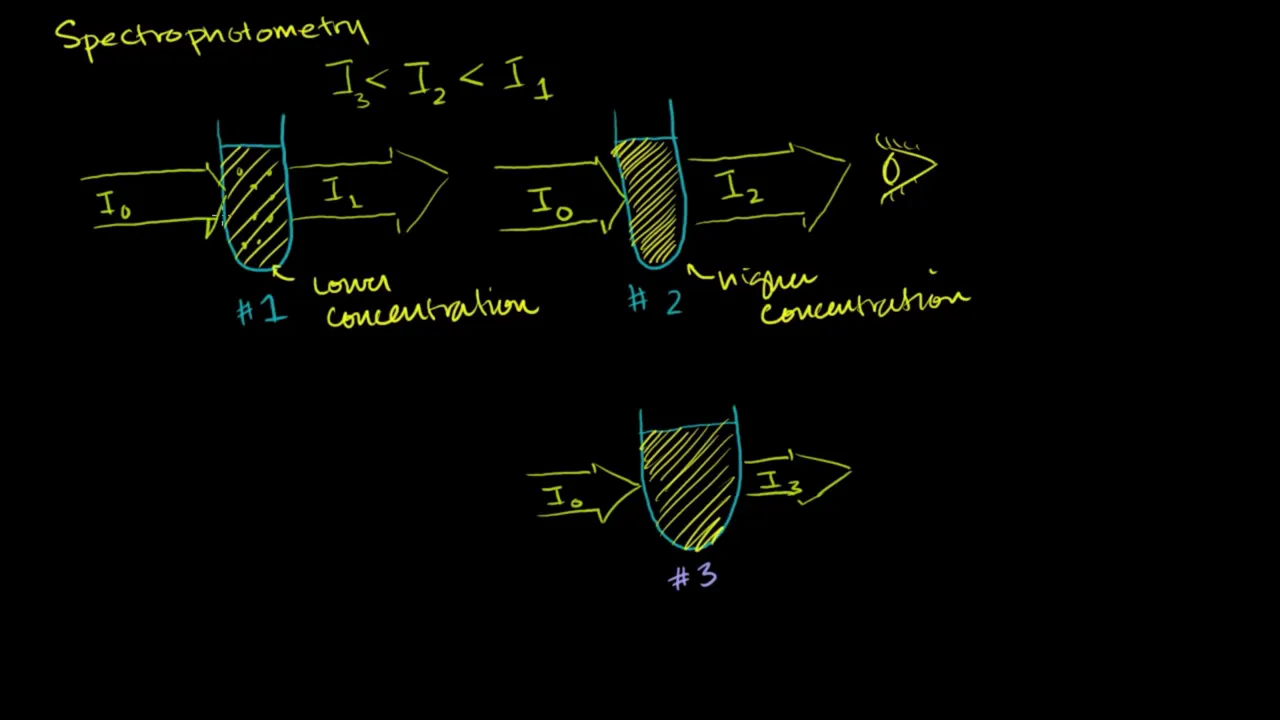
the chemical oxygen demand C is an empiric laboratory essay which indirectly measures the amount of total organic matter biodegradable and non-biodegradable contained in a water sample in particular Cod measures the amount of oxygen consumed for the oxidation of total organic matter thus it is measured in milligrams of oxygen equivalent per liter C is related to biochemical oxygen demand bod another standard test for assaying the oxygen demanding strength of waste Waters however whereas VOD is a measured of the amount of oxygen the bacteria will consume while they composing organic matter under aerobic conditions cood does not def differentiate between biologically available and innert organic matter and it is a measured of the total quantity of oxygen required to oxidize all organic material into carbon dioxide and water in this way the cood values of a water sample can be typically related to its bod values in a more or less constant ratio Cod values are always greater than VOD values but Cod measure measurements can be made in a few hours while bod measurements take at least 5 days since the Cod test can be performed rapidly it is often used as a rough approximation of the water's bod even though the cood test measures some additional organic matter such as cellulose which is normally not oxidized by biological action there exist different methods to measure cod in all of them a fixed volume with a known excessed amount of an oxidant is added to the water sample being analyzed the basis for the cood test is that nearly all organic compounds can be fully oxidized to carbon dioxide with a strong oxidizing agent under acidic conditions at high temperature after a digestion step the concentration of organic substances in the sample is calculated from a tetric or a spectrophoto metric determination of the remaining oxidant in this video we will explain how to measure cood with the colorimetric method based on a spectrophotometric determination the spectrometric method consists of adding a strong oxidant to the water sample under acidic conditions and using silver as a catalyst the sample is then digested for 2 hours at 150° C and it's determination is done by using a spectr photometer during the digestion the samples organic carbon material is oxided with the exava valence dichromate ion found in potassium dichromate the dichromate readily gives up oxygen to bond with carbon atoms to create carbon dioxide the oxygen transaction from di chromate to carbon dioxide reduces the dichromate ion to the chromium ion the amount of chromium ion is determined after oxidation is complete in essence a Cod test determines the amount of carbon based materials by measuring the amount of oxygen the sample will react with both chromium species are colored and absorb light or radiation in the visible region of the spectrum but at different wavelengths while the dichromate ion is is visible at 420 nanom the chromium ion is at 600 to 620 nanom where dichromate has nearly zero absorbance Cod is Quantified by colorimetric determination using a spectrometer at 600 nanometer which measures the absorbance of Light by the sample and correlates it to a cood concentration value the beer Lambert law affirms that for some substances light attenuation or absorbance is proportional to the concentration of attenuating species in the water sample in other words if the value of absorbance is known the concentration of the substance can be deduced in particular the spectrophotometer measures the amount of chromium ion produced during the digestion of the sample which is correlated to the concentration of of organic matter to start with a relation between absorbance and concentration is required in order to further determine cood values that is the reason why a calibration curve is prepared the calibration curve consists of preparing standard Solutions with known Cod concentration and determining their absorbance at a given wavelength this allows us knowing the relation between Cod value and absorbance to achieve this calibration calibration standards whose behavior is the same as that expected in the CSA must be used considering a solution of potassium hydrogen eulate the relation between Cod value and concentration of this solution is knowing this a scheme of five to seven dilutions of the solution are made in order to obtain enough points to fit the calibration curve the standard dilutions should have the concentrations shown in this table ranging 0 to 500 mg of oxygen per liter these are obtained by diluting the initial potassium hydrogen eate stock solution once that done the absorbance of olive standards is readed in the spectrophotometer and the equation fit where Y is cod concentration and X absorbance this method has a range of cood concentration from 0 to 1,000 mgs of oxygen per liter if any water sample is out of range it should be diluted first of all switch on the dry block heater in order to achieve 150° C on time while preparing the water samples for digestion in order to zero out any light light absorbed by anything in the solution other than the compound of Interest reference blanks are needed which consist of the ionized water samples of 2 and 1 12 milliliters prepared in triplicate blend and mix the water samples before pouring any volume into digestion vessels so that suspended solids are not excluded from any aliquat prepare three replicates for each sample so as to reduce error by eliminating outliers pour 2 and A2 mL of water sample into a digestion vessel in case it is not necessary to make any dilutions of sample after that incorporate the reagents into each digesting vessel since a very exothermic reaction will occur it must be done in the fume Hood first of all introduced 1 and 12 mlit of diges solution to each digestion vessel then introduce 3 and 1 12 mL of sulfuric acid it is important to follow this order while introducing reagents close tightly each cap tube and mix them completely Place tubes in the dry block digestor preheated at 100 50° C and set the timer for 2 hours after that remove the tubes from the dry block digestor and let them cool down once samples are cool color vessels can be observed the darker the orange color the greater the cood value and therefore the larger the amount of organic matter in the water sample sample must remain yellow or or orange even after digestion if a sample turns green it means that the Cod value is out of range and the sample should have been diluted so the analysis must be repeated before measuring the absorbance of each tube reaction vessels must be completely mixed now it is time to use the spectr photometer it has to be set at a wavelength of 600 nanom to zero out the spectr photometer we will first measure the absorbance of each blank by definition the absorbance of the reference blank is set at zero now proceed to measure the absorbance of each water sample and note down the absorbance value of each replicate if a value is very distant from the average absorbance of the other replicates this one should be discarded the same procedure was used when taking absorbance values of the calibration curve once we have all absolvent values we can use the calibration curve obtain at the beginning to calculate the Cod of each sample for example for an absorbance of 194 Milli absorbance units the Cod concentration can be calculated with a calibration curve where X is the value of measure of absorbance in the spectr photometer in this case is 0.194 this gives a value for COD concentration of 511 mg of oxygen per liter if any of the cood calculated values exceeds the method's range a new replica should be done with a dilution of the sample thank you for your attention and hope to see you in the next video of this series
Up Next

48:05
Battery Cycling Techniques for Research | UCSB Materials Science
@eliassebti9253
33.7K views•2021-09-07
83:56
Biocatalysis and Catalysis in Islatravir Synthesis | Merck Webinar
@SCIwheresciencemeetsbusiness
675 views•2020-10-08
10:06
1H NMR: Determining Number of Peaks from Structure
@MSJChem
59.2K views•2017-04-06

17:31
Edible Water Bottles: A DIY Guide to Sodium Alginate Spherification
@ryan
10.5M views•2019-06-21
Related Study Plans & Knowledge Roadmaps
Structured learning paths in Chemistry
chemistry
Nuclear Chemistry: Decay, Meds & Fuel Cycle
01Introduction to Nuclear Structure and Radioactivity
02Decay Dynamics and Kinetics
03Radiation Interaction and Detection
+ 2 more learning modules
24h5 modules
Explore Roadmap
chemistry
Supramolecular Chemistry: Forces & Machines
01Foundations of Chemical Bonding and Intermolecular Forces
02Introduction to Host-Guest Chemistry
03Thermodynamics and Dynamics of Self-Assembly
+ 2 more learning modules
16h5 modules
Explore Roadmap
chemistry
Photochemistry: Excited States & Reactions
01Foundations of Light-Matter Interactions
02Molecular Orbitals and Electronic States
03Photophysical Processes and Jablonski Diagrams
+ 2 more learning modules
18h5 modules
Explore Roadmap
chemistry
Coordination Chemistry: Bonding & Properties
01Introduction to Transition Metals and Ligands
02Crystal Field Theory (CFT) and Geometry
03Magnetic Behavior and Spin States
+ 2 more learning modules
14h5 modules
Explore Roadmap