



![How Does a Laser Work? Quantum Nature of Light - [3]](https://i.ytimg.com/vi_webp/Gbfj_FlEjI4/maxresdefault.webp)














Spectroscopy is the technique of analyzing light by spreading it into its component wavelengths using a spectrometer or spectroscope, which can be achieved through dispersion (using prisms) or diffraction (using diffraction gratings); this allows scientists to identify the chemical composition of materials because each element produces a unique set of spectral lines (fingerprints) in either emission spectra (bright lines against dark background) or absorption spectra (dark lines against continuous background), enabling astronomers to determine the elements present in distant celestial objects like stars and nebulae.
Spectroscopy Explained: Emission & Absorption Spectra
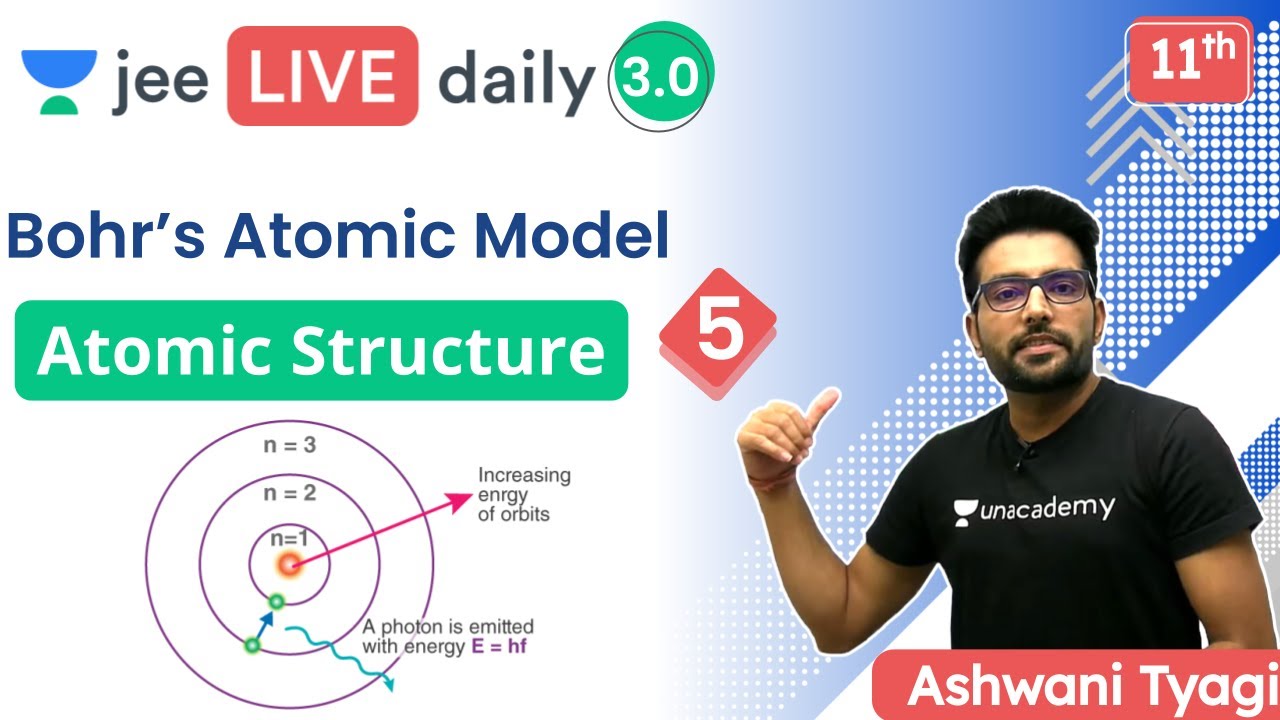
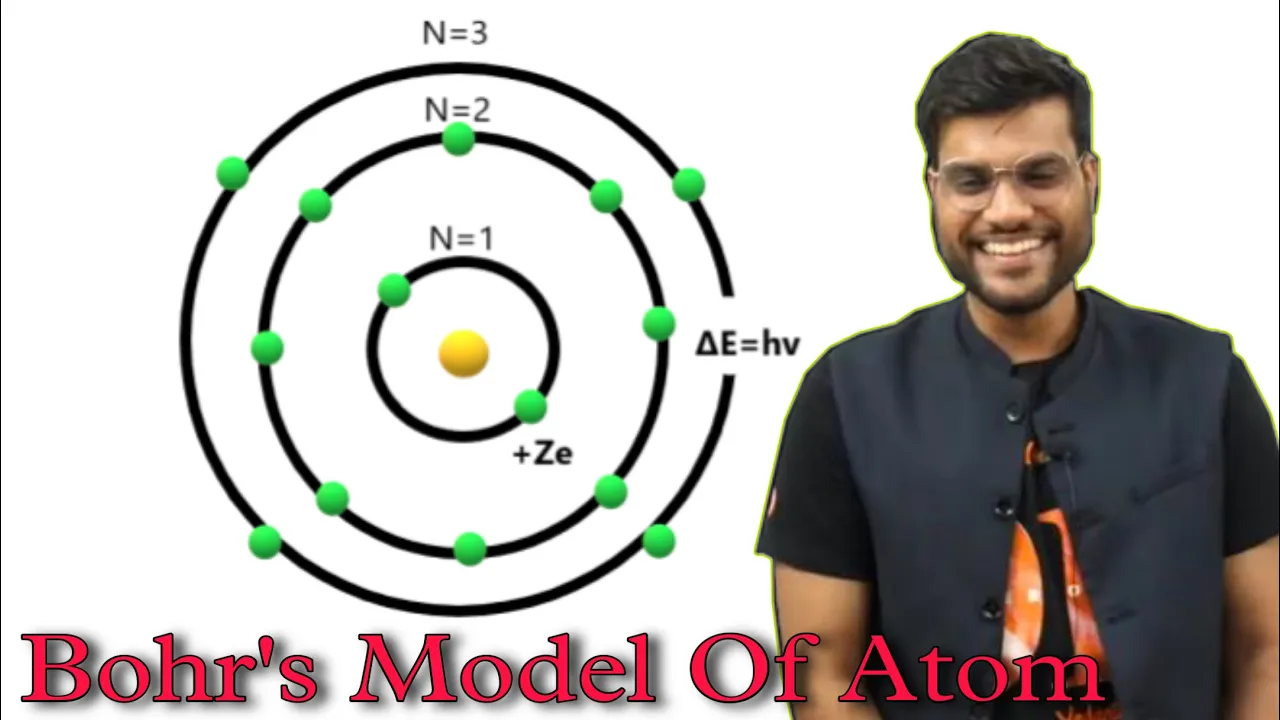
Added:Basic atomic structure, specifically the Bohr model of the atom and the concept of quantized electron energy levels.
The nature of light and the electromagnetic spectrum, including the mathematical relationship between wavelength, frequency, and photon energy ($E=hf$).
The concept of wave dispersion, such as how a prism or diffraction grating refracts or diffracts light to separate it into its component wavelengths.
The principle of conservation of energy, particularly how an electron must absorb or emit a specific quantum of energy to transition between energy states.
Astrophysical applications of spectroscopy, such as analyzing starlight to determine the chemical composition, temperature, and radial velocity (redshift/blueshift) of celestial bodies.
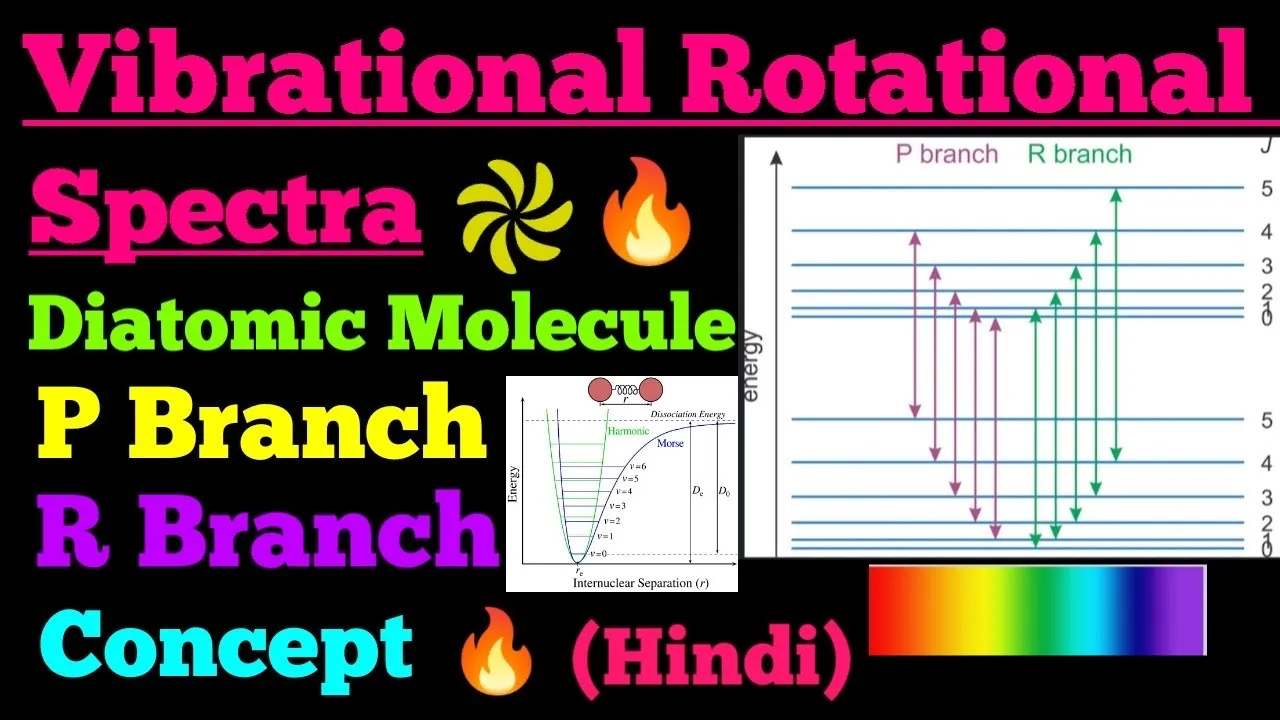
Molecular spectroscopy, exploring how molecules undergo rotational and vibrational transitions (such as Infrared and UV-Vis spectroscopy) rather than just electronic transitions.
Practical analytical chemistry techniques, including Atomic Absorption Spectroscopy (AAS) and Inductively Coupled Plasma (ICP) used for elemental analysis in labs.
Advanced quantum mechanics concepts related to spectral lines, such as selection rules, Zeeman effect (splitting of lines in a magnetic field), and fine structure.
86.8K views1.4Klikes21:04Original Release: 2019-03-31
hi and welcome to high school physics explained and I'm Paul I'm Simon and I'm Tom and today we're going to be looking at the physics behind spectroscopy in the basics of spectral speak but also the applications of spectroscopy [Music] now before we start we need to discuss simply what light is now in one sense light is a wave it's an electromagnetic wave and so what we have here is an image that shows us the range of electromagnetic radiation you can see if down one end we have gamma radiation and the other end we have radio waves on the scale as a top on the bottom either the frequency or the wavelength you can see that the visible spectrum what is we refer to as light is actually an extremely small portion of the electromagnetic range I'll have another video at a later stage where I'll discuss more about the electromagnetic radiation as we understand it the thing is light can be perceived as a wave with a range of frequencies and a range of wavelengths and the wavelength came to be around as small as 380 nanometers and up to 750 nanometers for the very far end of the red end of the spectrum now what happens when light interacts with some sort of material there's a number of things that can happen the first thing that can happen is is that it can be absorbed so the energy of the light is absorbed by the material and material might increase in temperature the second thing that might happen is the light may be transmitted so light passes straight through and glass is a good example of where light can be transmitted through the material the third thing that can happen is that the light can be reflected and of course objects that we see are generally seen because light reflects of the substance but the reality is is that although light can be absorbed by the material some of that light may be re-emitted so for example the Sun that we see the light we see is because of light being emitted from the internal processes within its core a light bulb or a light filament is emitting life due to the energy in the material of the filaments it's emitting light but it's also simple when we have light coming through and being transmitted it's not necessary true that all the light is transmitted so what you see may be a combination of things so for example like we be transmitted through but some wavelengths of light may be reflective some wavelengths of light may be absorbed and then Rhian meters so what you see here and what you see here may be very different even though you may be looking at the same object like maybe interacting the object so that we can have emission and some transmission and some reflection as well and that's what we want to particularly discuss so what we need to do is find a way of spreading out a light into its different wavelengths or often refer to into its different spectra in other words by spreading out the wavelengths we can examine which wavelengths are transmitted and which wavelengths are emitted if this both process is going on and for that we need a spectroscope and in simply put a spectroscope will spread out the light and you can do it one of two ways the first way is by what we refer to as dispersion and the most common example of dispersion is when we look at a rainbow light is dispersed light is refracted through the material and refract slightly different amounts depending on the wavelength so a prison he causes a wavelength to spread out this is a picture of Kirchhoff who examined light from a candle using a prism in other words he's relying on dispersion to spread out the wavelengths of the light but another way we can do it is what we call diffraction and diffraction is when light interacts with a surface in this case what we have is a diffraction grating that spreads out the light now our soap bubble is actually an example of diffraction our CD discs and DVD discs which therefore have colors on them is also an example of diffraction now I'm not going to go into details on the nature of diffraction that will be a subject for another video but it's another way that we can spread out some white light into its constituent wavelengths so a spectroscope could be something so very simple it could be a tube and most likely within this tube it could have a diffraction grating where the light therefore splits into its different colors and you may have it at school but it could also be something a bit more complex like a spectrometer where you can actually look at each of the individual wavelengths by simply moving a scope around the spreading of the colors if I move this around you can see I can see the different colors as I go through now this is not accurate and precise but in essence that what a spectrometer does it allows you to measure the angles and those angles are important to determine the wavelength that is in the light and we'll explain that shortly so now let's have a look at what type of spectra we might get for different sorts of situations so here ever a light source it could be the Sun it could be some sort of light source that gives off white light that light will come out and we can examine that light using our spectroscope or a spectrometer and so what we get is a spectrum this is a continuous spectrum in other words we see all the wavelengths that are within the light however what happens if our white light encounters a substance and in this case we're going to make our substance a gas and it's going to be hydrogen gas simply for a good example and this is often the case when we are examining stellar objects in terms of astronomy what will the light look like when the light passes through and is examined through the spectrometer or the spectroscope and what we get here is our spectrum but it's no longer continuous you'll notice that there are solid lines here and that's because as the light passes through some of the light is absorbed by the gas and some of the light is allowed to transmit through so here we clearly have four key lines that are very unique wavelengths that are absorbed by my gas and therefore no longer appear on my spectrum so we call this an absorption spectrum but imagine I now have a spectroscope and I look at the lights that's being emitted by my cloud in other words I'm not looking at the light that is remaining I'm looking at what's left over I'm no longer going to get this absorption spectrum I'm going to get something else and I'm going to get what we call an emission spectrum so clearly we have no light from any of the wavelengths in between here reaching our spectroscope we're only getting the light that is being emitted by the material so what's it saying well that means that we have certain wavelengths of light absorbed by our gas cloud and then they're being readmitted and it's the same wavelength and it's the same frequency and so what you'll notice is that these two are complementary that is this red line here corresponds to the red line over here this purple violet line correspond to this violet line so these are very unique lines and these unique lines represent the wavelength of the emitted light coming off same here with the dark bands so we have an emission spectrum and absorption spectrum of course if there's no lines we have what we call a continuous spectrum now let's have a look at this image this is the light that comes from our Sun what's our telling you well they're sunlight clearly isn't giving off all the colors of the rainbow so to speak we have significant lines through our spectrum so it is an absorption spectrum now these lines are significant in that they tell us what gases the light is passing through as it reaches to earth our Sun is a gaseous star and so therefore what's happening is that light is interacting with the gases and because we can examine different gases here on the earth and reproduce the lines we can therefore determine the gases and the actual elements that are surrounding our Sun because they're unique causing these lines here is a sodium lamp a common street lamp because it's made up of a sodium gas in this case the light is only being emitted a very unique frequencies and therefore only at very unique wavelengths and so therefore it has this characteristic color but if we really wanted to analyze the lighters coming through that we look at a spectrometer or a spectroscope to look at the emission spectrum and so here we have our lines and you can see these lines are very few in number and predominantly they're in the yellow range a sort of five 75 80 nanometer range and that gives its distinctive color but these lines are unique to sodium so if we let's say look at other lines here we have three other emission spectra which are different in terms of its lines but these are all unique to specific elements so this is hydrogen this here is calcium and this here is mercury and so if we can examine any gas that is emitting certain light and analyze it if we can specifically isolate their lines and match it to what we know for the materials we can work out the chemical composition of that gas no matter how far we are away from it so a classic example here is what we refer to as the helix nebula and it's one of my favorite Hubble images and these are massive plumes of gas but the colors here can be analyzed even though it is millions of light years away the blue represents oxygen the Reds within this represents the presence of sulfur and green represents both nitrogen and hydrogen so from a long distance we can actually determine the chemical composition of astronomical structures so how does a spectrometer work well spectrometer simply analyzes the light that is coming through a diffraction grating in our case and that diffraction causes the light to diffract and the amount of diffraction that takes place is related to a number of variables now I'm not going to spend a huge amount of time discussing how the fraction actually works that is going to be the subject of another video but suffice to say I'm just going to introduce you to the diffraction formula d sine theta equals M lambda now what do they represent d represents the distance between the individual slits so if I have a thousand lined diffraction grating that means I have a thousand lines per millimeter and so I have a D value of ten to by the negative six if for example I have a coarser diffraction grating so let's say 100 lines per millimeter I'll only have 10 to the power of negative 4 as my distance here and so it's a larger value here the sine of the angle or the angle is the angle that we have measured from the central line so obviously for red which has a longer wavelength has a larger angle and so violet it's going to be a smaller angle here M is called your order and this happened to multiple times along the way in other words you're going to have another rainbow further down this track if you kept the angles going further and they are the different orders but we won't worry about that we'll just treat that as one in our case now here we have white of course because there's no diffraction taking place so what light is going to hit that section there but what happens if we introduce not white light what will we get if we introduce let's say light that is produced by a hydrogen lamp I'm going to get in this case not a continuous spectrum I'm going to get an emission spectrum and so my light is spread out but because I only have very discrete wavelengths I'm going to get only discrete lines and these lines of course are very specific wavelengths determined by the actual properties of hydrogen in other words they're the hydrogen fingerprint so here's Tom going to demonstrate how he sees the lines pump so this is the equipment we have the school of physics here at Sydney University now you'd all be pretty familiar with these things here which we normally use in schools basically a diffraction grating on the end and a slit on the others bit of a window here so we can see the values of the minds but this is the the more precise equipment that we use and it's all about spectroscopy trying to find the signature lines that color that have come out from a different element the equipment we have is the hydrogen emission lamp you can see the little purple line there the spectrometer here which breaks the hydrogen into its component colors and part of that is the diffraction grating which breaks which breaks the light open and the way that the hydrogen spectrum works is of course we have a bunch of different electrons with different energies the hydrogen lamp is given energy from from the electricity it jumps up into different energy fields and then falls back down to level 2 it also falls down to level 1 and 3 but they're different things we won't talk about that right now it falls down into level 2 we call this the bomber series and we can see that because the amount that it tops is exactly equivalent to a photon of lines exactly equivalents for wavelengths that we can see so let's have a look inside the spectrometer so to see what we can see so if we have a look at the spectrum now what we'll see when we look straight through here is just that purple line because we're not having any of the light diffractive what I'll do is I'll move it slightly over here to the angle that we need which is about there and what we'll see is a purple line because purple has been diffracted less if I move it a little bit further we'll see we'll see the blue line and then again further out here we can see a red line there are a couple of other colors in this hydrogen spectrum but this machine the spectrometer is not precise enough to pick those up thanks Tom but how do we actually measure the actual angles by that we need a particular scale on the actual device so this is a wonderful piece of kit this is a precision instruments that we gets in some high schools but not all you have an angular vernier scale here so you have the degrees going around on the main ring around and then we have a fine vernier scale now depending on how old your spectrometer is you'll either have a vernier scale or measure two tenths of a degree so a bit like with vernier calipers and you see with a line you see where the zero is to see what's integer number you have of degrees and then you see where the lines line up to get the tenth of a degree or you might have an older spectrum and two like this one and the older ones tend to be the best where actually measures two minutes so this actually has a scale up to 20 minutes and then we've got thirds with in each degree here so 20 minutes is 2060 it's so that's one third so we've count how many degrees and how many thirds of a degree or 20 minutes and then how many twentieth of a degree on top so we can actually get some precision results here which is fantastic particularly when the beauty of this experiment as well as we know the results we know the values of the wavelengths of the Barma series so we can actually compare our measurements against the scientific theory against the physics and and compare those results the physics behind the Depression Rating is an important parts of high school physics as well just with the equation and the relationship for the different orders so we actually have a very fine diffraction grating here's a thousand millimeters per thousand lines per millimeter so the angles that you saw Thomas sweeping through they're quite large angles for the first-order but then they would repeat again so you get the purple and then the blue and then the red further around but this is diffracting so much will be limited for the numbers of orders if we had a course of diffraction racing let's say a hundred lines per millimeter then you'd actually see them quite close together the purple blue Reds gonna be for the second-order purple blue Reds all the way around and from a methodology point of view you could actually determine the angle by measuring let's say the blue line to the left for the first-order blue line to the right for the first-order calculate that total angle and then divide by two for theta so just a bit of experimentation there so what I find really interesting is the way that technology has helped us find better measurement better measurements and better results this is quite old equipment but it's still very good still very useful we upgrade to slightly more usable pieces of equipment like this up till now and we can start using this stuff with our phones so most of our phones have a bit of a camera on the back and you won't be able to see this but we can take some some screenshots of it this is a tiny little diffraction grating you can get these from some of those kids toys where you hold them up to the light and they sit you know you see rainbows and stuff or a back of a CD if you can put this over the top of your phone which is very simple just covering the camera and then you hold that up you'll start to see the diffraction gratings whether the lines of hydrogen or any other light that that's coming out of a lamp like this on your phone which you can then count the pixels between each one and then calculate the angles from that it's pretty powerful just with a simple phone and a piece of plastic cool let's have a look a close look at it let's do it and if I shown if I point the camera towards the hydrogen lab you can see off to the left we've got the purple blue and red lines pretty clearly as sunny we will say we've got the same thing on the other side and that's the the first oil we can go all the way out to the side and probably start to see some of the second-order there you go there's the purple from the second border it starts to get a little bit dim after that with our photos if I can take a photo of that I'm just going to focus on the dark light and now we have the spectrum line from hydrogen which we could use with a pixel counter which is probably a free app somewhere and count the number of pixels there for the angle and work out exactly the wavelengths of both of those lines the cool thing is it doesn't just work with hydrogen we can do the same thing with all of the other lights we've got those kind of sleekness around so we can see that is neon I think he's Neku just for the phone okay I hope that's given you a better understanding of spectroscopy I hope you continue to follow the channel like and subscribe check out crooked science with Simon over here and also the kickstart program at the University of Sydney thanks for watching bye for now
Up Next

4:51
Flame Test & Atomic Emission Spectra: Chemistry Lab Experiment
@emilyh-science-music-books
4.5K views•2021-12-11
83:56
Biocatalysis and Catalysis in Islatravir Synthesis | Merck Webinar
@SCIwheresciencemeetsbusiness
675 views•2020-10-08
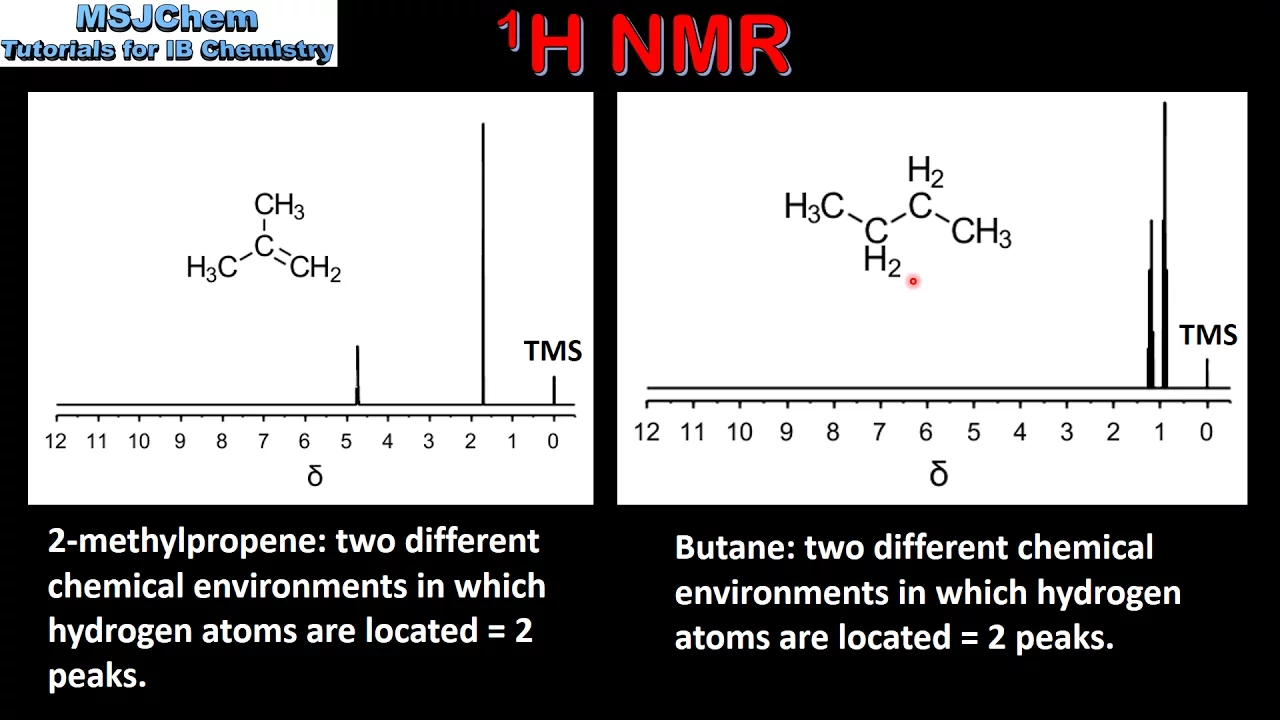
10:06
1H NMR: Determining Number of Peaks from Structure
@MSJChem
59.2K views•2017-04-06

17:31
Edible Water Bottles: A DIY Guide to Sodium Alginate Spherification
@ryan
10.5M views•2019-06-21
Related Study Plans & Knowledge Roadmaps
Structured learning paths in Chemistry
chemistry
Nuclear Chemistry: Decay, Meds & Fuel Cycle
01Introduction to Nuclear Structure and Radioactivity
02Decay Dynamics and Kinetics
03Radiation Interaction and Detection
+ 2 more learning modules
24h5 modules
Explore Roadmap
chemistry
Supramolecular Chemistry: Forces & Machines
01Foundations of Chemical Bonding and Intermolecular Forces
02Introduction to Host-Guest Chemistry
03Thermodynamics and Dynamics of Self-Assembly
+ 2 more learning modules
16h5 modules
Explore Roadmap
chemistry
Photochemistry: Excited States & Reactions
01Foundations of Light-Matter Interactions
02Molecular Orbitals and Electronic States
03Photophysical Processes and Jablonski Diagrams
+ 2 more learning modules
18h5 modules
Explore Roadmap
chemistry
Coordination Chemistry: Bonding & Properties
01Introduction to Transition Metals and Ligands
02Crystal Field Theory (CFT) and Geometry
03Magnetic Behavior and Spin States
+ 2 more learning modules
14h5 modules
Explore Roadmap