![Rezystancja, reaktancja, impedancja, moc bierna, czynna, pozorna | #98 [Podstawy]](https://i.ytimg.com/vi/X1ulcKR7Ue0/maxresdefault.jpg)













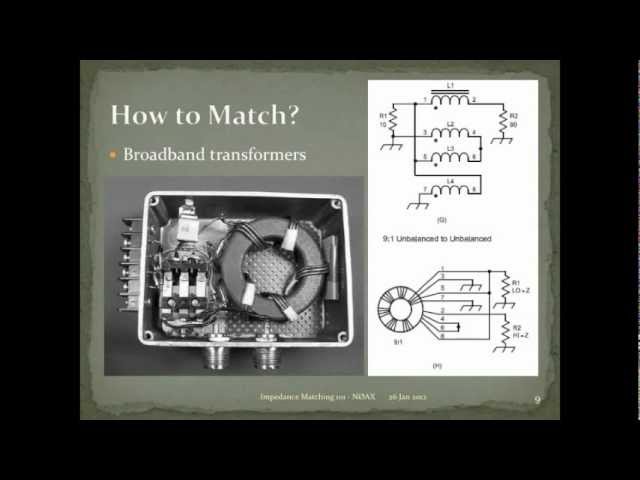
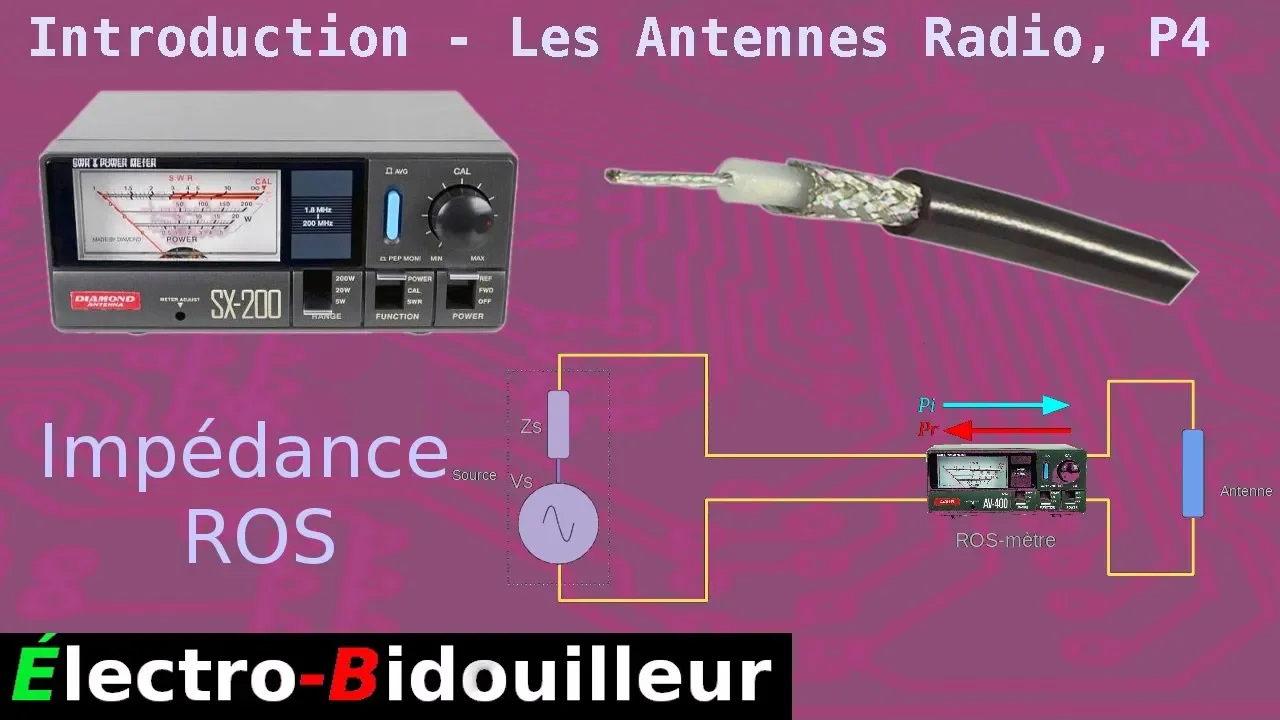
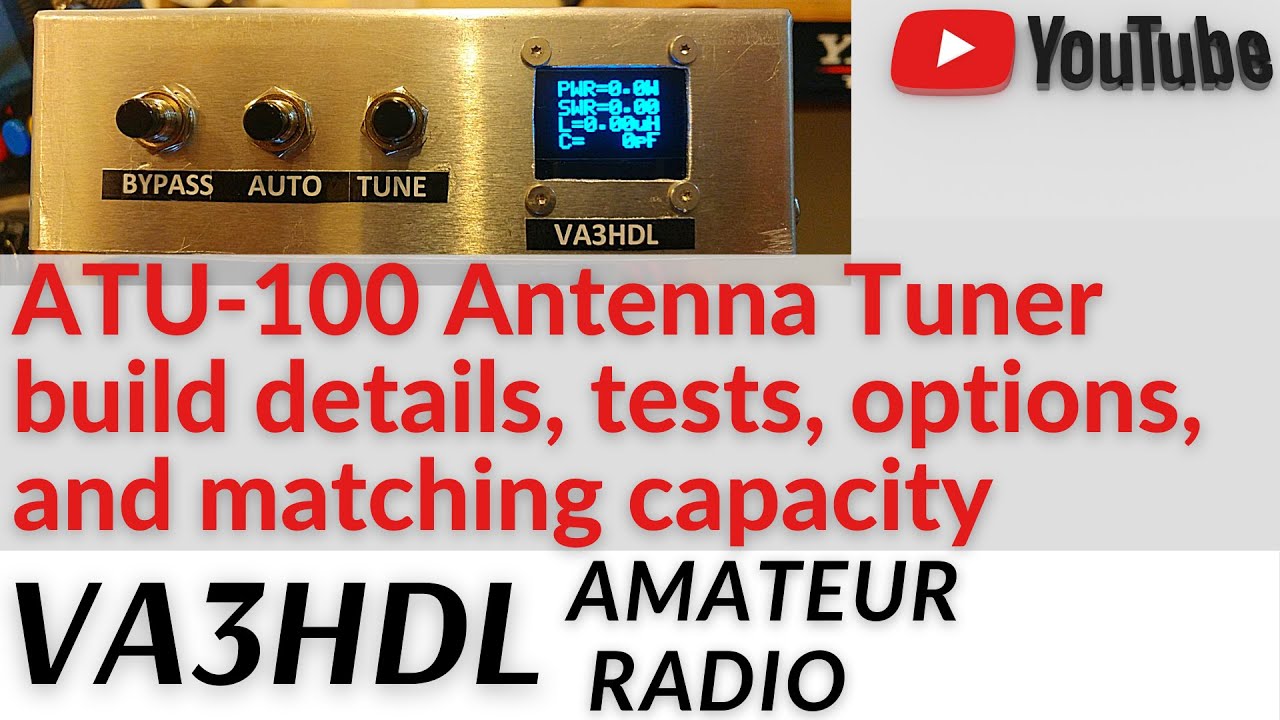
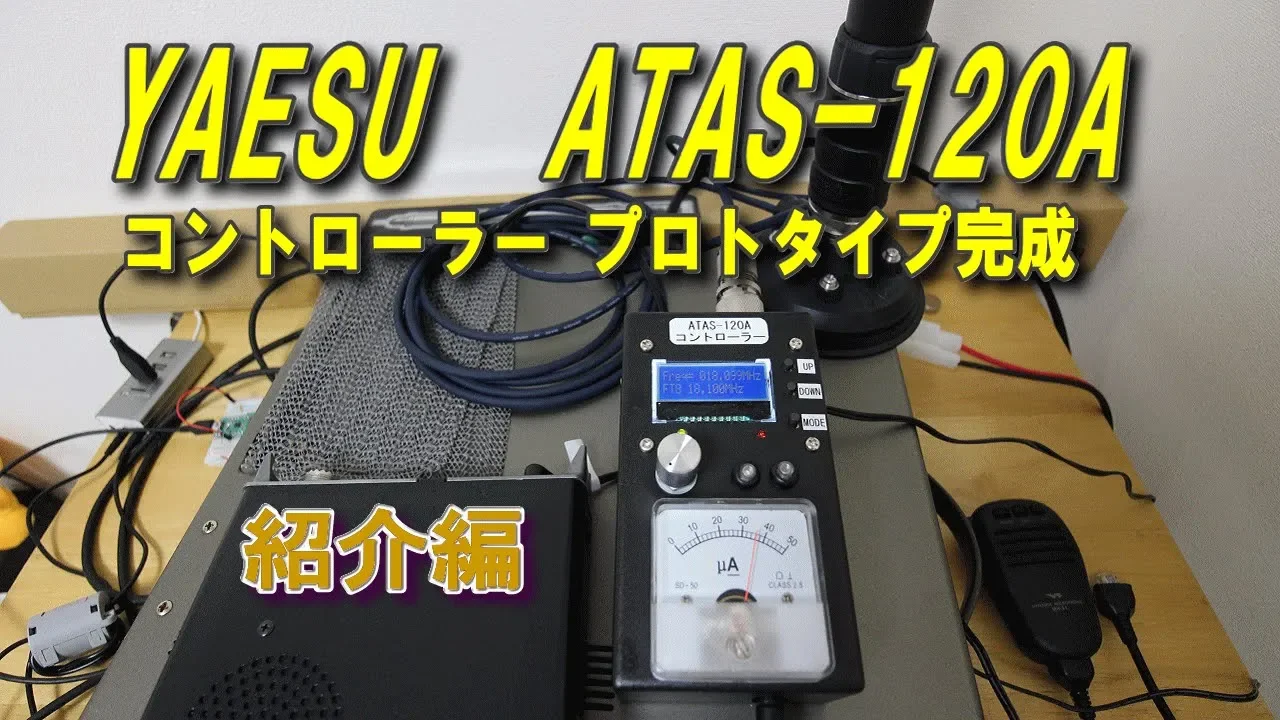

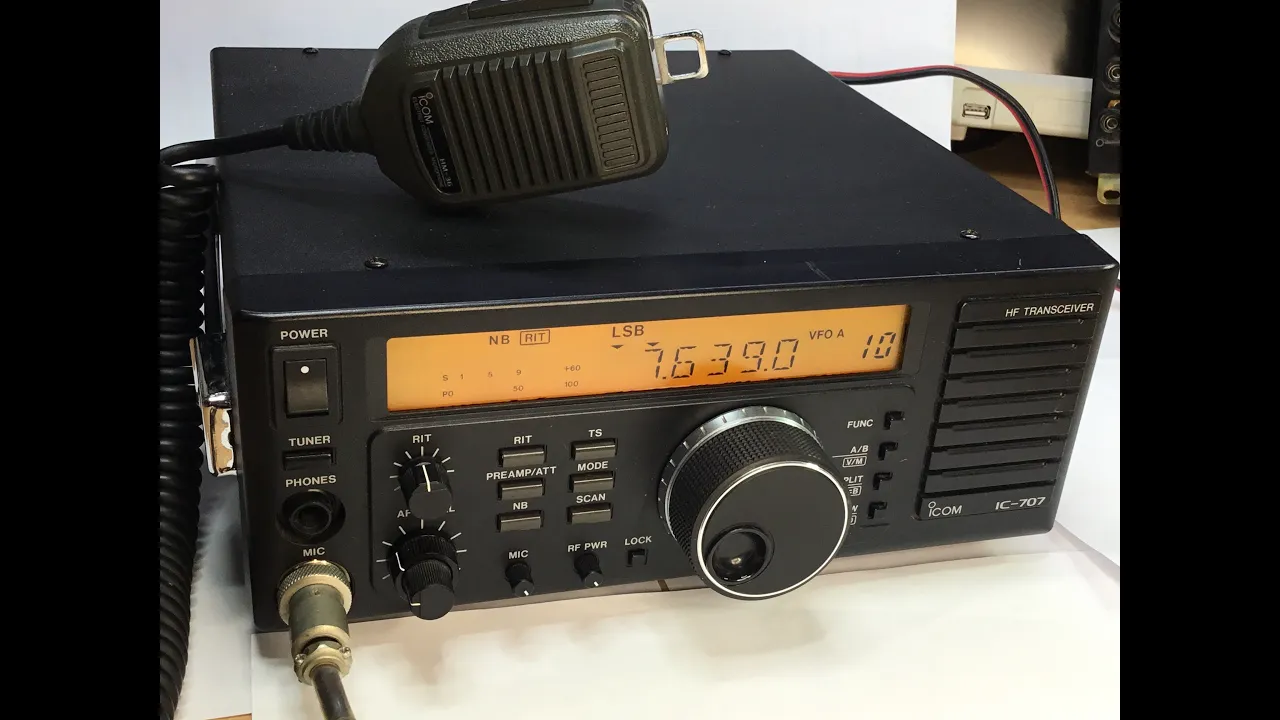

A Vector Network Analyzer (VNA) can visualize how an HF antenna tuner transforms impedance by displaying the reflection coefficient S11 in three formats: logarithmic magnitude, SWR, and Smith Chart, where adjusting the tuner's capacitor and inductor controls moves the impedance point toward the center (50 ohms resistive) to achieve optimal matching; after tuning at a specific frequency, sweeping the VNA reveals the SWR bandwidth of the antenna system across the operating band.
Visualizing Antenna Tuner Operation With a VNA and Smith Chart
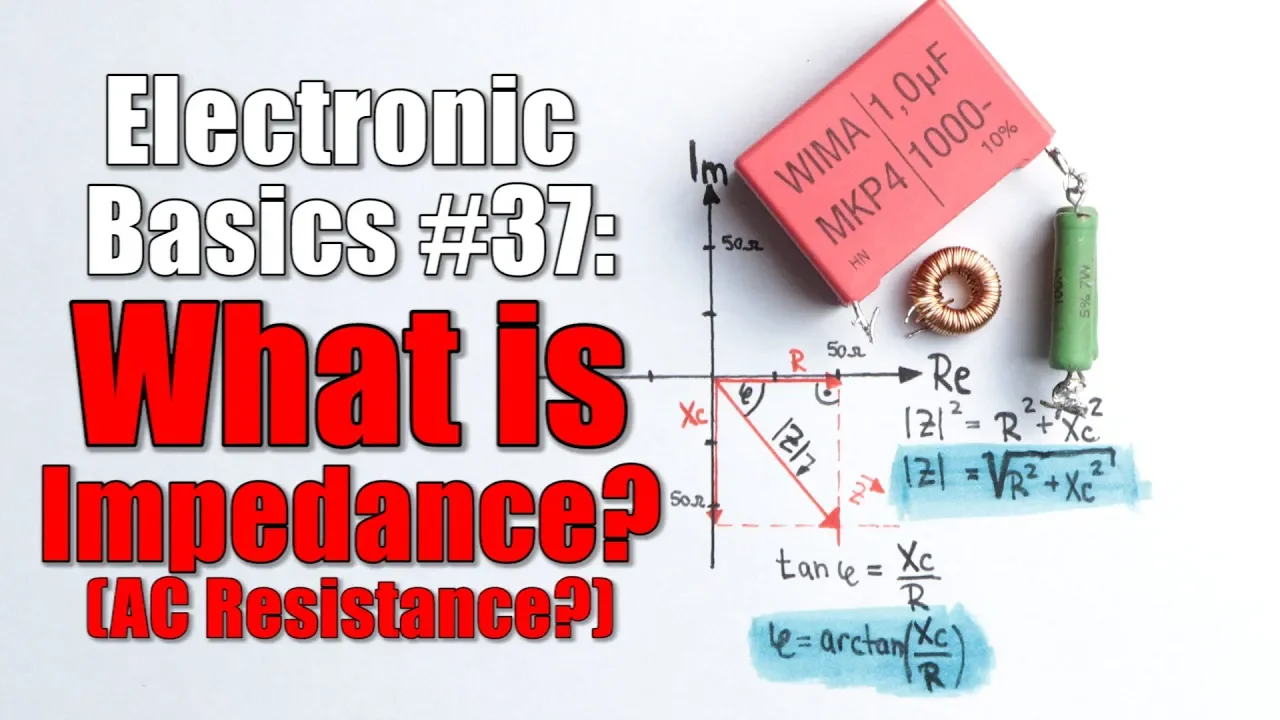
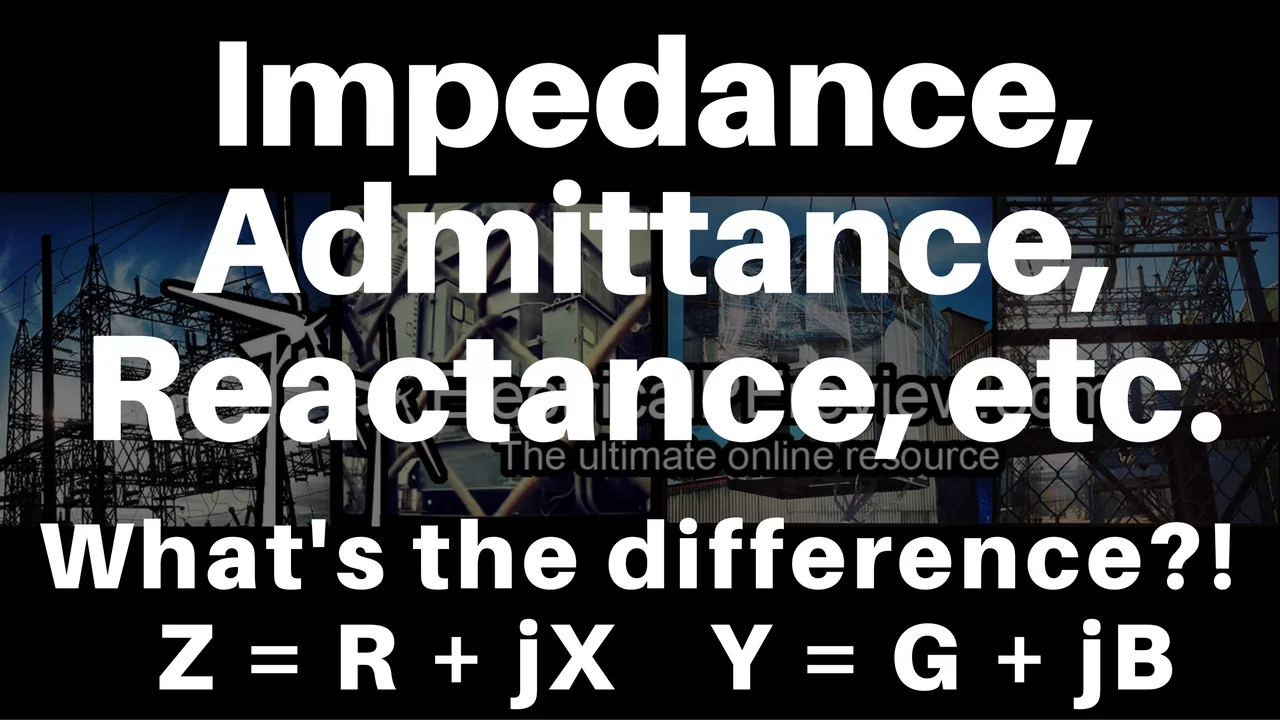
Added:Fundamental concepts of RF impedance, including resistance, reactance, and the mathematical representation of complex impedance (R + jX).
The principles of electromagnetic wave reflection, reflection coefficient (Gamma), and Standing Wave Ratio (SWR) in transmission lines.
Basic understanding of the Smith Chart layout, specifically how constant resistance and constant reactance circles map complex load impedances.
The physical purpose and components of an antenna tuner (such as L, T, or Pi networks containing inductors and capacitors).
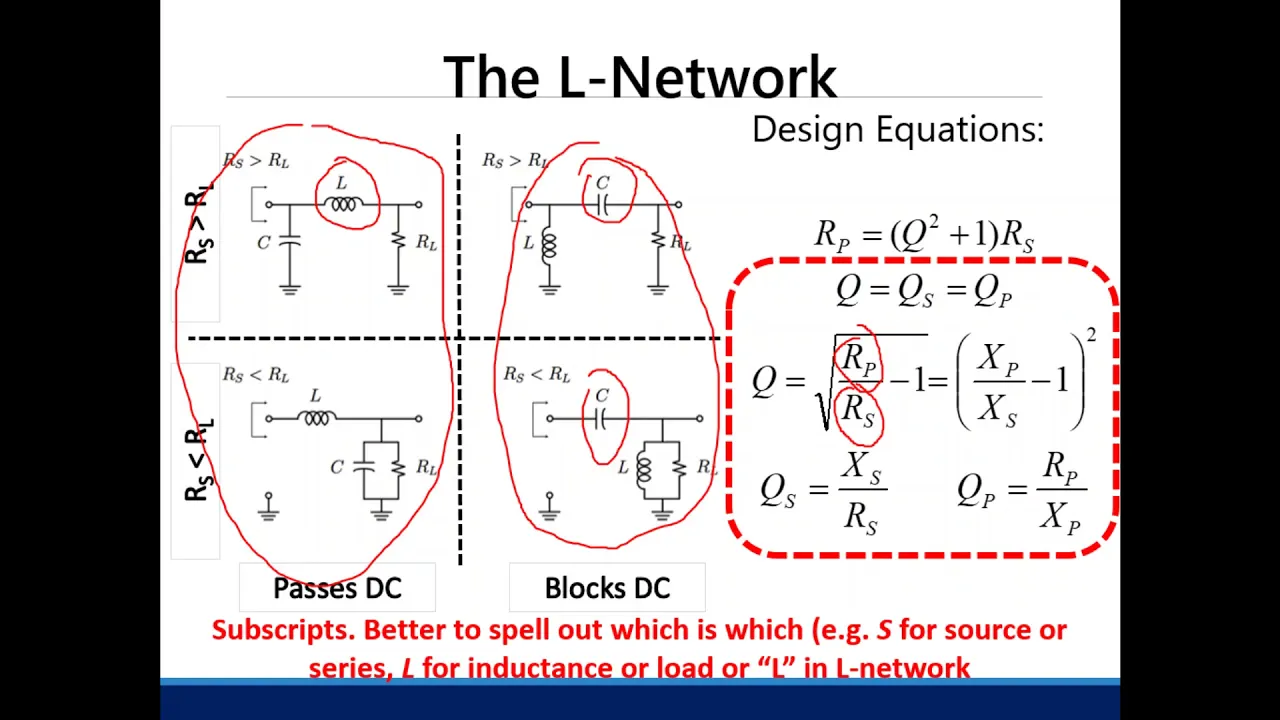
Hands-on design and calculation of L, T, and Pi matching networks for specific source and load impedances.
Advanced Vector Network Analyzer (VNA) calibration techniques, such as SOLT (Short-Open-Load-Thru), to ensure measurement accuracy.
Broadband impedance matching strategies to optimize antenna performance across a wide frequency spectrum rather than a single frequency.
The study of active and automatic antenna tuning units (ATUs) utilizing phase/amplitude detectors and microcontrollers.
53.9K views2.8Klikes5:51Original Release: 2017-07-17
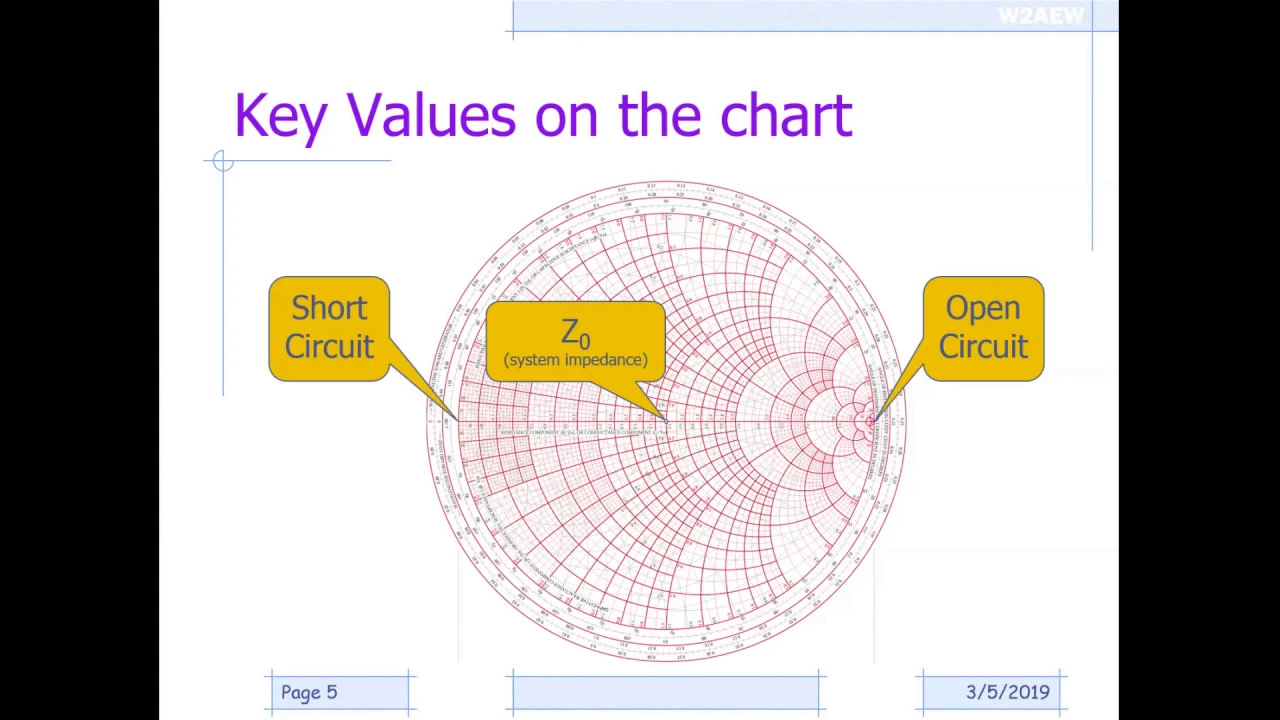
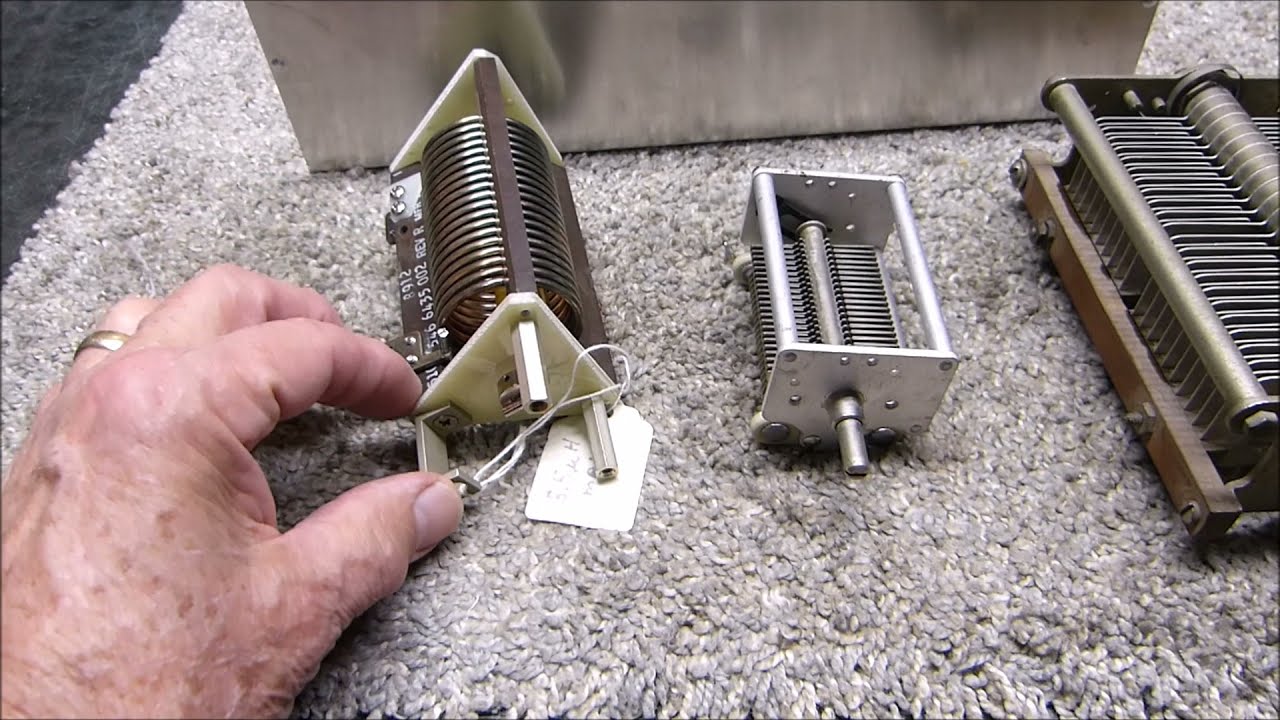
just a short video for fun from the shack here this evening to show how you can visualize the operation of an antenna tuner like this one here using a vector network analyzer and setting it up with a couple of displays each of which will show you the operation in a slightly different way so normally when you use an antenna tuner like this you're tuning up at a particular frequency so we're going to do the same thing with the VNA we'll set it up in the zero span in this case at 7.2 megahertz now the analyzer is set up with three displays but each display is really just measuring s11 the reflection coefficient but it's displaying it in three different formats down here in the lower right corner is the traditional logarithmic magnitude of the s11 but again we're in zero Spanish they're gonna have a flatline the reflection coefficient is also expressed as the standing wave ratio where SWR which is a the most common thing that hams will look at so I displayed that here as well and then thirdly we're also displaying the reflection coefficient as the complex impedance looking into the coax so this is what the transmitter would see on the Smith chart here at Smith charts just to quickly a way of displaying a complex number in this case complex impedance where we have essentially circles that represent constant resistance and we've got arcs that represent consequent reactants both inductive and capacitive reactance and the location of where you are on the chart tells you essentially the complex impedance so right now before we start adjusting the tuner we've got our marker sitting right out our single point at 7.2 megahertz and that's giving us a input impedance looking into the coax of 20 ohms plus J 38 ohms so an inductive thirty-eight ohms and a real part of plenty ohms and that's what that point represents now if I reach up and grab the capacitor control on the tuner I can see a couple of things I can move the impedance that's seen on the Smith chart kind of on an arc as we adjust that capacitor I can also see the return loss NSW our curves moving as well if I grab the roller inductor of the tuner and start adjusting that I can actually see myself moving along on the Smith chart as well as the other displays now our goal is to get the one-to-one SWR which will be achieved when the input impedance is right here in the center of the chart right at 50 ohms resistive so all we need to do is essentially adjust our controls to kind of get us there and you can see I adjust my inductor down my capacitor back here and get ourselves really close we're really careful here and the zero in to something very very close to just a 50 ohm resisted termination and if we look here now I'm at forty nine point seven ohms and about point four ohms of inductive reactance and if we tweak that a little bit more likely to get even closer okay and with ourselves very closely centered here we take a look at our SWR plot and we're sitting at one point zero zero eight two one and return loss is 47 DB so we've achieved a really really good match by simply tuning the capacitor and inductor on the tuner and visualize that a couple of different ways well now that I've tuned up at my desired frequency at 7.2 I've changed the VNA to give me a span of 400 killers so now we'll sweep from seven Meg to 7.4 megahertz which more than covers the 40 meter amateur radio band now of course on the Smith chart I can see the input impedance to my antenna system now what I mean by that is the antenna the tuner and the coax leading to the transmitter and this is what that impedance looks like over frequency and if I great I can drag that marker around and actually see what that impedes looks like at any frequency within sweep going back and forth okay of interest to most hams would probably be this plot right here which is showing me my standing wave ratio or SWR versus frequency I've actually put a pair of markers here at the two-two-one SWR points and this indicates that I've got something in the neighborhood of about a hundred and forty kilohertz of two to one SWR bandwidth so covering a lot quite half of the forty meter amateur radio band and of course of interest to most RF engineers would probably be just the log magnitude of the reflection coefficient which is shoving down here but all of these are essentially the same measurement just displayed a couple of different ways today's video was basically just for fun but I do plan on doing some more tutorials on the use of VNA for various applications in the future as well as it may be even some tutorials on the Smith chart itself you know an old tool that RF engineers have used for many years but maybe maybe a bit of a lost art these days in terms of how you can actually use it manually so people will cover that in some future videos as well anyway if you like what you see now give me a thumbs up if you haven't subscribed already please do so comments are always welcome and thanks again for watching see you next time
Up Next

9:24
CT Image Reconstruction: Back Projection, Filters, MPR & 3D Rendering
@will_creene
72.8K views•2021-08-23
30:32
Ultrasonic Transducers: Resonant Frequency Measurement and Horn Design
@imajeenyus42
229.9K views•2017-02-22

54:48
Smith Charts and the NanoVNA: Antenna Impedance and Matching Network Design
@w2aew
40.6K views•2022-02-24
33:39
How a Student's Question Saved a NYC Skyscraper from Collapse
@veritasium
22.8M views•2025-04-26
Related Study Plans & Knowledge Roadmaps
Structured learning paths in Engineering
engineering
Building Acoustic Levitators: Physics & Arduino
01The Physics of Sound and Standing Waves
02Piezoelectric Transducers and H-Bridge Drivers
03Arduino Programming: Generating 40 kHz Signals
+ 2 more learning modules
14h5 modules
Explore Roadmap
engineering
Building Peltier Cloud Chambers: Particle Tracks
01Cosmic Rays & Cloud Chamber Physics
02Thermoelectric Cooling (TEC) Fundamentals
03Custom Liquid-Cooling Loop Design
+ 2 more learning modules
18h5 modules
Explore Roadmap
engineering
Yagi-Uda Antennas: Modeling, Build & VNA Test
01Introduction to RF and Antenna Fundamentals
02Yagi-Uda Antenna Design Principles
03Antenna Modeling and Simulation in 4NEC2
+ 2 more learning modules
18h5 modules
Explore Roadmap
engineering
ECG Monitor Design: Op-Amps, Filters & Noise
01Electronics & Breadboard Basics
02Op-Amps and Instrumentation Amplifiers
03Bioelectricity and ECG Fundamentals
+ 2 more learning modules
18h5 modules
Explore Roadmap