



























Gel Permeation Chromatography (GPC), also known as Size Exclusion Chromatography (SEC), is an analytical technique that separates macromolecules based on their hydrodynamic size rather than molecular weight, using a column packed with porous gel particles where larger molecules elute first and smaller molecules penetrate deeper into the pores; the technique employs various detectors including refractive index, UV/Vis, light scattering, and viscometer detectors to characterize molecular properties such as molecular weight, intrinsic viscosity, and hydrodynamic radius, with three main analysis methods—conventional calibration, universal calibration, and advanced detection—offering progressively more sophisticated levels of molecular characterization.
Gel Permeation Chromatography Fundamentals (GPC/SEC Guide)
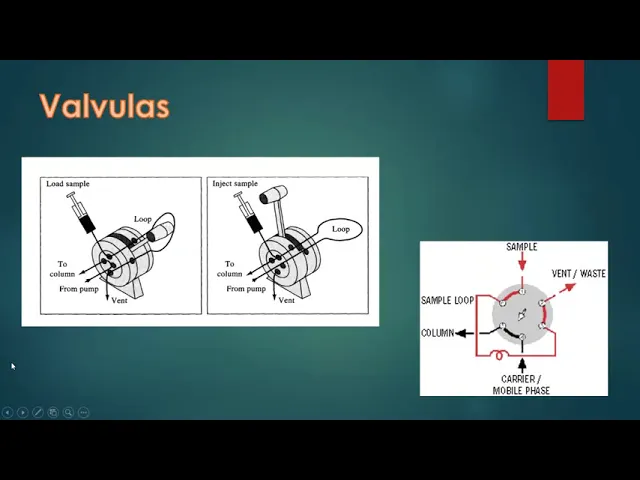
Added:an introduction to GPC in 30 minutes this presentation will include an overview of GPC what it is in some common applications then we'll explore chromatography the analytical technique that provides the foundation for GPC next we'll look at the detectors which are the devices that allow the users to see and observe the sample as it is analyzed after that we'll examine how that raw data is processed into molecular weight and many other types of characterization data that make GPC such a popular analytical tool and it will wrap things up first let's start with an overview of GPC GPC stands for gel permeation chromatography GPC is a type of size exclusion chromatography often abbreviated SEC while GPC refers to a specific type of SEC the two are very similar and are often used interchangeably as GPC is the most common type of SEC GPC SEC describes an analytical technique that is used to characterize macro molecules providing data such as molecular weight intrinsic viscosity and hydrodynamic radius these traits often affect the physical properties of the material and or the behavior of the particular compound and are of great interest to researchers production plants and manufacturers examples of materials frequently analyzed by GPC are natural polymers such as dextran kyosan and cellulose synthetic polymers including polystyrene polyethylene pylate and nylon and proteins such as oligopeptides antibodies and membrane proteins so what is chromatography the C in both GPC and SEC stands for chromatography which refers to a set of laboratory techniques involving the separation of mixtures chromatography involves passing a mixture carried by a mobile phase through a stationary phase which separates the constituents of the mixture based on differential partitioning between the mobile and stationary phases in the animation at the bottom a mobile phase is shown passing through the stationary phase which is usually located in a column if we take a sample mixture and load it onto the column the mobile phase will begin to move the sample mixture components through the stationary phase the sample mixture components will travel through the stationary phase at different rates based on molecular differences between the individual components this means the individual components exit the stationary phase at different times providing a separation of the mixture so what's unique about GPC and SEC size exclusion chromatography describes a class of chromatography that as the name suggests separates analytes based on their size SEC is a solution-based technique which means it uses a liquid as the mobile phase to carry the analytes through the CHR mography column as the mixture of analytes travels through the stationary phase of the column the sample components are separated according to molecular size with larger molecules eluding first it is important to remember that separation is based on hydrodynamic size not molecular weight so now we know that gpcs separates molecules based on size but how does it work well if we take a closer look at the stationary phase we can see that the column gel is made of particles that contain pores the presence of these pores is the key to making GPC work the separation process operates based on the diffusion or permeation of the analy molecules in and out of the pores on the gel particles of the stationary phase as we can see in the animation the largest molecules represented by the triangle spend the least amount of time inside the poorest gel particles the intermediate size squares can diffuse partially into the pores before moving to the next while the smallest circles can easily diffuse in and out of the pores and penetrate all the way in and thus require the most time to elute think of it like a bag of potato chips when you open a Brand New Bag the large chips are located at the top because they can't fit through the spaces to fall to the bottom however by the time you get to the end of the bag you're left with all the broken chips and crumbs that can fit through the spaces and have gathered at the bottom these Crumbs are the same as the smallest components of your sample like the circles shown here which spend the most time within the spaces and pores and elute last from the column on the right is the illusion profile for a column set showing the molecular weight range of the molecules this particular column set can resolve the resolution obtained during the analysis of a sample is dependent upon the specific GPC column set which brings us to GPC columns the chromatography process we've discussed occurs inside of the GPC column set ultimately good results come from good chromatography for which to obtain you need the appropriate GPC columns luckily there are many types of GPC columns available to fit your sample needs some common factors to take into consideration when choosing a GPC column set include mobile phase compatibility which is generally the primary concern molecular size and molecular weight range compatibility with your sample or functional groups present on your sample or alternately what is the chemical identity of the column gel and how many columns of which type do you want to use multiple Columns of the same type to increase resolution or columns in consecutive molecular weight ranges in order to expand the resolution range to highlight the variety of solvents used as mobile phases here are some of the types of GPC columns that melin offers T columns for thf or other organic mobile phases such as DMF chloroform and hexl isopropanol a columns for the analysis of General aquous polymers in a variety of aquous mobile phases P columns for the analysis of proteins in aquous Mobile phases high temperature GPC columns for analysis at elev temperatures and special D columns such as I columns which contain an inert stationary phase that prevents sample adhesion and cationic columns which have a cationic stationary phase in order to repel cationic samples shown here is a schematic for a complete GPC system The Columns and chromatography process we described are located in the center of the image the system components in line prior to the columns are necessary parts that keep the system running such as a mobile phase Reservoir a vacuum deaser to remove air from the mobile phase the pump to maintain mobile phase flow and the injection loop with optional Auto sampler that introduces a sample mixture onto the column set so now that we've injected our sample and used chromatography to separate our mixture we need a way to observe the individual components present which leads us to the detectors how we see our samples after the GPC column set does all of the hard work involved in the separation process we need some way to observe the effects of the chromatography this is where the detectors come in the detectors are individual devices that respond to different characteristics of a sample the more detectors we use the more information we can learn about a sample the most common detectors used in GPC are a refractive index detector a UV viz or photo diode array detector a light scattering detector and a viscometer detector various combinations of these can be used depending on the specific data desired the refractive index detector responds to sample concentration uvv or photod diod array detector responds to sample concentration and light absorption the light scattering detector responds to the sample's molecular weight and the viscometer detector responds to the intrinsic viscosity of the sample and solution which is influenced by the sample's molecular density next we'll take a closer look at each detector individually the principle behind the refractive index detector is that light travels differently through different mediums which is a phenomenon we see all the time in everyday situations such as a straw in a glass of water the light we see reflected off of the top of the straw travels in a straight line to the eye when it's uninterrupted however when the light travels through water and then air on a suad your eye the light is bent or refracted at the interface of the two mediums this is the exact same way a refractive index detector operates a refractive index detector works by using a light source to project a beam of light through a flow cell that has two sides to it one side contains just solvent and the other side has solvent and Sample the light will refract at the interface and is reflected by a mirror back to a set of photo diodes these diodes are at different voltages one is positive and the other is negative depending on whether the sample refracts the light more or less than the solvent the light will move more onto the positive or negative diode giving either a positive or negative Peak the amplitude of the signal corresponds to the concentration of the sample as well as the material's dndc value the dndc value or refractive index increment shown in the equation on on the left is a term that correlates the refractive index response to sample concentration and is a unique value for a given sample and mobile face pairing instead of using refracted light the UV Vis detector Works based on the principle of light absorption many chemicals absorb certain wavelengths of light leaving the other wavelengths of light to be reflected back to our eye that's how we end up with chemicals of different colors the colors we see are from wavelengths of light reflected back that exist in the visible region there are also many wavelengths of light that are absorbed or reflected by compounds that we are unable to see these are the ultraviolet or UV wavelengths UV Vis detectors are commonly used particularly for protein analysis a limiting factor for UV Vis detectors is that the material being analyzed must have a chromophor in order to produce a signal UV Vis detectors work according to Beer's Law which is why they are responsive to sample concentration and can be used as a concentration detector in a GPC setup most uvvis detectors are single Channel detectors which measure one wavelength at a time a photo diode array or PDA detector measures all wavelengths simultaneously so the user can choose which wavelength to view after data has been acquired it is important to note that when working with UV Vis detectors the dadc term relates to Signal response to sample concentration just as the dndc value does for refractive index detectors light scattering detectors are based on the fact that when light from an incident beam hits a molecule the light is scattered and most importantly the intensity of this scattered light is directly related to the molecular weight of the molecule while all measurements from light scattering detectors operate by observing the intensity of the scattered light there are different ways those detectors can be arranged this leads to a few different light scattering detector options shown on the left is a scheme of Mal's dual angle light scattering detector in which a right angle detector and a low angle detector are combined to provide a direct measurement of molecular weight for samples of all sizes and molecular weights on the right is a general scheme of Mal's multi-angle light scattering detector over the next few slides we'll look at each type of light scattering detector in more detail it is important to remember that the light scattering detector response is most strongly affected by the molecule's molecular weight the right angle light scattering detector as the name suggests positions the detector at a 90° angle from the incident beam this detector works best for relatively small molecules roughly smaller than 15 nanom because they scatter light isotropically or the same in all directions since the intensity of the light is the same in all directions the angle of observation becomes Irrelevant this is visually depicted by the partial Zim plot on the bottom right of the screen in which the molecular weight observed is the same regardless of angle this consistency means that the molecular weight of a molecule can be determined directly by observing the intensity of the scattered light at any angle therefore the right angle light scattering detector is optimal in this case because it provides the least amount of Base noise as a result of its orthogonal placement relative to the incident Light Beam thus providing the best signal to noise ratio the low angle light scattering detector positions the detector at a 7° angle from the incident beam this location is important because when molecules do not scatter light isotropically meaning that there is an angular dependence on the intensity of scattered light then the intensity of scattered light observed at the zero angle is the most accurate measurement of molecular weight of course having a detector at the zero angle is Not Practical as the detector would observe the full blast of the incident Beam by placing a detector 7° off of the incident beam the low angle light scattering detector can make the most accurate single direct measurement of molecular weight while this low angle light scattering detector offers the best method of directly measuring the molecular weight of macro molecules it is especially important for materials larger than 15 nanm this is because those relatively large molecules do not scatter light the same in all directions due to constructive and destructive interference since the intensity of scattered light observed depends on the angle of observation as shown in the partial Zim plot on the bottom right of the screen it is critical to observe the scattered light as close to the zero angle as possible another method of determining molecular weight from light scattering measurements involves the use of a multi-angle light scatter ing detector previously we discussed how not all molecules are isotropic scatterers and therefore the intensity of scattered light is not always the same at every observation angle the low angle light scattering detector obtains accurate molecular weight by observing the light scattered as closely to the zero angle as possible an alternate method is to observe the light scattered at numerous angles hence to name multi-angle light scattering and then use the partial Z plot to extrapolate back to the zero angle to determine molecular weight the principle behind the viscometer detector is that a solution containing dissolved macromolecules will be more viscous than the solvent by itself comparisons of the two lead to a variety of viscosity values including intrinsic viscosity the four capillary viscometer allows the intrinsic viscosity of a sample solution to be measured directly this is done by observing the differential pressure Delta P or DP p and the inlet pressure or IP those two pressure measurements allow for the specific viscosity of the sample solution to be obtained intrinsic viscosity is the specific viscosity of a sample solution at infinite dilution and is usually determined by obtaining the specific viscosity at varying concentrations and extrapolating back to zero concentration however since the concentration of the sample solution in GPC is very low it is close enough to zero concentration that the specific viscosity determined is essentially the intrinsic viscosity of the sample here is an animation of what happens in the viscometer as a sample passes through initially there's only mobile phase in all capillaries which provides a baseline reading and a differential pressure of zero when the sample is introduced it is split between the positive and negative sides of the viscometer bridge the negative side of the viscometer bridge shown here is the top half contains a delay Reservoir which holds the sample and allows the solution pressure of the sample in the positive side of the viscometer to be compared to that of the solvent on the negative side of the viscometer this creates the positive peak in the DP signal which corresponds to the sample the sample elutes and the viscometer signal returns to Baseline until the sample that has been held in the delay Reservoir finally begins to elude because this increased pressure is now on the negative side of the viscometer a negative P begins to form in the DP signal once the sample elutes from the delay Reservoir the viscometer bridge now contains only a mobile phase and the DP signal of the viscometer returns to Baseline this slide provides the equations that dictate the response of each detector all detectors are affected by the amount of analyte present which which is represented by the concentration and injection volume terms in each equation the K term in each equation are the individual detector constants and as such are not sample dependent this leaves the underlined term in each equation which is the parameter that most strongly affects each detector's response the concentration detectors the refractive index and uvv or photo diode array detectors are most sensitive to the dndc and dadc values respectively these terms correlate the sample concentration to the detector response if a sample has a high dndc or dadc value then it is likely that it will provide a strong detector response for the light scattering detector there are two key terms the dndc value which appears as a squared term in the Zim equation and the sample's molecular weight while both terms certainly have an effect on the resulting signal as long as there's an adequate dndc to observe the sample with the refractive IND index detector then the light scattering detector signal will respond most strongly to the sample's molecular weight the viscometer detector responds most strongly to the intrinsic viscosity of the sample solution if a partic particular sample does not produce a strong viscometer response that doesn't necessarily mean there's anything wrong with the detector small dense materials do not produce a high intrinsic viscosity and would therefore have a much weaker detector signal than a sample of low molecular weight that is well solvated and expanded so now let's take a look at the analysis methods or how data is calculated so now that we have all of that wonderful raw data from the detectors how do we turn that into meaningful information that helps us characterize our sample there are three main types of data analysis and each provides a different level of molecular characterization the first analysis method will discuss is conventional calibration which involves the use of a concentration detector to build a calibration curve with a series of Standards the sample is then measured against this calibration curve to provide relative molecular weight values the second analysis method is universal calibration which uses a concentration detector and a viscometer detector the addition of the viscometer detector accounts for the difference in molecular size and shape between the standards in the sample Universal calibration provides intrinsic viscosity and true or accurate molecular weight values the third analysis method is Advanced detection also known as triple or Tetra detection depending on which detectors are employed Advanced detection uses a light scattering detector and a viscometer in conjunction with at least one concentration detector in order to provide intrinsic viscosity and absolute molecular weight values conventional calibration relies on a single concentration detector either a refractive index or UV viz or photo diod aray detector because of this single detector setup conventional calibration is the most economical GPC analysis method in order to perform a conventional calibration a series of well-characterized standards must be run these standards should cover a wide size and molecular weight range so that the entire bre of your column resolution range is mapped once the molecular weights of the standards have been entered and assigned to the corresponding retention volume the software will determine the best fit line which will serve as the calibration curve when a sample is analyzed the molecular weights are extrapolated from the calibration curve based on the retention volume of each point it is important to note that conventional calibration is based entirely on retention volume since the molecular weight values obtained through conventional calibration are extrapolated from the calibration curve the values calculated are relative to the standards used this is why you'll often see data presented like sample a had a molecular weight of 10,000 dot relative to polystyrene standards since conventional calibration data is based on the retention volume of a sample every GPC system will have a unique calibration curve even when using the same standards parameters such as columns mobile phase flow rate and temperature will affect the retention volume of the standards and thus the resulting calibration curve likewise every polymer type has its own calibration line remember it separation and thus ution order is based on hydrodynamic size if polymer a and polymer B have different structures then a 50,000 Dalton sample of polymer a will have a different size and thus ution volume than a 50,000 Dalton sample of polymer B even though they have the same molecular weight therefore a calibration curve from standards of polymer a will give different results than a calibration curve built from standards of polymer B additionally two samples that have the same molecular size but different molecular weights will appear identical using conventional calibration along those same lines the accuracy of data from conventional calibrations depends on how similar the molecular structure of the sample is is to the standards the closer the molecular structure of the standards and Sample are the more accurate the data will be and last the data that's acquired from conventional calibration is limited to molecular weight moments as shown to the left since conventional calibration uses only a single concentration detector no viscosity size or structural information is available next Universal calibration uses the combination of a single concentration detector either a refractive index or a UV viz photo diot array detector with the addition of a viscometer detector the addition of the viscometer detector is important because back in 1967 Beno used a relationship between hydrodynamic volume molecular weight and intrinsic viscosity to show that the calibration curve for Polymers of different types can merge into a single calibration curve remember GPC separates based on molecular size or hydrodynamic volume therefore if we think of ution volume is essentially being hydrodynamic volume we can plot molecular weight times intrinsic viscosity against hydrodynamic volume this means that all polymers regardless of structure and shape will fall along the same calibration curve in addition to providing intrinsic viscosity and the related size information a universal calibration curve eliminates the need to have standards that are the same as your sample in order to calculate accurate molecular weight data since the molecular weight values obtained through Universal calibration account for molecular structure and shape the values calculated are described as true or accurate regardless of the standards used even though the identity of the standards doesn't matter a calibration curve is still required and therefore every GPC system will have a unique Cali calibration curve parameters such as columns mobile phase flow rate and temperature will still affect the resulting calibration curve every polymer falls on the same Universal calibration curve which means that the accuracy of the data is improved from conventional calibration results and last the data available includes molecular weight moments just like conventional calibration but now has the added benefit of providing intrinsic viscosity Hydro Dynamic radius and marink parameters Advanced detection also known as triple or Tetra detection introduces a light scattering detector to the array this combination of detectors provides complete characterization of your GPC samples if we revisit this list of equations you can see that each detector responds to a unique combination of factors but more importantly each detector tells us about one different aspect of the sample so the refractive index detector provides the sample concentration information the uvv or photo diode array detector allows sample concentration and absorption information to be obtained the light scattering detector offers a direct measurement of the sample's molecular weight independent of a column calibration curve and the viscometer detector measures a samples viscosity in solution which is then used to calculate the intrinsic viscosity and hydrodynamic radius of the sample and as you can see all the detectors operate simultaneously providing a wealth of data from a single injection so Advanced detection provides absolute molecular weight values meaning no calibration curve is necessary the molecular weight is calculated independently from the light scattering detector a single narrow standard is used to determine instrument constants and detector offsets the accuracy of the data is independent on the identity of the standard and each detector tells a different piece of the story sample concentration from the ri and uvv or photo diod Ray detectors sample viscosity and size information from the viscometer detector and molecular weight from the light scattering detector and with Advanced detection there is an incredible amount of data available from a single injection molecular weight moment intrinsic viscosity hydrogen damic radius radius of gyration structural information concentration recovery and potentially absorption profile and compositional Analysis and now to wrap up with some conclusions so GPC is the most common analytical tool for characterizing natural and synthetic macromolecules from materials as diverses Plastics and rubbers to proteins and peptides GPC is a technique that separates the analy molecules based on molecular size it is part of a larger class of techniques called size exclusion chromatography a variety of detector configurations can be used usually employing some combination of refractive index uvv or photo diode array light scattering and viscometer detectors in conventional calibration Universal calibration and advanced detection are the three prominent analysis methods in order of increasing sophis ation used to obtain different levels of molecular characterization thank you for listening for more information please visit www.vin.com [Music]
Up Next

FTIR Analysis | Fourier Transform Infrared Spectroscopy
@labtesting
459.5K views•2013-05-10

Biocatalysis and Catalysis in Islatravir Synthesis | Merck Webinar
@SCIwheresciencemeetsbusiness
675 views•2020-10-08
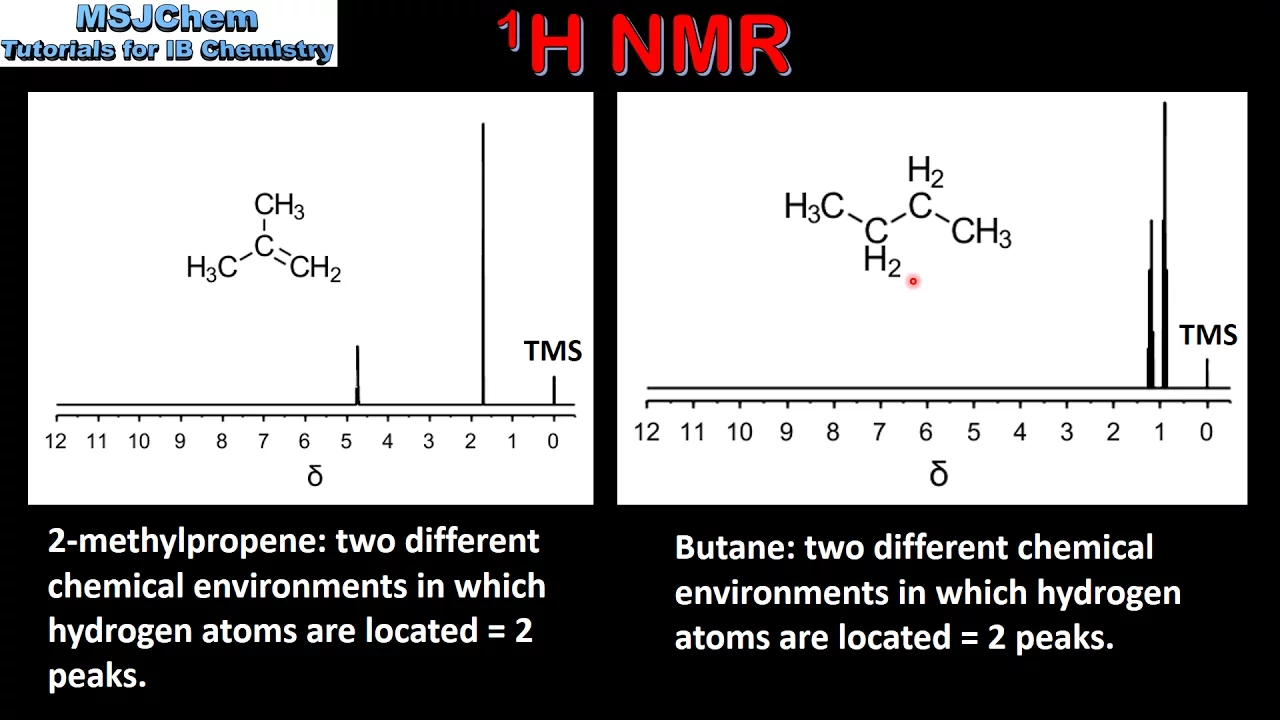
1H NMR: Determining Number of Peaks from Structure
@MSJChem
59.2K views•2017-04-06

Edible Water Bottles: A DIY Guide to Sodium Alginate Spherification
@ryan
10.5M views•2019-06-21
Related Study Plans & Knowledge Roadmaps
Structured learning paths in Chemistry