










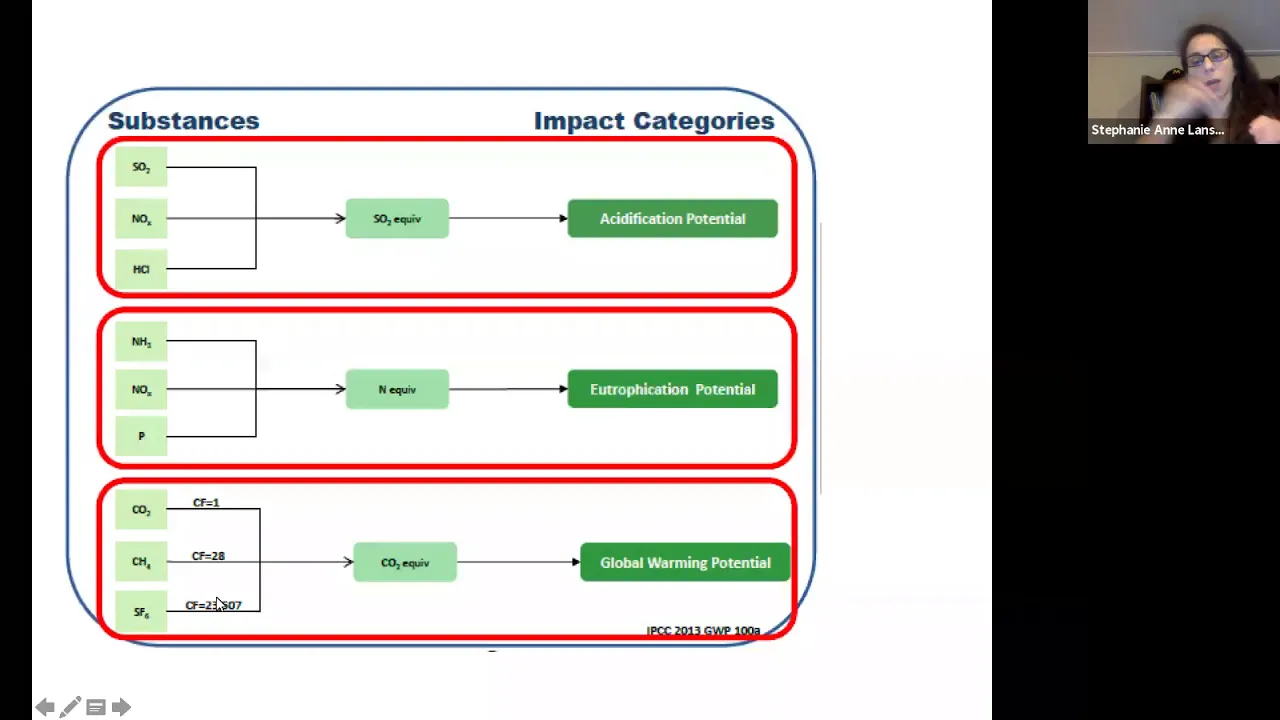






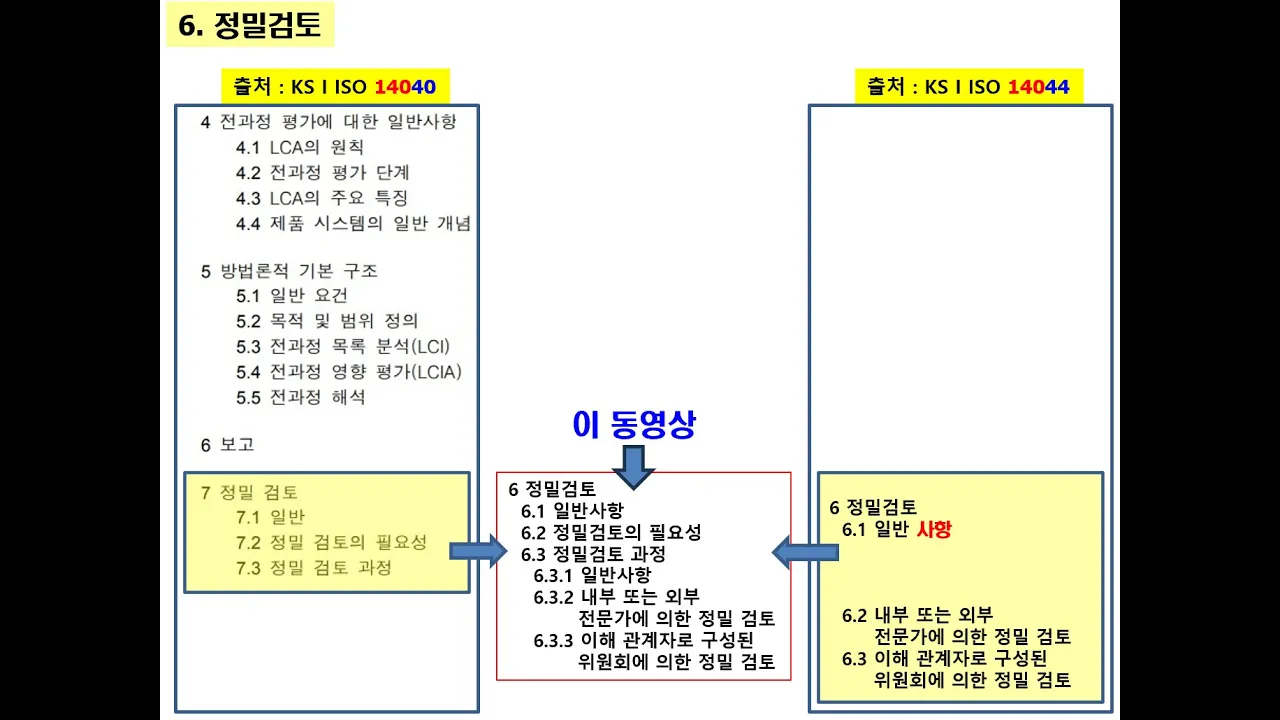

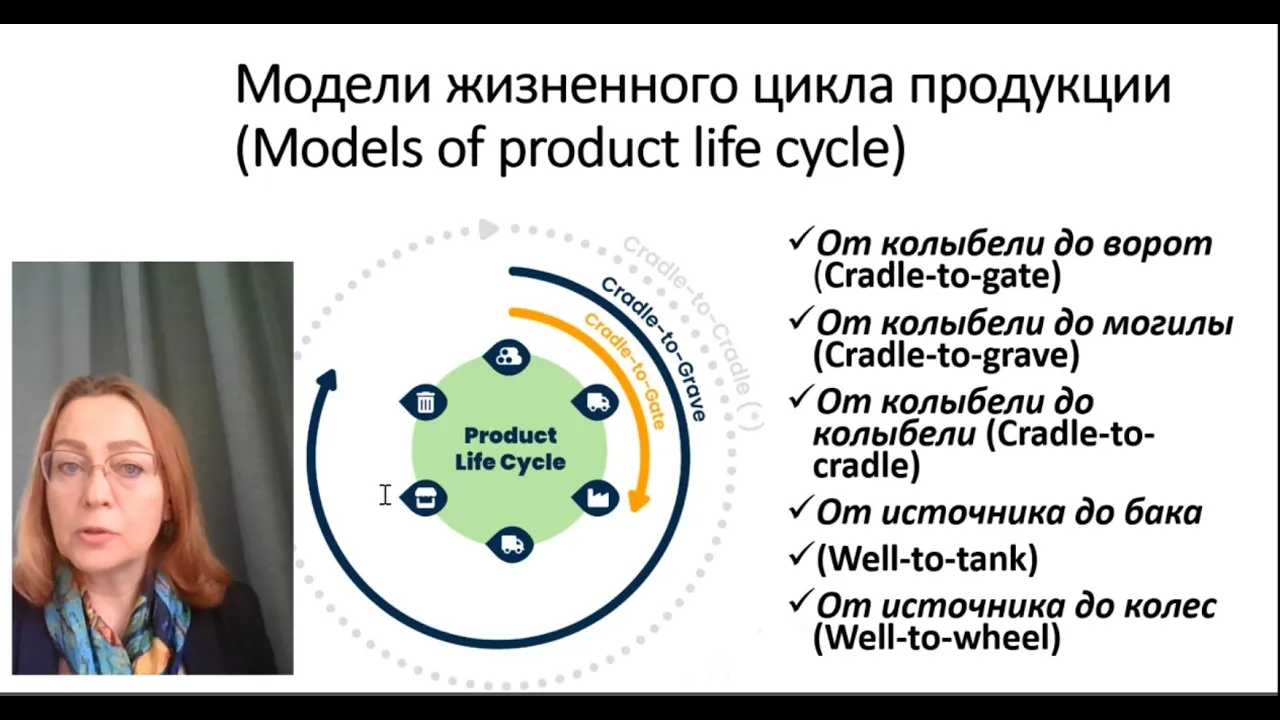


Life Cycle Assessment (LCA) is a systematic methodology for quantifying environmental impacts of products by following four stages: (1) Goal and Scope Definition, which establishes the study's purpose, functional unit, and system boundaries; (2) Inventory Analysis, which compiles and quantifies all inputs and outputs throughout the product's life cycle; (3) Impact Assessment, which evaluates potential environmental impacts using characterization factors; and (4) Interpretation, which analyzes results in relation to the study's objectives while conducting sensitivity and uncertainty analyses. The methodology requires making numerous assumptions about supply chain configurations, manufacturing processes, and usage patterns, which introduces inherent uncertainties that must be carefully managed and communicated.
Life Cycle Assessment Steps and Applications in Green Supply Chains
Added:the following content is provided under a Creative Commons license your support will help MIT open courseware continue to offer highquality educational resources for free to make a donation or view additional materials from hundreds of MIT courses visit mitop courseware at ocw.mit.edu okay let's uh let's go ahead and get started we're actually uh we're not going to be joined by our uh our friends in Zer Goa today but we're still going to be recorded so still have to stay on our best behavior I guess so uh today we're going to go through uh life cycle assessment and talk about that and how we use it to uh quantify environmental impacts of uh products uh the goal today pretty simple first is to let you understand the steps in an LCA exactly what is the methodology uh how it's used uh you know the specific steps in it um and what they mean what sort of goes into each of them uh but really what we're also going to spend time on is understanding the decisions that go into that that that using the uh the hand dryer uh study as sort of an example to go through and understand you know how you link all of these different steps together what it means in understanding you know the decisions that you have to make as a as a person doing this or as a company in terms of you know setting the boundary understanding what your goal is is and uh all the uncertainty that goes along with all the decisions and assumptions that you have to make along the way so last time when we were talking about carbon footprinting we were talking really about things that go on at at the corporate level um that they're within the boundar is essentially drawn around your organization and we talked about you know you could use those internally doing things like trying to evaluate different part departments in your organization uh tracking your performance setting up some kind of internal metric uh all the all the standard sort of things you would do for financial cost you know quality uh sustainability really just one extension of that but also talking about it's relation to external uh you know you're publishing a corporate CSR report participating in programs like the carbon disclosure project uh reporting to Regulators investors Etc and one of the things we talked about was that uh the difficulty in comparing between organizations that might be doing different activities even though that they operate in sort of the same uh business bus space they might produce some of the same products it's very difficult to compare two organizations based on their organizational level reporting uh because they might control different aspects of the supply chain they may do uh different things even if they're producing the same product So today we're going to talk about sort of the the the lower section here which is how we do a product or a supply chain level comparison and some of the same ideas still apply that there might be reasons to do this both internally and externally internally right trying to understand where in the supply chain your your uh environmental impact is what are the the things you might have control over that you might be willing to uh that you might be looking to change uh exploring especially uh differences in the design or changes that you might make to reduce those impacts but also it has an external component as well namely around things like product labeling or making claims environmental claims about your product right trying to convince consumers or uh your customers that your product is better than ones that are uh on the market and again there's going to be some slight differences that go on between you know what you're trying to do and how you might uh go about it so with that we'll we'll we'll sort of start off with talking about this hand dryer study and then go through the the the bits and pieces of it individually that uh this really is getting into it's a pretty good example of something that gets at the the fundamental questions of how you compare different products and different things that uh we don't in this case we don't really care much about who owns Which piece of of each of these products right we're looking at the the product as a whole from beginning to end and trying to come up with way of uh comparing them and you know this is the the results and from some of the material that came out of the publication of this study but uh right it requires a different type of analysis and sort of a different level of work so has has anybody in here done a life cycle assessment before if you what what kind of product or or what did you look at um I used to work at a company that made some food products and we looked at um three of our SKS that we made for Walmart they asked us to specifically do a life cycle assessment three different products there just to understand what the Yeah I mean one of the larger I mean they were working with us and numerous other companies but they were yeah trying to get a sense of what the larger impact of individual like items that They Carried was in different departments over the course of the and did you actually do the were you responsible for sort of I did a p like a large portion of the data collection for the stuff we were most directly irresponsible for it was was kind of broken into chunks like so a major part was like Packaging and then there was like the food that went in the packaging and so I was kind of working with all the different groups who knew the most about those respective portions to then draw the data from them and put it together kind of cohesively how about anybody else uh anybody read previous studies like this before or or seen anything like like this before well I had actually read this one before uh we were working on the eslab project um and wanted wanted some guidance on the choice of materials so they said LCA but when when we got down to it it was actually just a material so it was not the whole what were some of your impressions about it after after reading through this I thought it was strange of them in the beginning to say that they were going to do a full life cycle assessment including Transportation costs and then two sentences later later they said they were going to ignore the entire supply chain and just focus on doing like an Apples to Apples comparison of the performance and they sort of black booxed all of the dryers into uh the same sort of process in China and I thought that you know like we weren't necessarily getting who maybe was the real Champion between Dyson and Excel because if perhaps one of them happens to have uh Manufacturing in the United States and they're getting a large Transportation cost like led into the cycle that maybe doesn't exist so I don't I don't really know why they decided to go that route it seems like they went through all of the mash Antion for the paper towels so it wouldn't have been maybe that difficult to get it for the other companies as well so that they actually did the the real full life cycle cuz otherwise it seemed like they should have collapsed the scope if they only wanted to do performance and leave the the Upstream part of the supply chain out of it so right so they they didn't really ignore the supply chain they more just standardized it in a sense right because they they did include all of those things that go on but they didn't model the exact supply chain that each specific product might have taken right so what what was the reason for that they they mentioned why they did it in there they said they wanted to put them all on equal footing as part of the supply chain but it seems like not putting them on equal footing is sort of the purpose of the life cycle to see who's actually who actually has the better process right actually didn't matter uh they had a figure that explained if these you know these different um devices were manufactured in Malaysia us or China it it there's very little difference across them right we'll we'll talk back that because as we read through there there was a lot of assumptions that they had to make going along right so what uh what might have been one of the reasons they had to make that assumption about the about the supply chain about taking them as had the data available and they determined that you know they could spend a year trying to find the data but in the end it would have made a difference and they want to go through the study you know and finish it anyways right in in essence that if you didn't have all of the information for all of the products then you you really had two choices which was to perhaps go spend the time trying to identify everything right the the exact path that all of those products took in their supply chain the other would be to try to ignore that piece and put them on a sort of standardized setting to to do the comparison with and then come back later and test some of those assumptions and that was the that was sort of the uh the approach that they took with this one what were what were some of the other areas that stood out the sensitivity analyses were majority of the paper yeah so so the the paper itself was like 25 pages and then there was like 80 pages of sensitivity analysis and whatnot at the end yeah and there were a lot of assumptions and understanding which of the assumptions had more risk uh and what I was really struck by too was the fact that so much of the data was coming from either the company themselves or from other studies and there was a point at the end of the paper that said they didn't have access to the writers authors or practitioners who prepared those studies so just think that the Gap they made a lot of assumptions based on gaps of information but even the information that they do have I called into questions some the viability or accuracy of it so access to data was something that that came up a number of times right you saw there were there are a number of previous studies that had been done and you kept probably noticing the references throughout the document of every time that there's there's some assumption or some claim made most of them were being traced back to previous studies that had been done before even if you have access to data the thing also is that data changes and you get updates and you get more data so I felt that the LCA is true at some point but it's very it's Absol very quickly MH yeah say it's static right it's it's a snapshot of a point in time of a specific configuration of the supply genis my frustration with it was the single most important variable it's how long people take to dry their hands or how many paper towels they use and they had no real data on that right it's just completely made up because you can't really get that kind of data because you can't put cameras in a bathroom and you can't put someone in there without affecting their behavior something so that the joke that they had the study authors are here at Mi it and the material systems lab is that they thought about going out to the airport and just sort of standing in the bathroom with a notepad and you know tracking people but figured that might get them thrown out by security pretty pretty pretty quickly so yeah so the uh in some sense this comes back to the the idea of access to data right that they um uh you're making these assumptions because you you lack the data that if you had gone through and and done some of the studies and things like that uh actually observe people you might understand uh how exactly it is you know what is the aage hand drying times things like that the thing they talked about like the lifetime of the dryer which they had is 5 years and thought that seem kind of low like it seems like fers would be pretty frequent for you know a building manager to change out their dryers is that time Until It Breaks or is that the time until they recommended yeah did it said in there anybody notice why why they chose five years that's the that's what the warranty is so people throw it out if it's working fine yeah so I'm going to one this goes back to uh your first point about the uh what they chose the configuration of the supply chain was important right so they had uh that that and and this goes back to if we're taking a static snapshot of something that uh all the different permutations and all the different combinations might be difficult to do so you have to start making some judgments about the configuration of the supply chain and so they did that in this case by assuming they all came from China except for the the the towels which they came from the US because that's uh sort of the industry standard so um that that's the second one that you know these are sort of related to each other that uh as as you start digging into it you start running into all these areas that you could do right things differently and there's sort of all these different variables that go into it at some point uh you have to start making some some assumptions and some limitations to to uh try to do better on it did any of you think any of these uh uh I mean they did some sensitivity analysis but uh which ones do you think would significantly have affected the outcome or were there any that usage data to me was just a huge Factor because if you looked at the the outputs I mean it was the overall ranking of the product was so largely driven by what was said what was estimated to be your usage so and that but that was again one of the least of effectively tracked or you know easily quantifiable metrics so to me that was just sort of a pole yeah going along those lines I think that it was um the number of papers or the um the mass of the papers that that is used for um when usage um so that was that had a significant impact on how big the greenhouse the greenhouse um the gwp uh for the P towels uh have um compared to all the others um so that was a big assumption too they made some big assumptions on the uh the hand dryers but also the P Tow and this in in some sense this gets back to sort of the again right there are different bathrooms have different types of paper towels and so identifying one paper towel uh that you're going to choose to be represented of could be quite difficult to doer also called out the electric grid uh assumptions both in the manufacturing and the use they had pretty big impacts the manufacturing for the paper towels so the paper towels if they weren't made in the United States and they weren't made on the average that could have a huge impact and likewise the usage um depending on where it was being used the grid would have a big impact on the electric ders so if you were accelerator right which came in probably is the most similar in terms of products that it it would be competing with right I don't know if you you've used the accelerator dryer before I but it just really powerful uh heated air coming out a little bit different setup but right it it generally in the in the results showed as the the second best after the Dyson one but probably their direct competitor so what would your response be if you were accelerator and you saw Dyson sort of promoting this study accelerated was made in the US and Dyson was made in Malaysia so you could point out that you know Dyson doesn't have to be Dyson's using the El proof heel uses the US electric grid for manufacturing but also prodct that's a big part of their marketing Le have a meting certified whatever that me for on their web page also for accelerator the measured versus reported drying times were really different for Dyson they were exactly the same it was almost double for accelerator so they may want to get control of how much time they think people are spending and maybe make their machines a little more efficient because if they were to go 12 seconds which was the lower the difference between Dyson and accelerator wasn't that big but when you went with the 20 I think it was 20 seconds that's where the difference was more s and so where did where did that measured drying time come from so so because they were um for the measure they were following the NSF standards of like 1.1 G of water on the hands when they dry on the towel um but in actual fact I mean it's read your perceptions the the user doesn't actually measure.1 G of water on my hands before I stop using the dryer really perception issue M but that who so that that they had that NSF protocol right this is not not National Science Foundation it's National standards or NS national standards Institute something like that so they have a standards for a lot of things and in this case it's how how do you define dry hands right and so they it's whatever it was you know 0.01 grams of moisture per whatever is how they defined it right so the idea would be that if you were to if you were trying to objectively make some Claim about how long it takes to dry the hands that might be one way to do it who actually did the the testing for that though there was some study at University of Florida don't really know how they came up with those numbers yeah so there I mean there I think they said I think it actually Dyson reported it right is that there right so it was coming from a document that Dyson had claiming that somebody had had done this uh test right and come up with it so um right so you see that starting to get this paper trail of going back of figuring out that that that so much of the study was dependent on on this value and that the person reporting these values comes is essentially Dyson is making the claim that it came from so even though we have sort of a standard and and that that uh makes sense in terms of okay if we're going to try to find some way to do this objectively uh it still would definitely leaves uh leaves some room open for accelerator to to probably take some issues with it was really concerned about the results of the study too um and something that I've never noticed using one of the air blades they said that it has a digital motor so it has no spin down time so they didn't credit the Dyson with any uh 1.5 Second Spin down whereas the accelerator was doing it at for you know for 750 watts and assumed 750 watts uh which I mean adds up over the 350,000 uses so I guess if they wanted to borrow that idea and get rid of some energy consumption they do that so if you were accelerator and you'd se you read this study and wanted to to respond to that what what might you go do differently I mean one you might commission your own study since this was commissioned by Dyson so I mean that's a pretty big starting point right that Dyson commissions and not to say that the researchers M did it weren't as objective as possible but as we noted there was a good deal of data that the study wasend on that came from Dyson and Dyson then commissioned the study with it so if I'm accelerator probably like to have a say that as well right so that that was one of the other issues with the N access right it's because Dyson was behind this they supplied the bill of materials and they supplied you know all the data about the the factory and things like that whereas all the other products they had to make use of publicly available information so they didn't have access to sort of that inside information so if you were accelerator and saw this and and disagreed with it right you could commission your own study you could now make use of the fact that you know about your supply chain all right and and you could start actually going in and doing the details you could go through the fact that you're actually made in the US so you might want to you might want to redo the study under that assumption that that you're going to uh look at it uh with your specific supply chain no longer considering say a generic supply chain from China uh so what would you do to get around around this because the that still sort of the the Crux of it was that you're you both claim same similar drying times but they're saying that uh in practice yours is actually worse dat collection I know that you're limited in putting cameras or individuals uh in bathrooms but potentially building in some sort of like chip that enables you to see what actual times are for drying and then that could work in your favor I might actually I might go out and actually redo this study right that that that Dyson was reporting right to to if I use this nfsf study to go in uh and at least verify that they it really does take my machine 30 seconds versus their 12 seconds or something like that right so it's uh at MIT if you wanted to do that study of figuring out how long people actually dried it right you'd have to go through the human subject uh ethics board and all of that so you might have trouble actually getting a study through where you actually went out and tried to observe it but you could at least try to reduce some of that uh that uncertainty that comes in the measurement since it's un unfavorable to you and not really much hard information out there about it so you might want to commission say a outside source to come in and sort of repeat that testing and see if they they really got it uh in in terms of of what they're actually doing so they actually have commissioned a study right to sort of to respond to follow up on this right so um because nobody's ever going to be happy with all the assumptions that go on in one of these so especially when they turn out to be right if you look at two of these big ones that are certainly unfavorable to to uh accelerator probably when you look at them uh it makes sense that maybe when you would want to come back in and and revisit this uh to try to make sure that the assumptions that your competitor is making that are unfavorable to you actually are you know grounded in reality or don't necessarily make a difference in in the final outcome but you probably don't want them uh releasing study that says you know this is your product and it's worse for the environment it takes longer to Etc without at least being prepared with some sort of follow-up to say to dispute that other than to just sort of uh uh you know ignore it or sort of claim that there's there's problems with it right you'd like to be able to come back with a uh some sort of response that's grounded in some data or have some facts for it so we're going to walk through this a little bit more in depth but uh in terms of looking at it within the the scope of the methodology of life cycle assessment but to start off with right just what is life assessment so uh and that's a good question to ask because it took some time for the industry itself to figure out what exactly it was but there are a set of ISO standards that I think were produced in in 1997 the first version essentially he says this LCA is a technique for assessing environmental aspects and potential impacts with a product by first compiling an inventory of the inputs and outputs right so tracking what's coming in and out of the uh the environment second evaluating the potential impacts associated with the inputs and outputs so fig figuring out right now I know what I'm emitting to the air what I'm taking out of the the the environment actually figuring out what those impacts are and one of the the key points here is that uh it specifically mentions the potential environmental impacts right because some of these studies are going to be forward-looking trying to figure out what happens when we make a change uh as opposed to some of these studies that are looking backwards and trying to figure out what the actual impact is so uh so that's a big one is that a lot of times we don't necessarily know what the exact environmental impact is we're trying to forecast ahead of time what it's going to be and finally interpreting the results of the inventory analysis and impact uh assessment in relation to the objectives of the study so the big thing about this is that uh uh right that it's sort of fluid in terms of what an LCA is because you start off with creating some kind of objective of what you want to do with the study and all of the results that you generate are going to be interpreted back in terms of that scope and and that goal that you started with some of the important things to remember is that it it takes a life cycle view of the product so raw materials all the way through to end of life right so it Cradle to grave is typically the uh the way that would be um uh talked about and uh while it specifically mentions products it can be mentioned uh for services as well right so we can think of the uh the hand drying example it's not necessarily comparing products it's more comparing a service right that of drying hands LCA generally credited to Coca-Cola as being the first the first person to develop this back in 1969 when they commissioned a study that would look look at the environmental impact of using cans or glass bottles so this is when they were first thinking about going to Cans and they were trying to understand not just all of the economic and supply chain impacts but they wanted to consider the environmental impacts as well so they commissioned a study uh and actually hired some researchers to do it and essentially they came up with what would be uh and eventually become life cycle assessment in terms of that quantifying that environmental impact in some manner by looking at the inputs and outputs uh so that was in 1969 so it started to gain attention in the 70s were other uh there were other efforts going on in this area especially in Europe uh with the energy crisis there was a lot more uh concern about things like how much Energy Products we using uh Services about what it was going to mean as that started to fade away uh the energy crisis in the 80s uh it became a little bit more known for companies making environmental claims about their products so trying to use it in advertisements and things like that and gave rise to what they were referred to as Hired Gun studies which was basically as we saw there's a lot of assumptions and a lot of uh um uh you know questionable assumptions at times that go into doing one of these studies and what they were finding is that there were companies out there that you would hire them and they would construct a study in such a way that it said basically whatever you wanted reaching the point that 11 state attorney generals issued guidelines saying that you couldn't use life cycle assessment to make a claim or comparative uh Claim about the environmental impact of your product in an advertisement until LCA became standardized until a uniform methodology was developed so that sort of kicked it into gear of uh getting different companies different organizations together to try to iron out what exactly a life cycle assessment was going to be ctec uh was probably the the uh the leading group in that it's something like this something environmental toxicity in chemistry or Society for environmental toxicity and and chemistry I think something like that so it's a uh generally chemists uh um people study ecotoxicology things like that getting together and creating working groups generally of academics and practitioners trying to come up with sort of a uniform methodology that could be used for life cycle assessment and eventually this this developed into some standards uh from ISO uh 14040 is the main one but there are about four or five different offshoots from that that cover uh different aspects of it from uh you know the guidelines for how you do it to how you would use it to making uh claims or how you would use it for putting labels on products uh so it it's sort of grown quite a bit from from those Beginnings so essentially the methodology that they developed is going to consist of four stages the first of which is the goal and scope definition uh which comprised of a couple of things namely deciding what it is you're analyzing uh looking at uh what the the scope of the system is under under consideration uh identifying what Falls within your system boundary the second step is referred to as the inventory analysis this is where you're identifying and quantifying all the things that come in raw materials that are coming in from the environment all the emissions that are going back out whether it's to air or water or land uh all the other products that you might be using uh all of the inputs and essentially creating an inventory of those right identifying how much there are uh the third step is the impact analysis this is where we go from the inventory from identifying everything that's going in to figuring out what exactly the uh the environmental impact from that is going to be and what methodologies you used to do that and then finally as we talked about uh interpretation is the fourth step so we want to go back and after we've set the goal of the study and identified the scope and gone through and quantifi the environmental impact how do we take these results and relate them back to all of the things that we we we set out from the beginning that were our goals so if we start off the goal and scope dep right the first thing is to decide the uh the product that you're going to be studying and what the purpose of the study is so and that includes two question or three three points what is the intended application of the study so what are you trying to do with it what's your reason for carrying it out and third for whom are the the results going to be used so if we look at the study that we looked at today uh if you WR that you'll notice when the the study was laid out as you read it it was actually laid out in sections that followed along from our from our four step so uh let's talk about the the product to be studied and the purpose of the study what did what did they claim were the reasons for doing this first off what was the product that was being studied right so it's not it's not a Dyson airblade and it's not a uh a paper towel what they set up was a right per pair of dri Dan think right so this is what we would refer to as as the functional unit this is actually this is actually what we're going to study and everything that that's done throughout the study is in terms of this right so this is this is going to be our unit of analysis it's going to be how we're going to compare all of these different options from uh so what was the uh and what did they say the intended application of the study was what were they trying to do here right so they actually had two uses and what was the what was the target audience for this all right so they had once right so if we look at it in terms of this right so uh one group of people that the results were for were the Dyson Engineers right they wanted to go through and understand uh where were the impact what was the reason was to identify the impacts associated with the air blade so that the engineers could take a look at that and start figuring out ways to to reduce it what was the other what was the other purpose enviral related to that so if all I wanted to do was note was identify for my Engineers right where the the impacts of the air blade is would I need to consider paper towels and the accelerator and things like that no so that that's our second reason right was comparative they wanted to go through and say uh here's here's the environmental impact associated with a dry Pair of Hands when you use the air blade and here it is when you Associated it with one of the other the other prodct under consideration right so they actually they had the uh air blade what else did they study they had the accelerator yeah so they had two versions of the paper towel and they had uh right they had two versions of the air blade too right they had the aluminum and the plastic yeah standard right cotton roll towels right so this gets back to right our choice of a functional unit was the dry pair van so this gives us sort of the basis that we're going to do these comparisons on but in terms of the goal and scope that's important because if I just wanted to use something internally then I would never go to the TR right there's no need to go to to all of the trouble to do all of this so the big thing that that drove a lot of this is the idea that it's going to be comparative that they actually want to make a comparison between what happens when you use the air blade to when you use some of these other systems right and it's going to come back because right once they did this then they had to start making a lot of assumptions about how these other systems worked right since they didn't necessarily have the data to that and then because you're doing that comparison you sort of uh right part of it is they're going to make this available externally right they said that part of it might be to use this for making claims and so once you've decided that you're going to start making uh using it for public claims you definitely want to be a little bit more rigorous in your in your application in your approach right because you know as soon as you publish this and start making claims that accelerator and all the other companies are going to look at this and think well why didn't you do this why this uh so that this sort of drives a lot of what goes on in the next few steps that by doing this now we've expanded the scope of our study from just looking at my supply chain which I have pretty good visibility to to starting to look at a lot of different other products and this brings a right this brings a lot of extra complexity to it because I have a number of different studies and if each of these has different configurations or different uh assumptions that I make the uh the the complexity starts to really balloon up uh so system boundary what what did they choose for the system boundary draw the L so they they start off by saying right this is a life cycle assessment so we're going to do Cradle to grave right so and you can think about that uh uh that that that idea that you're doing cradle degrave creates a lot of problems because they mentioned right the the there's you know how many different screws were there in the you know in the air blade you can think that now you need to trace each of these little parts right all the way up through their supply chain so they started making some uh definitions about where they were going to sort of consider things outside of the outside of the the system boundary so uh there were a couple issues that go into that so one was uh cutof off rules right so what did they use as a cutoff rule right and so this creates uh what's the issue here if I had less less than 1% of the total impact they would exclude it right so what's what's the issue with with using this as a rule number of exclusions it's part of it how do you know that something that only contributes 1% of the total impact right it's like a chicken in the egg problem if if you've Quantified it to identify that it's less than 1% of the impact you know why wouldn't you include it so what they what they actually done is is right so for all those little things they've they've done some basically right back of the envelope or or some other type of of high level estimate to try to figure out what they are without going to the trouble of digging down uh deep into the level of it to try to identify what it was they mentioned some of the other right since they were using a lot of information from other previous studies they mentioned some of the other rules that some of the other studies would use remember what some of those were also on that didn't they limit it to no more than like 5% the total product with all this 1% assumption so they couldn't like say like every screwed didn't matter right so if we do any individual process that was less than 1% and in total everything that I excluded had to be less than 5% of the total so um this these are pretty common rules right so you can think about it this is if you if you had a bunch of things that were less than 1% but then when you estimated the total imp impact they were only covering 90% what you would just start adding more and more of those back into the system boundary until you hit that 95% point so some of the other studies used a slightly different rule than the impact right so some of them used did this based on physical quantities right so anything that was less than 1% of the mass I think uh one of the studies was excluded all right so um this tends to be easier because you don't actually have to go to the trouble of estimating what the impact is right you can you can start saying well I'm just going to exclude all of the tiny little things that go uh but you're making an assumption that those don't contribute big right so if that got a I don't know some uranium in it or something else it's radioactive right that may have a very high impact in terms of certain categories uh even if they don't contribute much to the overall weight so generally this would be preferred we would like to make a ballpark estimate of what the impact is and then go through and uh and uh exclude based on that rather than basically just using one of these uh physical quantities um there were some other things that they cut out us on from the system boundary this is B something about excluding raw material so I think they included that or they should have at least um I think it was mentioned earlier we had capital goods we not not included so this this is also a fairly common uh exclusion right things that have a multiple year lifetime um not to include those in right so you could include them in the same way that when they made the decision to do a dry Pair of Hands they had to start making assumptions about the lifetime of the product how many uses it was going to get made and then you allocated they allocated a portion of that to the life sign right they included things like the the bins and the the liners that we're using for paper towels and things like that so you you could include capital goods you'd have to start making assumptions about how many years it existed right how many products right uh if you were to include the trucks or the ships that move the goods you could how many trips in a year does it make how many containers does it move you could start doing that um it tend to be uh pretty low right if you're already including the you're including say the uh the transportation piece of the ocean so you're capturing all of the fuel that's being burned but you're just not capturing the what goes into building the ship so that that's a another one that's a pretty common one so they they mentioned in the study that some of the studies they used had excluded the capital goods and so they chose to exclude capital goods in this as well in order to maintain that consistency so in this case they might have otherwise chosen to include those but because they were relying on past data they went ahead and included them anyway what about with the paper towels this was specifically one of the issues that they had previous recycling right so this this is another big one specifically what was it about this this type of recycling that that was difficult remember what the term they used for it was open loop right so this is the problem with things like paper is that uh something that is a paper towel if you were to collect it and recycle it usually that right that the strength of the paper that you get from the Recycled Fiber is not as strong as it was when it started so if it started off as a paper towel when you recycled it it's usually no longer strong enough to be a paper towel and so it might get made into toilet paper or newsprint or whatever else is is on down the line so you get into the the situation where you have the product and you recycle it and then it's going to go get turned into some other product that has its own life cycle and it's going through as opposed to a closed loop recycling that product would just get turned right back into an input and if I were to do that then I can draw my system boundary around this and I don't have to I don't have to worry about it because it'll get included in this system boundary but when I'm doing this I'm start getting into multiple different types of products right and that that uh and this is a problem because the uh the input right if uh when it mentioned the uh they had the two types of paper towels right some were made from Virgin fibers and some were made from recycled fibers if it's made from a Recycled Fiber it had its whole whole life cycle before it became a paper towel right when it was a um you know maybe copy paper or something similar to that so uh that usually means you're going to have to make you're going to have to make some decision about where to draw the line in terms of how far we go chasing all of these other products that it might have been turned into so again with the goal right so this is this comes directly from the uh from what they wrote in the report compare the environmental impact of Hand Dry systems uh evaluate how they have the impact under different manufacturing and use scenarios so this is part of it is that they rather than consider it within the context of just one scenario they wanted to try a couple of those scenarios uh this related back to the assumptions that they had to make uh to identify impact drivers and ways to Target those um with the idea to inform product decisions um all right so this is and we mentioned this comparative assertion so this is sort of the important one because that lets us know this is going to go to an external audience uh this brings its own set of requirements so if you're going to use something for comparative assertions the ISO standards generally require you to have a third-party evaluation of it right so uh if you look through in one of the appendices they had they mentioned uh uh the the results of their thirdparty essentially review of it and so they had a panel of three experts uh go through and review the initial draft of the life cycle assessment study and then they had to go back and usually you get critical it's like a submitting something for peerreview at a at a academic journal or something similar uh where you would get back comments about what you might want to change and what you might want to do so once you start making some of these selections upfront about the goal of your study uh that's going to drive extra requirements and and make some complications for what you need to do down the road uh finally right they they mentioned internal and external audiences with the goal the the big thing to keep track of is there's really two types of life cycle assessment studies and they go by different names attributional vers consequential is one of them uh one I've heard is accounting based that would be the attributional and this would be change oriented uh really these are little diagrams that somebody created that are are useful to think of it the distributional one which is what they've done in this paper is essentially right it's taking a system and trying to figure out what portion of that system's environmental impact is related to whatever you're looking at right so it's taking a static snapshot of something and trying to ATT attribute the uh the various environmental impacts to your product system uh the consequential of the change oriented is going to take a system and it's going to try to model what happens when you make changes to it right so the big thing of that is that it's not static that the picture is going to change you might reduce impact in certain areas but it might increase it in other areas and so this attributional style is generally things that are backwards looking uh whether it be uh making a estimating the environmental impact of one of your products if you want to say do a carbon label or to meet some certain standard to get a Eco label uh to to estimate the environmental impacts of of different systems as they are now is the big thing the consequential is going to look at what happens when we make a change so usually what this means is that that that could that could involve very big changes in the system right that if you make certain decisions uh they're going to impact that things might look this way now if I look at just the system as it is but if say my demand is starting to increase and I start to have to start making different changes uh that could shift the way it would be so one one good example of this would be looking at say the impact of of ethanol if you look at say US policy on ethanol right if you just look at a static snapshot of say where we're at right now or or the way it exists right now you look at the uh the life cycle for say corn ethanol and you measure its environmental impact and then you compare that to say uh what it takes to produce gasoline or diesel fuel and you come up with an environmental impact and so that generally would tell you that ethanol is slightly better on say a greenhouse gas perspective but when you start looking at the at what happens when you start making big shifts as we start converting crop land from other uses in order to turn turn it into corn in order to turn that into ethanol you start getting a Cascade of changes that go on right so in the in the case of the us we've switched a lot of Farmland over to corn and so that has left a gap in wheat and soybeans and other crops that used to grow on land that were corn so now we don't have as much to export to other countries so those countries have to convert some of their land to uses to grow to make up for our our sort of wheat shortage and once you start and so then they may end up clearing rainforest right or or some other sort of uh bad impact in order to turn that into land to grow these crops on so once you start looking at this Cascade of system effects uh people think that ethanol is no longer preferable that once you include the indirect effects uh it's better so in that case that's what happen when you start looking forward looking at what happens when I start to make a change to this and so if you look at the characteristics of these different types of systems uh they're going to have differences in what you going to do part of that is the choice of data right these we tend to base on average dat data right because we look at the average electricity Grid in the US you're usually not making and we're not looking at something that that creates enough change in the system to really worry about whether it's impacting things at the margins but once you start looking at uh energy policy or some of these big areas uh if you start looking at what if we were to shift a significant portion of steel production to aluminum production which might be much more electricity intensive then we start needing more power plants well maybe those new power plants come on line are gas powered right as opposed to Coal Fired and so the actual electricity the actual emissions impact is less than if you looked at the average of the grid so these are the ideas between what type of study are you looking at it's going to drive some of these choices and where you get the data uh what the system boundary is one of the nice things about doing a change oriented LCA right is if I have things that didn't change right I'm comparing two systems of before and after and I have pieces of it that didn't change at all I can ignore those pieces right because they're not going to affect their I'm just looking at the changes that happen so I can sort of exclude all of those from the system boundary whereas with this type of assessment where I have to trace everything all the way up and back I have to make sure that it's it's fully complete to make sure that I'm really getting that share of the emissions mention the power grids is there to your knowledge any effort to track specifically which type of power is being used at the plant in question for example if something's made in Pennsylvania it's probably coal but if it's made in Idaho it's almost exclusive ly hydraulic when ever account for that yeah so you you can definitely get at that level um even even in things like the the greenhouse gas protocol when we were talking about corporate level once um if you go and look at the tools that they have for measuring the electric impact of electricity you can get Regional specific factors right one thing to remember with the electricity it's it's on the grid so even though you may locally be supplied by a nuclear or coal plant you're part of usually a regional grid so they tend to break it out into inter Regional ones but you can get further down emissions factors and start looking um we did a study with Chita looking at bananas right and so for that we went uh part of that is right they're grown in Central and South America so you can go out and look at the different electricity factors that a country level there and they can make quite a bit of of difference um but there are definitely you can one you can a lot of people already do that two is that uh you can tend to be able to model that by looking at the percentage mix of coal versus nuclear versus uh you know gas that might be used in in any specific area um it gets into a really it's a really tricky question when you start thinking about what happens as I start to change things because then you get into where is the power going to and you know which plants come online as as demand starts to Surge and things like that but that's definitely an area that that people look at usually the big question is whether right if you looked at if I did some small change where say I moved my Corporate Offices from one location to another right you probably wouldn't want to use the marginal data on the electricity if you move from one region to the other because you're not really large enough to have an effect on what's going on with the Grid at that sort of level so maybe it's better off to stick with with averages and things like that so there's there's some gray area in there in determining when it's right to use what which factor okay so we covered this right the the the functional unit is a pair of dried hands right once you made that right it makes sense because it doesn't while it it uh as we saw it's in the use right is where the impact comes from so the the question becomes it does you don't really want to compare a air Blade versus an accelerator you want to compare what happens over the the use and definitely when you start including things that are not a onetoone correspondence right comparing paper towels versus an air blade you want to put them on a on a uh uh a unit of analysis that makes sense but once you start doing that you start getting other right so that that's sort of the the one of the things you decide up front and then that sort of creates sort of a Cascade of decisions about what you're going to have to do later on uh amongst that right making assumptions about the length how many hands get dried the the lifespan of it uh all the the inary and secondary products that go along with it so it's the kind of thing you want to decide up front because it creates consequences for what you do down the line and that's why it's usually one of the the first things that you'll do in the study scope we had uh right seven different systems cradle degrave uh they mentioned this within there right that they included packaging right so the the cardboard that they come in or or the plastic wrap when it's there and the bins and liners and dispensers so you want to be clear when you're setting the scope about what things you're including and what not right so they they include the packaging but they don't say include the pallets that they get shipped on things like that capital goods Etc and with the system boundary um all right so we covered some of the allocation uh what it means so you had the uh end of life we talked about co-products right if you have a manufacturing plant or some other facility that's producing a number of different Goods um you usually are going to run into that same allocation problem uh where you're going to have to make you're going to have to figure out some way of apportioning the the impacts of the production process to the different uh Products that come out and again there's various rules for that um usually they're going to [Music] be um right simple things like mass energy or economic impact right so if if I uh the uh right if if I'm uh example in the textbook I have is a uh right a chicken processing plant you're taking in chickens and you're producing breasts thighs wings like all these different products right you can divide up the the the impact of what it takes to produce a chicken right to to to to raise it to give it feed uh all of that but at the end you have all these different types of products that all come from that same input and to figure out how to divide those those impacts amongst the different products that are coming out so mass or energy would be one way to do it I just weigh the different products and I'll assign them each a share of that burden based on their weight um but again this may work well for some things but not for others right especially when you have some products that are coming out that are of very high value since those tend to drive right the decisions that you make so maybe you want to do it on an economic basis instead which is to say I'm going to I'm going to portion my uh my my impacts based on the share of the value that each of these items generate uh and these tend to come back down to accounting so in the same way that our um our corporate sort of carbon Fant last week followed sort of our financial accounting rules this is much more in the vein of managerial accounting where I'm trying to make certain decisions that reflect what's actually going on as opposed to just necessarily following some rules um cutof rules we covered uh one thing with the the end of life so this was back in the uh this was back in the appendix of the document but this is essentially illustrating the four different cutoff rules that they could apply uh for the waste manag of the uh the paper towels right so the base scenario used essentially this this cut off rule so what they're saying is that right you have the first product that takes the Virgin material in uh you produce it you use it right then it goes back to repulping right so it's essentially recycled and turned into a second product again has its own life cycle you might repul it a third time it again it has its own life cycle and then maybe it's reached the end of its useful life and it's going to go to waste management right so all of these are essentially the same supply chain but we can divide up the impacts between the three different product life cycles uh based on how we divide up who gets credit uh for which of these burdens right so I think they use the the cutof rule in this one which is they the first product took credit or took the impact for all of the production of the Virgin material uh and all of the use but then once it moved off into the recycling system all of that impact was associated with the products that that went on down the line the second product took care of all of that repulping the burden that go went on there and the third product took that second set of repulping and the final waste management disposal right so if it you think of this is comes from the original forestry and paper production and this is the final when it gets thrown away in the landfill it's deciding who went to those V who got those various uh impacts and you can see that they've drawn right depending on where you want to draw the impact there's a lot of different rules you can apply and it's really mainly a judgment call which one you think makes sense since it's not entirely clear that one is better than the other these decisions are in essence always going to be arbitrary okay so that was the the first step the goal and scope right the second step is the inventory analysis right so this is when you have to go out and identify and quantify uh all of those impacts from the uh the production system so in this case it's really it's a pretty straightforward process but not easy so simple but not easy so the first is you build a model of the system so this is sort of their stylized version of what the model of the system is if you look at a uh at a more detailed uh lifestyle assessment study that's really getting down into the production process uh you might see a of say hundreds of different processes right and drawn out in a flow diagram uh a lot of the reason for this is that it's coming from people from a a science background that have done this right so it tends to follow like a mass or energy flow where every time something comes in you have to trace it and figure out where it exits the system or where it's going into with the idea being that nothing should be getting lost along the way if I have 100 kilograms of material coming in as input and 86 kgrs of it go into the production system then that other 14 kogs better get traced where it's going whether it's getting turned off into waste or burned or whatever happens to it uh so that's that's generally the first part right and this building a model of the system is something that goes on right by looking at who are my suppliers what are my what are my inputs where do I get different things from where am I uh where's energy coming into the system electricity all of that um you know where are things being transported between where are my different facilities located uh right interviews uh studying the the bill of materials looking at your procurement analyzing where your customers all right this this tends to be going through the the records of trying to figure out and map out the supply chain so from that standpoint um right it's pretty simple understanding what's going on not necessarily always easy to do since this tends to be very data and labor intensive to go through and figure this out uh the even worst part is that once you've identified all these processes it's identifying the inputs and outputs so on the inputs we have raw materials and other products that are coming in and on the on the output it's our emissions to air to water and to waste right so everything that comes into the system and everything that goes out I'm essentially right drawing a a boundary around my system which inside it may have a number of different processes going on and what I'm looking for is once I've mapped out that process I need to go through and identify where are all my inputs and outputs right this is my system boundary these should all be raw materials coming in energy coming in and all of the uh the emissions going out uh and so right one way to do that is to go through step by step this is a production facility start tracking all right what what energy are they're using uh you know how many units did they produce things like that so this tends to be the timec consuming part of it um but pretty straightforward in terms of what you need to do so in terms of the study that we looked at right how did they go about doing this they talk a little bit about it it's it's kind of vague in some areas but they talk about the the main process that they use what did they start with for the for the Dyson system Bill materials yeah so the bill of materials right so uh are you familiar with the bill of materials right this is basically right or the bom the bomb this is basically just a listing of all the parts that are going into it right so if they were to look at it uh if you were to look at it at a higher level uh right you might look at it as I don't know the fan the motor the housing Etc right these are the different parts that go into it and these in themselves may have right a number of other different m materials that go into them so if you look at it it's sort of a a diagram that uh uh it sort of spreads out right where you have a uh you have one piece here and it might have a couple of inputs and those might in turn have their own inputs and essentially it's going to expand out I'm going to have a big list of all of the materials that I have so in this case uh they went through and took the data that Dyson gave them and said we have the bill of materials for all of this and the trick was to turn that into the life cycle inventory right and so what they did is they took the bill of materials data and they called it the bill of activities because they also had data about the activities that are going on like the the energy use that's going on in the in the production phase and they matched it up with with inventory data so in this case right you can think of of the work that would go on to actually go and do one of these right especially because you think of uh um you know they mentioned in there uh and some like that the the optic housing that was on in one of them right you might that that was that detects when the hand goes in and when it comes out right and you think that has a a lens it has a microprocessor it has whatever else goes into it right and all of those products have their own complex supply chain so the minute that we mention one of these right if we're taking this cradle degrave approach then we need to start tracking each of those products up all the way through their suppliers and so they're buying that assembly from some from some supplier who in turn is buying a processor from this company and they're buying a lens from this company and they're buying you know a plastic housing from this company and that company does some kind of injection molding and they buy raw plastic from here and right so you can imagine they're going to have to start tracing all of that up what a what a labor that would be to try to do that for a complex product or even a relatively simple product so what they've done is they've gone out and found this inventory data which comes from generally comes from thirdparty sources right so if you look at how you would do one of these uh life cycle inventories usually there there's a couple of big uh software vendors that that make tools that help you do this uh semapro Gabby are some of the big ones they in turn licens databases from other companies uh Eco invent was the one that was used in this study and they mentioned that in here right so Eco invent is a company that goes out and actually tries to do that work they try to go out and look for common products and go out and examine what types of inputs do they have what goes on at the factory how much energy does it take to make it uh what all the inputs and outputs to the environment and they sort of start building up these so then they have a database that tells you things like uh this type of Steel has this sort of impact here are its inputs and outputs different types of plastic Etc and you go through and you match those up so now it says I don't necessarily need to go through and do all of this tracing of everything for me the software the database that I'm using is going to have some of that in there and I'm going to it's enough for me to say that uh this particular piece is say right uh uh you know 2.3 pounds of this type of material and I'm G to go out and match that up with the database to do all of that Upstream tracking and tracing of what's going on right now they talk about this in the study though right because this this is going to run into some problems what are some of the issues that they had with this so there's a lot of different products that go into it right so um what what do you do when you run into a product that's not in the data base they didn't have specific data on the different material covers for the hair ders they just like average thing yeah so that that um that was in that case that was a slightly different issue but related right because that that one they were relying on a uh um they were taking the information from a third party that was um that had done the study already and had just already averaged the impact of the housing together um rather than not being able to find the well I suppose it probably fits in there right there's there nobody had done this study and said here is the impact for a accelerator housing made of plastic or made of aluminum so it is is probably the same some of the stuff they they like there was no uh galvanized seal right they they said there were there was none of this there was no um I forget which type there was some type of bleached paper that they didn't have right and this was related to the recycled paper towels and some of these issues so essentially they had a they had a list of maybe I don't know 20 different materials or so uh that they that were listed in these bill of materials uh or that were included in the system that they didn't have data for and so they had to go through and sort of create their own version of some of these right so they said well uh so one thing you can do is use proxy dat so they said we don't have this specific type of bleach paper so we'll just use as a substitute this type of of bleach paper or they said we don't have galvanized steel but we have you know regular this type of Steel and then we're going to add to that the impact that would go with this process of you know applying the the coding to it so uh even with this inventory data you're going to run into trouble finding all of the products that you need to do to do this right and so it's generally not something um you're you're going to have to make some compromises as you go in terms of uh figuring out what you can include and how to get around some of these limitations that you might have now once they did that right they went through they sort of had uh they had this chart in here right which was showing essentially what they had this is the assumptions that they used to generate the inventories right because part of it was that they had to go through the manufacturing and identify how much energy sort of per unit and then they had to to go through and then base on this right how the life cycle how many times would it draw uh they had to go through and capture how much material was going into each of these right one of the assumptions they had to make was data about the scrappage rates right because part of this is that the goal is to understand right all of those inputs that come out of this or into the system and the emissions and then what is my useful output so if I take in 100 kg of plastic but only 85 kg of plastic end up in the final unit because the other 15 goes to waste you have to make sure to allocate the the emissions related to that 15 kgs of waste to those final product so it's not enough just to look at the end bill of materials they had to make some assumptions about what goes on in the manufacturing process and how that relates to it and so at the end once they've gone through of this they they they have enough to move on to the next Edge I'm going to skip this piece here and uh talk about our next stage which is the uh the impact anal is right so this is where they go through and finally now that they have for each of those different product systems they've made all of these assumptions they put together the impact uh they're ready to go ahead and determine what the environmental impact of each of those uh products was right so there's essentially two steps that go on in the impact assessment referred to as classification and characterization right so classification the first one essentially right that that that uh inventory analysis you have is going to list things like all of the output to right all of my emissions to air how much carbon dioxide how much carbon monoxide all right all of these different types of gases but if I'm interested in the global warming potential I really only need to know which of these are the greenhouse gases right so I'm going to go through in the classification step and I'm going to look at all of these different outputs that I have to the atmosphere and I'm going to gather together the ones that are contribute to global warming right so that that would be the first step that would be the classification step and you're going to need to do that for each of the different environmental impact categories that you might have so so uh they'll go through and do that and the second one is the characterization so if we looked at it in terms of the global uh the the the global warming potential right after I've classified and gotten together my listing of okay how much carbon dioxide how much methane how much nitrous oxide characterization is when we apply those global warming potentials and actually turn that into a a unit of output right carbon dioxide equivalence and this applies to a wide range of different environmental impacts that you might study so what were some of the uh impacts that they chose to study in this one they had a couple of basic ones and then some more complex ones and I didn't really understand how they did water but they said they included water and then they said they didn't so I don't really understand what went on there yeah so they had they mentioned a couple things in there there so right we had the global warming potential right they had the the carbon footprint essentially they had water use occation so that we we'll get to that in a second the uh so I had they called it CED cumulative energy yeah um um and then they had remember what the name of the the more complex one wasal so they had yes so they had something called impact 2002 plus I think it was called right so and what they did when they when they went through this they made a distinction about some of these right so so global warming potential is an environmental it's an impact category right because it it it basically does these two steps I gather my greenhouse gases and then I characterize the impact using their global warming potentials uh the Water use and cumulative energy demand aren't really impact categories right they're treated as such by a lot of people but they made the point in the study they're not technically impact areas and the reason for that is that there's no actual characterization that goes on right so for water use and commu of energy demand they just went through went back through the inventory and said right during all these steps in the process I'll just sum up how much water was used at each stage at the end I get a total amount of water use but there's no attempt to turn that into something more complicated right there's no attempt to rate um right you can think of whether I was if I'm using uh you know good clean drinking water if I'm using salt water from the ocean uh you might think that those would have different environmental impacts because most people don't care if I'm if I'm using up the the the right the salt water as opposed to using up the clean water so you could think they're not actually really investigating the impact of those they're just calculating them so you can see how much water and how much energy they use and specifically for the cumulative energy demand they they mentioned that it's a proxy for a lot of other things right the more energy intensive the production process is uh that's tied to a lot of other uh environmental impact categories so they're sort of used as a proxy but not really an impact category um all right so we had the single use indicators uh cumulative energy Demand on the side and global warming potential right and we can go through and they've done they've calculated the carbon footprint for each of these different products right based on that inventory analysis and broken it up into the the different stages of life and you can do the same thing for the cumulative energy demand where in this case they're measuring it and how many kles of energy they use right those are pretty simple but the uh the more complicated ones were this one like impact 2002 right and in this case that's because it has a number of different factors going in and it's sort of divided up into a two-stage approach which is right the first thing you have right just like with global warming potential they started with the inventory results right but then they went through and created what they called a number of midpoint categories so if you look at what impact 2002 is right it's divided up into all of these different things that are counting everything from carcinogens to Ozone depletion to Mineral right how much mineral extraction you're doing um aquatic acidification right so a number of different environmental impacts so this is getting at a lot more broader scope than what we would get if we just looked at energy or global warming potential and so it goes through sort of the same process that you have before which is right now I'm going to look at my inventory and I'm going to classify all of my emissions that are carcinogens and I'm going to group them together and figure out how much I have of each different type you're going to go through this for each of these different uh different midpoint categories right and then what they've done is that they've combined these then into a a second set right so they figured out how many of the different types of carcinogens how many of these and then there relating these again to overall indicators that capture a broads set right all of these are things that impact human health so they're grouping these together and one they're calling human health they're grouping all of these together into ecosystem quality uh climate change is its own and then they have resources all right and so that in itself is a pretty complicated process because if you look if you if you read about it or or looked into some of these charts right this is what happened is that they right and I'm not even sure how you do this right so the carcinogens are being measured in I don't I don't know what that is I I need to brush up on my chemistry but it's some kind of grams of some chemical equivalent right so they've taken all of the different outputs that they have that are carcinogens and they've found a way to to measure them in terms of some equivalent unit so right so this is producing I assume this is producing the same amount of carcinogens is 0277 grams of whatever that that uh compound is right so that's how they've gone through and for each of these categories they've created some measure that they're going to use some equivalent right so respiratory inorganics right I can we can assume that these have the same impact as it would if you produced this many grams of particulate matter 2.5 millimeter particular matter right so or whatever that is so they've gone through and for each of these categories they've come up with a way to do this right and so this is pretty complex and probably nobody on Earth is enough of an expert to be an expert on each of these categories right so what they've done is they've gathered together experts from all of these different areas to figure out how you would go through and judge each of these and they actually go a step further from this actually two steps further from this right so you can see for each of these products we're going to get all of these different ratings and the question is how do we put all of these together in terms of of an indicator right um because I can look at right what the value is for an airblade aluminum and I compare that to Cotton roll towels and I see well cotton roll towels have less carcinogens so does that make them better than the Dyson airblade and the question is that depends right because if you start looking at some of these other impact categories you find ones where well that actually contributes higher a higher value 290 to 118 in terms of terrestrial ecotoxicity so then you have to come back through and figure out a way to balance all of these different impacts together and that's what that impact system does because it essentially produces two things so first they group all of those together right they took all those human health impacts together and created a single indicator so they're bringing together the carcinogens uh right all the uh the inorganic uh um inspiration all of these different types of of of impacts that they said impacts human health and they put them all on a single unit of measure which I believe they is disability adjusted life years right so if any of you following Healthcare right that's how you that's how you measure when should we pay for this type of uh health care or not right this is one of the the things that you do you try to judge what the consequences of it will be right and then you have to make some trade-offs about would it be better to be blind in one eye or walked with a limp and all of these things right so it's very complicated and requires a lot of value judgments to get into to some of these levels right so the nice thing about these these categories like impact 2002 is that they have what would hopefully be a panel of expt going through and doing this in sort of a peer-reviewed fashion and they're coming up and so now this is giving me a human health right comparison of these different products so it's bringing together all of those different you know seven or eight different indicators they had that impacted human health and put them together on one scale and they do the same thing for ecosystem quality and in fact you can take it a stage farther which is that you can put these all together in terms of Eco points right so then that makes the balance between how much human health would you be willing to trade off against how much ecosystem quality right and so the important thing to remember about this is that as you start right so that's very nice when I have something like impact 2002 because theoretically I can compare these systems and I can get a picture of the overall Environmental Quality not just looking at one single issue like global warming potential and not having to look simultaneously at 27 different indicators and decide how I want to trade it off I've hopefully got some experts out there that have that have done that already and I can summ everything up in terms of say one unit of ego points but the important thing to remember is that when you do that you're making value judgments right that's built into the system that scores that it's deciding how much you're willing to trade off these different categories okay so finally the the last uh step we do is the interpretation phase right so uh this was actually the uh the long one when we when we looked at the study overall because they went through and trying to interpret all of those earlier results in terms of what the goal in the study was and essentially to do that they wanted they had to go through and do all sorts of uncertainty analysis on that to make sure all of those assumptions they made along the way right were still valid when they tried to go back and interpret if you wanted to come back and make a claim that the Dyson air blade was better than the others you better make sure that all of the limitations in the study aren't going to impact that right so they essentially did three types uh they did a sensitivity analysis they did uncertainty analysis which was really two different types one was a scenario uncertainty and the other was a bill of activities analysis so in terms of what they did right the sensitivity analysis was pretty straightforward they they basically went through all of those assumptions they made and they they had a lot of them there were probably 12 or 15 different uh major assumptions that they made and they did a one factor at a time change to test the impact of that right so they went through and some of them this is right that they tested right there's a when the when it goes to waste there's a percentage of that that gets incinerated so they tested how that changed right in different countries that have different uh Waste Systems and different ways of of taking care of the waste will do that differently so they went back and tested the impact of changing that percentage on the scenarios right and if we look at the scenarios right none of these really get changed because they're not really sending much to waste it's getting burned and these change a little bit but overall looking at these different scenarios you get a very similar picture than you did before so it's not particularly sensitive to the assumption that we have here the other one has to do with the uh uh intensity of the drying time on the system right and so in this case right you get you start to get a a very different picture between different scenarios where you have some of these that are getting uh definitely higher impact and changing as that we go through so the sensitivity analysis was pretty straightforward go through one at a time right changing those factors between some different values seeing what impact it has on the system right so it identified right the two things we said it identified were the the electricity and the uh the drying time like the which which drying time scenario you used right so it identifies those two as sort of the major ones that can affect the system but one of the things it doesn't doesn't really capture is that it does all this one at a time and especially those two are related right so if I'm off on how long I dry and I'm also also often my assumption about the intensity of the electricity those two factors might compound together to make my results right even worse so this only captures what happens when they did it one at a time so they went through and did a scenario uncertainty analysis and essentially they had I don't know 20 different parameters and they had sort of a range for each of them and they assumed a distribution uh right uniform or or of some other type and they went through and did a Monte caros simulation where they did 20,000 different simulation runs where each time they picked a different right r ly picked a value from that distribution and calculated the the uh the impact on each of the different product systems so this is global warming potential and you get some sort of distribution about what the uh the impact of the different products looked like so uh you can see sort of how it changes uh based on all the different assumptions and what the possible range was and one of the important things they did with this is right you get you get some overlap right that if we look at that the airblade is definitely the lowest uh you know in terms of where it shifted but there's definitely some overlap between some of these other systems and one of the things they did is they went back and checked is that um just because there's overlap doesn't mean that that accelerator was lower than this it just means in certain scenarios the accelerator was lower than what the air blade had in certain scenarios so what they did is they they did a check right because you can think that some of the assumptions might affect only one product or the other right that if the I may have underestimated the drying time on the accelerator and overestimated the drying time on my product and that may cause the products to shift in terms of which was preferred some of the others like if the the average electricity mix at the grid I wouldn't expect those to be different between one product and the other right they're both using the same electrical supply so my assumptions about the the impact of the grid should be the same between them so they made sure they did that check by each time they ran one of these scenarios they compared did the air blade have a better uh performance than say the accelerator and went through and even though you get this overlapping like this they still found something like 98% of the scenarios the the um air blade was better and finally the last thing they do did was looking at the bill of activities so for every emissions Factor essentially and for every input to each of those systems they assigned an uncertainty level to it and assumed a distribution and did another simulation so they get a range of different products like this so these are just three different types of analysis they went went through to try to figure out how much those assumptions and then uncertainty impacted what the results were so the big thing though is that even after they went through with that right they shed the the Dyson air blade still showed the lowest impact in general that even that under certain scenarios it may be that the accelerator performs better but under most scenarios they were pretty confident that the Dyson showed up with better and they they had some um right they they broke it out by different types of scenarios and said when one was going to be better than the other uh but so in the conclusion they identified right what are the most sensitive parameters uh what was the key driver of the environmental impact uh and what was the General overall environmental performance comparing the two taking into account all of that sensitivity okay
Up Next

Circular Economy: Closing the Loop | Sustainable Business Strategies
@CNAInsider
260.6K views•2021-07-30

Life in Biosphere 2: Sustainable Ecosystems & Human Survival
@TED
334.9K views•2009-06-16
Microplastics Everywhere: How Plastic Impacts Our Lives
@TEDx
100.9K views•2018-05-08
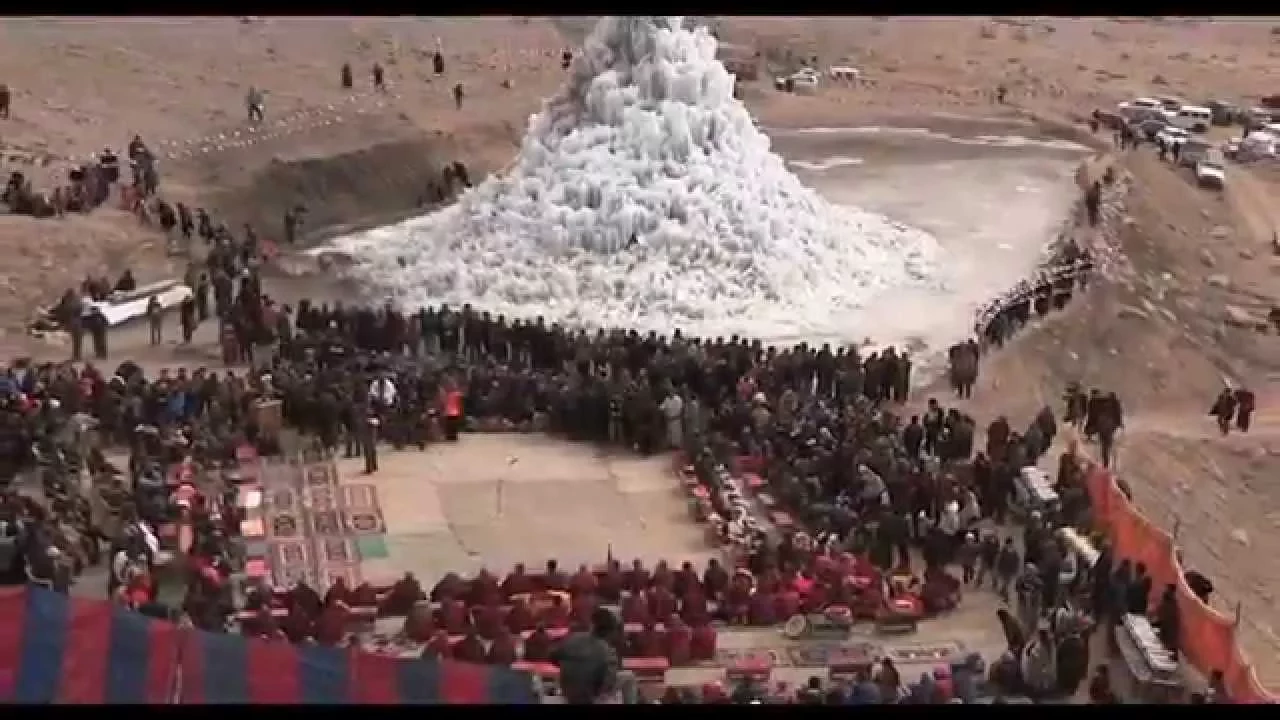
Ice Stupa Artificial Glaciers: Solving Ladakh's Water Crisis
@SonamWangchuk66
3.2M views•2015-05-03
Related Study Plans & Knowledge Roadmaps
Structured learning paths in Environmental Science