














Digital tools and platforms are revolutionizing agriculture by enabling data-driven decision-making, precision farming, and accessible information delivery. The FAO Agro-informatics Platform integrates geospatial data, remote sensing, and analytics to support agricultural research and policy-making, while the Digital Services Portfolio delivers practical tools directly to farmers through mobile applications. Student innovations demonstrate practical applications including AI-powered disease diagnosis for crops, phage-based solutions for food safety challenges, and bias detection in agricultural software. These technologies empower farmers with actionable insights, improve food security, and address global challenges like antimicrobial resistance and climate change, representing a transformative shift toward data-informed sustainable agriculture.
FAO Agro-Informatics Platform: Digital Agriculture Tools & Data Science
Added:Good day global explorers. This is your captain Carl speaking. Welcome aboard for a journey around the world with digital foul and agroinformatics.
Please fasten your seat belts, power up your curiosity and join us as we cruise through the digital skies towards the future of agriculture. We'll be reaching our final destination shortly.
[Music] Just a quick announcement. Before we take off, this session is being recorded so others can catch up at their convenience.
For the comfort of all passengers, we kindly ask that you keep your microphone muted unless you're speaking. And if you have any questions during the flight, please feel free to drop them in the chat. Our crew will be happy to address them during our live Q&A.
Thanks for joining us and we hope you enjoy the session.
Welcome everyone and welcome aboard to our next stop in our new virtual workshop series travel around the world with digital foul and agroinformatics.
My name is Jana and I'll be your moderator today and as we're beginning this exciting journey exploring how digital tools are reshaping agriculture research and education one university at a time. We're thrilled to have Zo city of science and technology with us today and I would like everyone to imagine uh today's session as a flight. So uh Dr. Da from Zal city of science and technology and our FAO experts will be the captains. Uh they will be navigating us through the world of digital agriculture and innovation. Our students from Zel City, they're the crew and they will be leading the way of academia and research. Before we get started, as you could see in the introduction video, there are quick uh housekeeping rules uh that we would like to maintain for everyone's comfort. Uh this session is being recorded. So then you can share the recording with anyone who could not join us today. Uh I would like to ask everyone who is not a speaker uh to keep their microphone muted. Uh there will be a Q&A session later on. So you're more than welcome to join. raise your hand and uh ask any questions and uh if you're experiencing any technical issues uh you can direct uh message me on the chat and I'm more than happy to try to resolve the problem. Uh I would like to highlight that uh this series is a part of FAO's commitment to empowering youth strengthening the bridge between education and digital tools and building global connections through innovations and collaborations.
uh in every session uh during these uh this initiative we're we're hearing directly from universities uh all around the globe that are using tools such as the acro informatics platform uh and or the digital services portfolio uh not only that but also any digital tools that are related to food and agriculture so uh I would like to welcome again everyone we're ready to take off uh I'm very honored to present Dr. Shaki uh she's from the uh Zal city of science and technology and I'm passing the the mic over to you doctor. Thank you very much.
>> Uh thank you Miss Hiana for the introduction. Uh and greetings to everyone tuning in from across the globe. It's a true pleasure to be part of this international gathering. On behalf of Zill City of Science and Technology, I'm proud to welcome you all to the launch of travel around the world with with digital fo and agroinformatics workshop series. This initiative represents a valuable step in strengthening global collaboration and knowledge sharing in the field of agriculture. Its focus in youth is especially meaningful to us at Zub City.
We recognize the importance of engaging students and young professionals early on and equipping them with the tools and perspectives they need to tackle pressing challenges in food systems. The digital platforms and resources offered by FO are instrumental in bridging the gaps between research, education and real world applications. These tools empower not just learners but also academics and practitioners working to enhance agricultural practices worldwide. We view this collaboration as a reflection of a shared commitment to expand access to knowledge, support capacity building, and prepare future leaders with strong digital competencies and a global outlook. We are pleased to be part of this journey and excited for what lies ahead. Thank you once again for joining us. I now hand over to our colleagues at FA.
>> Thank you very much uh Dr. Da. Uh I'm passing the mic to our captain Muhammad who will be presenting the agroformatics platform. So over to you captain.
>> Thank you very much Jana. Let me share my screen.
Okay. Thank you very much for coming to on this flight. U it's really a pleasure to give you that presentation especially that I'm actually an aluminous of Z city. So it's such a great feeling to come back to the to your university and present something that's really cool. Uh today I'll be introducing the aformatics platform. uh so it's quite a dense presentation. So let's get right into it.
So uh what is agri informatics?
Ainformatics is a very powerful approach that integrates information technology with earth observation remote sensing agricultural data management analysis and its application. And uh we to use that we built the FA agroinformatics platform. uh we built it to with a few objectives in mind. We wanted to support uh decision- making. We wanted to uh allow for intervention design, data monitoring, evaluation and we had also a few characteristics in mind. We wanted the data and platform to be trustable, multis sectoral, interoperable with other platforms and and tools. uh we want to use standards so it should be standard based standardized everything and everything is also metadata based so that uh everything is well documented and and reusable. Uh the domains of data that we have on the platform are basically spans almost all of the domains that that that interest us in the food and agriculture organization of the United Nations like soil, land, water, climate, fisheries, livestock etc etc many more. Uh we're going to see some examples later in the presentations.
uh first I will uh talk a bit about our data mantra. So uh how do we uh uh yeah this is basically our data monitor working with data. Uh so the first point is access. Well generally speaking most of the data that we have is actually publicly accessible. However in some use cases uh where we need to make data only available to those who authorize to access it. We also do that uh to harmonize. So basically to standardize to increase the consistency, compatibility, interoperability and compliance of the data with the leading and and common geards.
Uh to document so to identify, describe, track data any associated digital rights, provenence and usage and qualifications to make sure that everything in one place you can find everything and then we unite all of that into a catalog. So we catalog, organize, unify and integrate the data to create a comprehensive holistic whole view also to reduce fragmentation and duplication.
So when we use the word data, what do we mean by that? So right now I'll talk a bit about the types of data that we have. We have three main types. We have tabular data, which is any data that includes statistical data with a G reference. So any data that describes something about a location it this location could be a latl long point location. It could be a province like Cairo Giza. It could be a land parcel.
It could be a fisheries area. It could be waterershed. It could be like a water body like the Nile. It could be any location.
Yeah.
We also have uh the geographic data. So we have raster data and raster data is basically what you get when you split let's say if you split earth into grids grid cells let's say one kilometer by 1 km could be even less could be even more based on resolution and assign values or attributes to each cell in that in that grid we have vector data which is data composed of vertices uh that define maybe a line like a river a road a connection uh maybe a polygon like a farm national park reservoir etc or just a point like a university, uh, water hole, village, etc. Uh, the data could be flat. So it could be just a list of attributes and it could be also multi-dimensional. Uh, so in in many cases we want to keep dimensions on the data. Uh, let's say for example, we're working with crop data and we want to know which crop exactly are we looking at. We want to know uh what season are we growing etc. And these are all dimensions in and and it could be dimensions in multi-dimensional model of data. Uh now about the uh data acquisition model. So we prefer to actually federate uh uh the data. So which which means that we can use data could be federated. So we can consume data directly from the data source and data owners with little or no friction if they are standardized and they are ready to use. If not, sometimes it's not then we have to ingest the data ourselves. And sometimes we also do that to to maybe reduce usage cost uh to make it compatible for more comprehensive analyses and visualizations etc. Uh also the data injestion could be manual so we can just this is mostly for static data data that does not change a lot. Uh you can just put it once or it could be streamed uh i.e. automated and in that case we have a data engineering pipeline that would automate the data injection process. For example, uh for daily data, if you have a new data every day, then you cannot just do it manually. We have an automation process for this. Now, I'll talk about uh some of the key capabilities of the platform. I'll start with the data explorer uh which is the primary point of access to the platform.
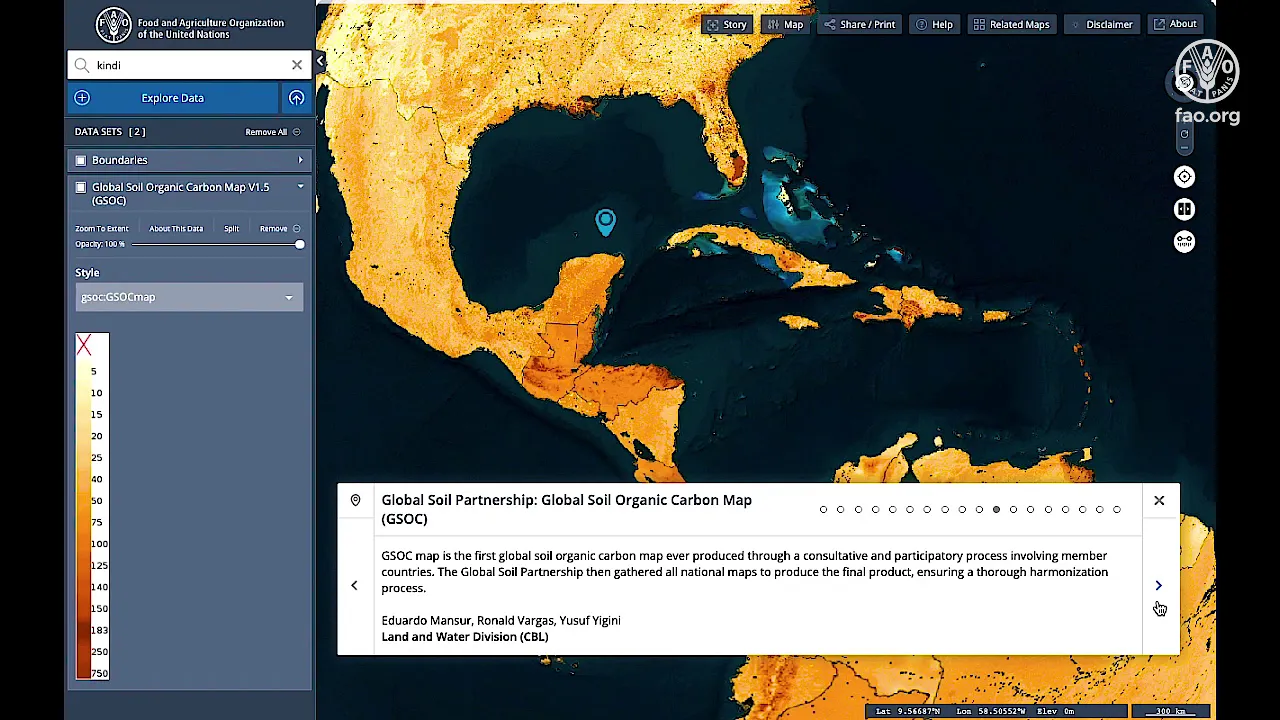
Um it is available uh it's available online. It doesn't need any plugins. It you can use it through any standard web browser or even mobile phone. It's available in all of the UN official six languages and it includes tutorials and tours and there is also a lot of videos in our YouTube channel that has tutorials on to how to use it. It's also built on open source which is yeah which is uh quite nice because that means that it gets all of the benefits of the updates to the open source software. Uh some of the features in the in the data explorer are it allows you to search and explore the data. It allows you to do some analyses like time series analysis to investigate trends and patterns over time. I'm going to show you examples of all of that uh in the coming slides. You can do special comparisons side by side of different data data that is coupled with the uh regions of Bangladesh. So property map uh we also supports point data. So here is data about the major disease outbreaks. So if you can see I can I can see uh on the map uh a specific point hey that describes an outbreak and I can see all the information about that outbreak who reported it its status when it was reported if any are any unfortunate human deaths that are affected etc. And we can also see the progression of outbreaks for time because as we discussed the concept of dimension, we can always say hey uh we can see the the the the breaks are happening in several places when we slide the time dimension.
We can even play it and and see it happening over time and we can even go further. So we can actually view the data as a table um and uh we can uh uh here by clicking on the table view and we can then do that that allows us to do a lot of interesting for example filtration. Let's say I only care about diseases uh disease outbreaks that affects cheap then okay you can actually filter by sheep and then it will only show you that data. You can also do a lot of pivoting a lot of different views. So here for example I can create a table column heat map that shows me uh the situation of different of of affected species in per country and then you can actually download all of that as CSV if you want. Um now we're going to show you some uh more features. So here I have a feature a comparison feature.
So we can actually compare different data sets uh over both space and time.
So in this case for example I'm comparing animal density on the left to uh human population density on the right. And I can use that to drive insights. I can say hey these are the spots where there are a lot of animals or a lot of humans and and vice versa.
And this could be used for decision- making deciding for example where to build a specific infrastructure project etc. I can even do sideby-side comparison of the same data to to for example to compare two different time periods. So here for example on the right I'm comparing 2022 on the left I'm comparing 2023. This is transpiration data. So in Lebanon so for example I can see ah here's how the situation differs over the year over that year the transpiration for example was less last year than today etc. Um I'll also talk about analysis. So one of the other capabilities that we have are analysis and models. So we have different types of uh analysis. Uh what do we mean by analysis? I.e. in the concept of restster data we transform and analyze rest data. So we can reduce restster data through a variety of methods. We call it also reducers. For example we can get max mean median standard deviation count as a vector etc and many more of a of a specific data.
We can even perform complex raster calculations like long-term averages weighted overlays masking and custom formulas. I'm going to show you some of that in the next slides. Uh and also uh we can analyze and summarize tabular data, conduct sophisticated multiiteria decision analysis, generate meaningful aggregates and statistics. Uh also build advanced analytical workflows that are even more complicated than that.
Sometimes we require custom uh workflows for a very specific particular application. Also we can uh integrate custom and external models uh for example like machine learning models and models from Google Earth Engine.
So uh here I I'll show you also some examples of the analysis. So here for example I I choose this specific area or this specific region in Uganda and I can say hey I want to know this is a precipitation data. So I want to know how the precipitation this year compares to the long-term average. So I want to see I want to and you can do that. that you can just choose the area, run the analysis and you'll have a graph like this that shows you oh here is the long-term averages for and and then here is the situation for these years and this is how you can see ah this is you can say then ah this region is is has more precipitation has more rain than it's historically has been or or less or etc. Uh you can also not only you can use uh uh defined uh areas like regions country regions you can draw your own area. So you can say hey I want to draw this area around Z city or or whatever and I want to uh do a land cover composition. I want to see uh uh I want to do like a an analysis of that area and see how much of it is desert, how much of it is grassland, how much of it is is tree cover. So you can as you can see this is a drone area and we can run an analysis and generate this pie chart that has all of the land composition.
You can even uh compare very very small areas like here we're comparing two specific fields in Lebanon and we can compare the production of each field see which which field produces more. Uh you can even do uh even more filtration. I can say hey I'm only interested in in in the data where the where the production was more than 100 or above a specific threshold etc. Uh here for example this is an example of categorical analysis which I as I have described. So here I have land cover data uh from European space agency and I can say hey I want to know uh the composition of this area of land how how does it compare what how much of it is shrubland grassland the tree the vegetation etc and even more you can even do a lot of composite analysis complicated it's it's the list here is endless so I'm going to but maybe then okay what if this is not enough for you maybe what if you want to run your very very particular algorithm or or you want to uh you're more comfortable using your tool like E.JS or RJS or whatever and you want to take the data out. Well, you can you can also do that. So, you can select any area and you can actually click export image and you can export it as a file that allows you then to use it here for example it's used in QJIS but you can use it in whatever uh GIS application that you really want.
You can even open it in Python and code do whatever you want with it. Uh so next I'm gonna I'm moving a bit fast because I have a lot to cover. So yeah, apologies about that. Uh I'm next I'm talk about the data catalog. Uh which from the name it's our data catalog that allows you to search for among the data to view the data interact with it and and and have data visualizations and also download the data. Uh the our data catalog are built around an ISO standard. So we have uh what we call a SECAN which is a which stands for comprehensive knowledge archive network.
Uh here's a screenshot of actually uh yeah here's a screenshot of one of the entries in in our catalog uh where you can see information about uh the data title some information methodology data lineage etc. And this all follows of course uh the international standards organization standard ISA standard uh we're also uh right now providing data through stack which is also a a standard to to for providing cataloges of data and it's I have to note and this will also be relevant in next in this presentation that this is very friendly for programmatically accessing the catalog is just JSON it's built around JSON so I'm going to this going to be relevant into a more specialized part of the presentation later. So, we have a very rich data ecosystem with more than 2 million layers, more than 5,400 data sets, more than 210 contributors and more than 90 federated organizations that use manage their own catalog entries. They put their own data. They they manage the whole thing. We just uh host it. They basically do everything else.
Uh here I have some application use cases. So, some examples of why this has been useful. I am gonna maybe if there's time at the end I'm going to go back and discuss all of them but maybe now I'll talk maybe about one uh here for example I can uh here's a a use case where I want to select to know what is the where is the optimal location to to install a new storage facility for rice for example and I can say hey I I'm going to give each location a score based on these all of these different data sets and then I'm going to overlay it on the map and say ah these are the areas that we should really that the government uh of Tanzania should really put a a uh a storage location.
Uh yeah, there are many cases, but I'll just for the sake of the presentation, maybe I'll this time I can go back to it.
Uh so yeah, this is a a screenshot of the tech stack that we're using for the tech enthusiasts out there. I know there there might be some among the audience.
Uh and also we have a very thriving community. We have more than 154,000 users that are using uh the platform for more than 214 for 214 countries. Uh and it's it's increasing year-over-year.
Uh we also have 27 data explorer sites that are basically specialized version of of the agricatics platform to cater for specific thematic and regional communities. Uh we also have a community of practice on LinkedIn u where you can it's a professional space where that connects people working on the crossroads of agriculture data and digital tools you it's you will find there people work in FAO development practitioners researchers private sector partners or anyone who's working in the geatial tech and aggre aggro and aggro data it's really useful uh to for example share knowledge and and good practices announce events and learning opportunities exchange ideas on topics like remote sensing, GISM mapping, digital platforms and tools, etc. Um, okay. Now, I'm going to I have a a bit of a small I'm going to take a small detour in our trip in our flight here uh to talk specifically about the interdisciplinary nature of the computational sciences and the geop world and this is more towards the computational sciences majors in university like data science and AI software development and and communication and information engineering. So the first question that you might have is why why do I care about JS data? And I say I'm try I'll try to convince you. I'll try to sell it to you. Um it's G special data is everywhere. A massive percentage of all data generated has a location component to it like the GPS in your phone, your car, your watch, all the satellite images capturing the entire planet every day. All of the IoT sensors monitoring traffic, weather and pollution gag post social media, new data products coming out all the time. So it's it's not going to get less. It's only going to get more. And also this is a trillion dollar niche. So the global the global geospatial market is projected to hit $1 trillion to surpass even $1 trillion by 2030. And it's driven by real world problems that we need to solve like smart cities, autonomous vehicles, logistics and supply chain optimizations, climate tech respons renewable energy etc. Here I have some questions. for example has some questions where or that you can help answering with this tech but maybe uh we can share the slides afterwards to for the time. uh and I would say that your computer science skills are now the geospatial text stack. In in the past JS was for geographers very spe very very very very specialized people who work in geography. Right now I would say the modern goss is a computer science challenge first and foremost. So your skills are very very relevant here. For example, data engineering, AI, machine learning, comput cloud computing, these are the most common expertise that that are needed right now in in in the JS field. And I would say that this niche apologies u this niche u this interdisciplinary niche between GIS and and and the computational sciences are is is a very good opportunity. It's not filled. It's actually there is a lot of demand and not enough supply there. I myself know firsthand because we have been trying to find people in that specific niche and it's not easy.
Uh so how can we help as a platform? So really the agroinformatics platform under the hood is a platform for developers. We are developers. We we built it in with that uh idea in mind.
So I'm going to now go over a few ways that a few design choices and ways that the agonatics platform can help you as a developer.
First of all, all of our data is cloud native data. So here's the problem.
Satellite satellite images are huge. You cannot just be downloading terabytes of data. This is slow and expensive. The solution is to use a standard called cloud optimized geote. It's a way to stream just a piece of the image that you need directly from cloud storage. So you don't need to download a very big file. You can just say hey I want the area around Zo city. I want the area in Giza and uh for a developer you can think of it as an HTTP range request for imagery really like hey I I just I will send HTTP requests that will get me that specific part of the image and that's it. So I would say it's a pretty elegant engineering solution that makes very big data accessible and we have been using it extensively in FO. I would say all of our data now is cloud optimized. uh and and cloud native ready. We also have an analysis ready data catalog actually now two. So yeah the problem is here mostly is it's so hard to find the relevant data clean data that is used that is analysis ready. We have we provide you a curated catalog of analysis ready data.
It's pre-processed standardized easily searchable both manually and programmatically.
Basically as a developer you have a data warehouse. you don't need to jump into the chaotic data swamp and you have a clean queryable library of data. Uh you can use it for your machine learning, your application, your AI applications or even your your remote sensing or or any other application. Uh we have a set of APIs that are well documented. So here's for example a swagger documentation of an API of GS manager which is the system that we use to manage rest data. Uh here is another one. Uh we also provide collab notebooks with examples on how to use data from Python. uh and how to how to interact with it. We also support integration with Google Earth Engine. So uh for those of you who for those of you who don't know Google Earth Engine, it's a cloud computing platform for planetary scale environmental data analysis. It's built by Google. So we support we can actually use Google Earth Engine data directly uh in in in in cohort with our data in our platforms. Uh and our data is available in Google. You can also use it from Google engine. So we had we support the integration both ways.
Uh yes with that I have a few slides about the road map talking yeah so for example we are uh these are a few things that are coming we are working on an an aggraformatics digital assistance or as we call it IDA uh so it's an intelligent chatbot basically that helps you uh and build uh it like it's it has a conversational interface that's designed to enhance user interactions with the platform And you can query project documentation, retrieve data etc. And maybe maybe one day uh soon it can also uh write or perform the GP special analysis for you.
It could it will also be able to do AI report generations. So you can ask it questions like hey uh what which areas of Egypt has been the driest in the last year etc. And then it will generate a report for you about that.
Uh we're also uh for analysis and models we are u embracing the open EO standard which is which is introduced by the European Space Agency.
And what's really cool about the standard is it has the the this idea of a process graph where you can actually define a very complicated specialial analysis like the one on the left here like hey I want the load date I want to reduce it I want to to calculate the minimum etc and and all of this boils down to a JSON representation of that graph. So this provides an interface for for example AI models to be able to generate this. So AI models using a an MC uh like an an an like a model protocol like an MC a model context server or MCP. They can basically say hey I want to can talk to the model and say I want to do this analysis and the model will be able to talk to the back end by just creating this graph representing it in JSON and then running it which is pretty cool in my opinion.
Well uh so the key takeaways of this presentation is that the agroformatic platform is a cornerstone of our digital uh transformations.
Uh it's harnessing geopial intelligence to achieve strategic objectives. It's used to analyze and compare data sets on food and agriculture and draw insights.
It includes comprehensive data catalog with extensive data from diverse sectors and sources. Uh it's configured for different communities and we have different versions of it. And of course you can find guides, resources and video tutorials on our website. We also hold training sessions through the year like this one. And of course for any questions you can contact us directly on fdata.org.com.
With that uh thank you very much uh for attendance and and for for your attention and um yeah I will uh unless there are maybe any I mean I will give the mic back to Jana and then yeah if there are any questions of course I'm happy to answer them.
Thank you very much uh Captain Muhammad.
Uh I've seen there are a few questions already in the chat. Uh I would like to remind our participants that there will be a Q&A session after the students presentations. Uh now I would like to give the floor to our captain DGA and he will tell us more about the digital services portfolio. So over to you DGA.
Thank you.
Yes. Hi.
Um, can you see my screen?
>> Yes, we can.
>> Yes. Thank you. Hi, welcome everybody.
Um, yes, thank you Muhammad for presenting the platform. As you can see the platform um is oriented towards the sort of national what we call high level stakeholders, decision makers, policy makers as well as academia oriented towards the research and understanding. Um the digital services portfolio which I'm presenting and I'm product owner of which is actually oriented towards the last mile. It was designed uh developed and designed uh with a small hold of farmers and extension services in mind. And fundamental idea is to deliver uh complement existing extension services on the ground with the tools in hand uh which are designed and disseminating um allow dissemination of the information important for the small holder farmers. So um the operationally we develop and manage the application technology the complete framework which is based on the Google platform and um together with the country stakeholders and f offices in the countries we design and implement local applications. So currently we are alive in 13 countries with the three more coming on board this year and in each country we implement a local version of this application. The content the structures the design of it are sort of implemented with a local context in mind oriented towards the problems and issues that we are trying to address within the context of the country. What I'm presenting here is what we call a presentation global um instance and um first of all you can see that it's developed and uh deployed in six official languages of the countries um of the UN but in each implementation the application takes a flavor color and um sort of look and feel of the uh country.
So for instance actually one of the first implementations was in Egypt and um in each country the application is available on the local Google play store. So actually you can find it under Elm Muid and it was design implemented together with the ministry of agriculture to and cooperation of the f office in Egypt.
uh what I'm showing here is a major capabilities which are sort of available by default and uh top four were original and then the rest of them sort of came through through work with the countries because as we work with the countries we develop new capabilities and enrich the framework with a functionalities which can be then reused throughout all the countries that are currently using the application.
So from the top um weather and crop calendar uh obviously um with a crop production in mind here we provide a 10day sort of forecast which is uh based on the G uh G GPS location of the users excuse me. Um under advice we have uh portion um sort of space allocated for use by the aggro services of the country and usually uh in most of the countries there is a aggro services either with the extensions or with meteorological agencies and here they usually provide a 10day 30-day bulletins uh forecasting the conditions and their impact on a crop production crop crop um growth within uh country and any of these messages here that you can see can be actually broadcasted direct centrally uh to the users um not trying to notify warn them of whatever climatic events are might have an impact on the crop production. So as you can see the uh main content of the application is delivered in what we call key messages. The short concise and actionable um text messages which can be supplemented um complemented with the audio video images as well as links. At the same time you can see that we also want to give the credit to the partners which we are working with and we can identify who is providing the information. This is a global instance.
So here we show file but usually in the countries you would see the providers of this messages and contributors to the content. Next we have for the crop calendar which is connected to our global tool uh global crop calendar which is based on agricological zones and here based on information available for each country it will look differently. So we provide the information on the crops and we have a sort of basic crop calendar showing the beginning and ending sort of periods of the crop production and in in a countries where there is an information available we can indicate other periods which are important for the u for this um activity. So in some countries we also have implemented the indication for the fertilization land preparation and other uh sort of uh major activities when they should take place when it's advised to provide to uh act on this. Uh as you can see uh then we have the crop production advisory which is organized exactly the same way. It it is sort of homogeneous throughout the application. The look and feel it sort of remains the same and uh it's always sort of looks the same way. There is a key message and then based on available resources we have audio files. um images or videos to complement the key message provided. Uh by the way, creating the content for this application is one of the most challenging uh activities during the implementations because the technical language, academic language of science of crop production has to be digested and then converted into the messages digestible by the farmers. They have to be sort of uh short, concise and with enough information for them to take action.
And as you as I mentioned before, you can see who is providing in this case it's a ministry of agriculture in Tanzania. And uh you can see who is providing the message um the information.
So next we have livestock keeping for livestock keeping and actually in Egypt it it was actually sort of implemented with a specific themes for the particular animals.
um it looks and feels exactly the same way as I mentioned throughout the application. We uh sort of keep the same format so that it's um homogeneous throughout and it's not different for the users to consume.
In addition to these capabilities, we have also Agra marketplace which is providing information uh on prices in a major markets for the uh commodities for which we have this information to give farmers an idea what what the expected pricing and where it's better to sell to give them an opportunity to sort of have a better profits in neutrifood was designed with the idea with the idea to give farmers an information about post-h harvest, postkill uh sort of processes and activities which allow them to preserve the nutritional value of their products from farm to the consumer. So here you can see the advisory on uh how to harvest and then packaging, processing uh and transportation. Obviously processing also gives an idea of how you can increase and have a um sort of additional value to the production of the crops and giving them a possibility to earn a little bit more than just on the raw products as I mentioned. So there were those were the major four themes that we started with and then throughout the different implementations we created new capabilities and these capabilities are available to all countries which want to make use of it. So as you can see we have uh developed the survey which allows submission of the in this case it was developed for the Haiti where they have to deal with the um African swine uh fever pandemic and this allows farmers to submit to the veterinary services the cases of sickness of death or the animals And then veterinary services are capable of sort of taking actions towards the locations where this information is coming from. Here is an animal feed which was designed uh for uh central Asian republics and fundamentally it was created to assist with the milk production. So originally it was with a it comes with a sort of calculator which allows to uh calculate the uh nutritional um nutritious feed mix based on uh agricultural byproducts to increase the milk production. We supplement the calculator with the fundamentals of uh feed for the milk production and later we developed the assist AI assistant which allows farmers to sort of based on available byproducts to create one or more recipes and in cases when there is a need this uh mechanism also provides uh suggestions on how to complement available byproducts to increase the productivity.
>> Dig sorry if I can just uh because we still have the student spe I know I know. So real quickly, so there was a specific theme developed for aquaculture um in Tanzania and last and then I'll sort of stop at some as soon as possible. But this is an insect recognition uh capability which allows farmers to take a picture or upload existing image and then based on recogni recognition to identify the insect and based on the insect then we provide the information on how to treat and how to actually there is a treatment as well as prevention advisory.
Um, I'll stop here. Thank you for your attention and I'll hand it over to Yana.
Thank you.
>> Thank you so much uh to our FAO captains and for uh the clear and very engaging walkthrough uh of the agroinformatics platform and uh the the live demonstration of the digital service portfolio. Uh it's very clear how these digital tools are supporting agriculture and research. Uh now to the main part uh of the event where we're turning to our students from Zoal city of science and technology. Uh in total we have four students today. They'll be sharing uh presentations uh on various different topics how they're using uh digital tools um in their practice in their work uh and in their agriculture related projects and research. So uh I don't know who would like to go first from the students the floor is opened. So uh whoever we have here uh and is ready to go uh the floor is yours. So thank you very much and over to our uh amazing student crew from Zaw City.
Hey I can go first.
>> Yes, perfect. Thank you. Muhammad Da, could you please uh stop sharing your screen?
>> Yeah, I cannot find the button. Sorry.
Can you just force me out, please?
>> Uh just a second. Yes, >> sorry.
>> No worries.
Okay, it should be fine now. Muhammad, if you would like to go ahead. Thank you.
Can you see my screen?
>> Yes, we can.
>> Okay. Hello everyone. My name is Muhammad Ash and today I want to talk about the the future of farming in Egypt. Tomatoes represent significant part of our economy and the livelihood of millions of farmers. But what happens when disease threatens this vital crop?
For many of our smallcale farmers, getting an expert diagnosis is a race against time they can't afford to lose.
Let me paint a picture of why this matters so deeply to Egypt. Tomatoes aren't just a crop here. They are the backbone of our economy. With 28% of our national workforce in agriculture and Egypt ranking as a top five global tomato producer, we're talking about millions of livelihoods. In upper Egypt, the stakes are even higher. 55% of employment depends on farming. These communities live or die by their harvest. And here's the economic reality. Agriculture could contribute 14.5% to Egypt to Egypt GDP. When diseases strikes, it's not just individual farmers who suffer. It's our entire nation. For these families, early disease detection is about technology.
It's about putting food on the table, sending children to school and breaking the cycle of poverty. The difference between catching a disease at day three versus day 10 can mean can mean prosperity or devastating losses. That's why we built an easy solution to help these farmers avoid these devastating losses.
However, our farmers face a unique set of challenges. Many are small scale farmers who lack access to modern agriculture technology and resources.
They often work in rural areas with little to no internet connection. And there's a significant need for agricultural services and information to be to be provided in Arabic. Here's what this means. We can build the world's best AI. But if it needs constant internet, drains expensive data, and speaks the wrong language, we've built nothing. Technology alone isn't enough.
We need solutions designed for Egypt's reality. And that's exactly what we did.
So, how can we bridge this gap? How can we put an agricultural expert directly in the hands of the farm? Our solution is is a mobile application we designed to be quite literally an expert in your pocket. The process is incredibly simple and built around a three-step workflow.
First, the farmer snaps a photo of a tomato leaves they're concerned about right in their field. Instantly, the app's built-in artificial intelligence works to diagnose the problem. This is our AI model running directly on the phone itself and within seconds, the farmer can act. They receive a clear diagnosis along with treatment advice that is sourced from reputable agricultural sources. Crucially, this isn't just another farming app. It was built from the ground up for the Egyptian context. The advice is localized. The interface is fully in Arabic and most importantly, it works offline. A farmer doesn't need internet access in the field of what matters the most. The simple design ensures it's easy to use for everyone regardless of their previous experience with technology. Now, I would like to show you exactly what this looks like in action.
The farmer opens the app. The interface is designed to be extremely simple and intuitive, making it accessible for farmers with any level of digital literacy. They select the option to diagnose a new leaf. The camera opens and they select they simply frames the unhealthy leave. After the picture is taken, here's where the technology goes to work. Right on their phone, without sending any data, our AI model is analyzing the leaf. The entire process happens offline, but in just a few seconds, we have a diagnosis. The model has identified this as an early blight with a high degree of confidence. But a diagnosis is only useful if it leads to action. The app is also displays immediate actionable advice to the farmer. So in less than a minute, the action has the farmer has gone from uncertainty to a clear action plan. So for the next slide, let's take a look at how this actually work.
The first challenge is that a photo from the field is messy. It has soil, other blends and shadows in the background. So the very first thing the app does is precurses the image. As you can see on the left, we start with the original photo just as the farmer took it. The app then applies a computer vision algorithm called grab cut to find the main leaf and digitally cut it away from the distracting background. This leaves us with a clean isolated image of just the leaf. This is a critical step because it ensures our AI model focuses on the patterns that indicate disease.
Now that we have a clean image, we can move to the core of our system. The second step is where the actual diagnosis happens. The isolated leaf image is fed into our core artificial intelligence model. This is a powerful deep learning architecture called Inception V3, which we specifically trained on a over 6,000 images related to diseases found in Egypt. We then optimized it into a tensorflow light format which is what makes it efficient and small enough to run on directly on the phone completely offline. The model analyzes the patterns colors and textures on the leaf and outputs a precise classification. For example, in this case the model's technical output is the label tomato early blood. But this label isn't very helpful to to the farmer on its own. That brings us to the final step making this information useful. In the final step, the app makes the AI diagnosing diagnosis meaningful.
It takes the early blight label from the model and uses it as a key to look up information in a local database stored within the app itself as a simple JSON file. We've compiled this database with symptoms and treatment plans from reputable Egyptian agricultural sources to ensure that advice is relevant, trustworthy, and actionable to our farmers. The app retrieves this information and represents it in the in the simple easy to read format that you saw in the demo. Because this file and the AI model are both stored locally, the entire process from start to finish works without the internet connection.
So with that in mind, let's address the most important question. How well does diagnosis in step to actually perform?
We tested the model on a set of 600 images. It had it has never been seen before to simulate real world use. The results shows that we have a a reliable diagnostic tool. First, the model achieved an overall accuracy of 95.3%.
This gives us high confidence in the diagnosis it provides to farms. Looking deeper, we can see it perfor how performs in each specific disease. This chart shows the F1 score which is a balanced measure performance. The model is nearly perfect at 99% at identifying healthy leaves and the two viral diseases. It also maintains very strong performance for the bacterials both late late blight and early blight which can often be difficult to distinguish visually. Finally, accuracy is meaningless if the model is too large or slow in the farmer's phone. We use a technique called float 16 quantization to optimize our model. This reduced its file size by 50%. But what does this actually mean for the farmers we aim to help? Let's think about let's talk about the impact. The true value of this project isn't in the technology itself but in how it empowers its users. We can see the impact across three key areas.
First, there is a direct economic empowerment. By enabling farmers to catch diseases early, they can prevent devastating crop loss and increase their yield. This also reduces their cost by allowing but for targeted treatments which directly improves the lil of these farms. Second, we are bridging a critical gap in knowledge and accessibility.
The app effectively puts an agriculture expert in every farmer's book, something that was previously inaccessible for many. By designing it to work offline in Arabic and for those with low digital literacy, we are making modern technology truly accessible. Finally, this work contributes to the bigger picture of food security and sustainability. We're helping protect a vital crop for Egypt. This is the impact we can have today. But I believe this is just the beginning. Let's look at where this technology can go next. Our vision is built on three key areas of development. First, we will expand our knowledge base. Our immediate goals to add more tomato diseases and integrate best in identification for common best making it a comprehensive digital tool for farmers. Second, we want to strengthen the model by creating a cycle of learning. We will build a feature that allows farmers to voluntarily submit images from their field. This constant stream of new localized data will be used to continuously retrain our AI making it even more accurate and tailored to specific regional variations. Finally, we will evolve our treatment guidance. The goal is to move beyond just reacting to diseases. We will prioritize integrated best management offering sustainable non-chemical solutions. First, we'll provide detailed information on organic and biological alternatives alongside conventional options. A key part of this is to truly focus on prevention. We will provide farmers with proactive advice on things like improving soil health and other preventive farming techniques.
This shifts the focus from just treating sickness to promoting long-term crop health and reducing the likelihood of future diseases. By expanding our knowledge, strengthening our technology, and evolving our guidance, we can build a truly comprehensive digital support system for Egyptian agriculture.
Thank you and have a good rest of your flight.
>> Thank you very much, Muhammad. That was very interesting presentation.
Um, I would now like to remind all of our participants, if you have any questions for Muhammad, please feel free to put them in the chat box. we will review them uh accordingly and uh then there's the Q&A session. Um so now we will move to our next uh next uh student from Zo City. Uh please take the floor.
I don't know who's next. So please feel free to choose amongst yourselves. Thank you.
>> Okay, I will be next. Can you see my screen?
>> I made you a co-host. Now you can share the screen. You have the share button on the lower panel. Yes.
>> Okay. Good morning. Uh good good afternoon everyone. I am Ran a junior research assistant at the center of microbology and faith therapy at Dwell City. Today I'm honored to present our research titled harnessing bacterial phase against mult drug for sever food system. Um supervised by Dr. the study explored phase based solutions for controlling food born pathogen contributing to flesh and sustainable agriculture and antimicrobial resistance reduction.
uh first the challenge of the salantica.
Salica cause about 94 million illness and 155,000 deaths globally each year in Egypt. By diary production are key uh infection sources with contamination reaches about uh 20 to 30% even more concerning in the rise of multi-drug resistance strains especially against common antibiotic like ambisellin canoyin and is limiting the both clinical and venty treatment options.
So the global mug resistance curious uh is not just a local issue. It is a global emergency. By 2050 drug resistance infection may cause about uh 10 million days annually u costing uh about uh 60 text trillion in production loss. This underly solution for alternative like phase therapies that are effective and sustainable. So what is bacterial phages? the the phages uh that are virus that especially infect and kill bacteria. It is discovered over essentially a gore and follow the leotic cycle uh the lietic cycle by binding to a bacterial receptor injecting their DNA and breasting the host to cell to read.
Uh the host specific specificity and ability to self amplify make them powerful tool especially against antibiotic resistance bacteria.
Uh so uh why fage matter for food safety? Uh phages can target m drug resistance pathogen reducing antibiotic use and leave a no residue making them ideal for sustainable agriculture and safe for food system. So they align perfectly with the foul health framework and rush to combat antimicrobial disasters.
So uh our research we asked it can biotic bacterial phase isolated from environmental in effectively target multi drug as a sustainable by control tool for food safety.
So um our experimental design uh we begin by collecting both related environmental sample and enriching them uh to isolate alyic phase target orbiting the antica. We performed full isolate tab purification and amplification followed by testing the host range stability absorption and moi absorption killing and the enable.
Finally uh we explored the practical amplification like using the phase as a surf spray or like food adaptive um or for bry.
Then for our results um so with the colony morphology we ensure that we are working on salmonella antica with blated isolates on TSA and X or XLD aore we uh we confirm with typical red colonies with black centers on XLD characteristics for salmonella and due to H2S production. uh then saw the bacterial identification using vit msalditope all 30 isolates were identified as antica subspeed and with 99.8 confidence uh then for the more index we tested all isolates against antibiotics and calculated the more index isolates with about more than more index 0.2 two suggest exposure to high risk environment notably S3 and five and 16 were probably more index strength highlight the need for phase based alternatives.
So then we isolated the fish burification and amplification is both testing confirmed high title and a clear bl and a consistent morphology confirmed with a clonal lietic face stable for downstream loops.
And then for the phase DNA profiling, BFG show with a single DNA band at about uh 84 base pair consistent with lithicola fish confirming purity and high quality DNA. For the lietic activity, the phages liate about uh 50% uh of the 30 isolate showing good spectrum potential.
So uh for the efficiency of ablating experiment many strengths had AOB above uh one indicating effective replication across multiply either consisting black morphology supports the stable infection dynamics.
Uh for the phases stability the BH the phase was stable across main phes from 3 to 12 and for the temperature the phase remain uh visible under8ative 20 and 40 ladies. uh for the UV the viability decreased under prolonged UV exposure.
Then for the killing kinatics MOI at low MOI killing was delighted at MIU1 we saw uh balanced bacterial killing and phase cross at MI 10 or 100 bacterial population drop uh drop rapidly through some latry cross was observe it uh due to bofilm or some resistance. So for the absorption rate I say uh within 10 minutes about uh 80% of the phase attached to the bacteria uh by 20 uh minutes about uh 99.4 uh% uh was attached with rapid binding ensures that the first infection and reduce the window for resistance development.
So at conclusion the latic phase was successfullyated and show with strong activity against drug and it demonstrated high title produce range and excellent stability. Uh this finding support the use of a natural residue free by control agent for improving food safety uh fully in the line with the f one health vision. Uh for the recommendation to move forward from our lab to the field uh we need to validate in reborn animal models uh develop a stable formulation lifelized powder or test in real food system monitor the resistance emergence and ensure regulatory and food.
Uh so the applications of the phase in food in food we visualize the potential of the food of the phage in real world applications uh like as a chicken in food delivery or or stable field formulations.
So thank you so much for your attention and I look forward for your sulful and the question and how we can collaborate to bring fridge based solutions and the food and framework worldwide. Thank you.
>> Thank you so much, Rana. That was a very interesting presentation. I think we all learned a lot. Uh we still have two students from Zo City. Uh I am not sure if uh they're online. I can see Malak.
Uh Malak, would you like to take the floor? Uh I just saw you turning on your video. So um I think you're next. So over to you.
>> Okay. Thank you.
Hey, can you see my screen?
>> Uh, it's showing that uh you started screen sharing. Maybe give it a few more seconds.
I don't know if the if other participants can uh can see the screen.
Yes, now we can.
>> Okay, great. So, hi everyone. I am Malik Bana. I am a software development student from Z city. Uh today I'm going to talk about something I believe every digital platform especially ones that serve farmers, rural communities and global users must take seriously which is bias and software code. Not just in AI, not just in data but hidden in the logic the code of the tools we build.
Let me start uh with a simple uh and powerful idea. If a tool is designed uh to help people then it must help everyone. But what if the logic in the code makes assumptions? What if it treats users differently based on gender or religion or language? Imagine a farmer using a national subsidy portal, but their name triggers a condition that reduces their eligibility. Imagine a young woman applying for a grant through a rural development tool and the algorithms gives a preference to men. These aren't hypotheticals. They are happening uh in the real world. And the worst part developers may not even know it's happening because the bias is backed into uh statements filters and business rules. Bias doesn't just live in data sets or AI models. It lives and we need tools to find it. So in order for the F or the UN in general to make software based decisions, a real conscious effort has to be made to mitigate the inevitable bias in human written software. Today we present an autonomous end to-end solution to catch and identify bias early on. Most tools uh today focus on bias in AI models or training data sets as we can see in the related work and that's important but general purpose code like the software that powers um farmer registration or eligibility systems is often handwritten by developers. We believe there's a gap here and it could quietly affect who gets included and who doesn't. So our approach works statically meaning we don't run the code. We have simple research question. How can we detect the bias and how can we um mitigate it further? So our approach works um on uh statically doesn't need to run the code.
So we look at how the decisions are made in the code especially conditions that involve sensitive attributes like gender or nationality. We use a control dependency graph to to map those decisions. Then we assign weights. Edges start at uh one. If uh the condition uses a sensitive variable, we add plus two. Uh if it affects an output like a return statement, print or recommendation for the user, then it adds a plus three to the weight of the age. This gives us a bias impact score which reflects how much biased logic might influence outcomes. But structure alone isn't enough. So we trained an ML model to assess uh the ethical severity of a condition. Is it potentially harmful? Does it show signs of exclusion? This gives us a bias severity score. And when we combine the two, we can have a full picture where the bias is and how serious it might be. We tested our method on nearly 4,000 Python code snippet, many of them generated by large language models, uh, LLMs, and representing gender, religion, ethnicity, and equipation biases. Our best performing model reached 94.6% accuracy in detecting biased logic. It's lightweight, interpretable and could be integrated uh into internal audits of decision making platforms, digital agriculture services or government apps aimed at equitable access. So uh the beauty of our tool it is that it is not limited to any sector. It simply helps us build sphere uh software systems no matter the context.
This is not just about ethics. This is about impact. If the systems we build are meant to empower, then any logic that treats people unfairly undermines the mission of digital transformation.
What if your agol excludes farmers from upper region due to hard-coded assumptions? What if your digital extension service offers better advice to men than women because of a poorly placed condition? Bias and code is quiet, but it's powerful. And if we don't catch it, we are not solving uh inequality. We are silently reinforcing it. So uh the FA's vision for equitable digital development depends on tools like this tools that help us build trustworthy inclusive and truly fair systems.
Currently our research is published in an international conference and you can find it on it e explore. We are working now on expanding support to more programming languages handling large code databases uh and eventually embedding this into the development cycle. So this is just a starting point and we would love to explore how it could support uh your platform. Thank you so much for your time and uh I'd be happy to connect after the session or hear your questions in the Q&A live.
Thank you.
>> Thank you so much Malak. Uh I love that presentation. I think it's a it's a completely different perspective that we don't usually take into consideration.
So it's very nice to uh to hear this and to see uh your presentation. Uh we still have one more student to go. Uh if um I do not Yes, Muhammad is here. I can see your camera on. Uh I will make you a co-host as well. So you can share your screen. Then we will be moving uh to our Q&A session. I would like to point out that we have a special guest uh here as well today uh as we have uh during all of our sessions. So um Muhammad, over to you and uh we're looking forward to your presentation. Can you share my screen now?
Uh just a second. Yes, we can.
>> All right.
So, good morning everyone. This is Muhammad Dish. I'm student at Zul of Science and Technology specializing in data science and AI. Uh it's honor to speak in this session hosted by the food and agriculture organization FA under the travel the world series. We are to explore the digital innovation of transport transportation of global agriculture.
Today I'll be sharing the data analysis geoligation and network intelligence combined with AI powered system. How it can build more sustainable agriculture future. I also discuss a real world projects that I developed using AI to support uh and make it easier for us.
Okay.
So first here the platform integrates key tools like uh foul interration system and AMIS currently supported around 54 countries. It combines data analytics driven by hand in hand which uses machine learning to predict and crops with 58% uh accuracy geologically tools for geo network uh providing 10 meters resolution image and 5 m GPS perception.
uh it also uh uses networks network connectivity through the digital village which brings 4G coverage to over 70% of the areas.
Okay. There was a two real worlds uh one in Muzzanek using gelication and network soil sensor F pilot project uh sent a real time SMS alerts to around 1 1,200 farmers. this result uh to increase the water usage down to 20% uh also over 50 L 50,000 L water saved bear hurricane so also in Egypt uh there was a a use for the FA platform in 2024 pilot for fa tracked uh the weight transportation over 500 kilometer using geoligation and IP B network data. This improved uh the road planning cut the transportation cost by 12% and C CO2 emission by 8%. The project demonstrate how data integration enhance agriculture.
Also here uh the framework the technical framework supporting behind the system file bridging worlds innovative product providing a structured pipeline for developers the data access the analysis the application through uh the platform APIs. Developers can retrieve the data sets using open sources like uh an analysis like tensorflow for machine learning. The application is e extension app used in Kenya increased water efficiency by 18% and farmers econ income by 10%. This ecosystem uh proves uh that even modest digital tools can create a massive real world impact when uh deploying a strategical.
Okay.
and encouraging innovation, empowering youth to uh drive in agriculture through technological ad advancement. Like uh I said I used two of my main projects in Zel city uh to make it for FA.
First uh I was training a model for AI based road anomaly detection. This model can be used also in the shipping process for farmers to detect the hazards in the road and the anomaly in the roads. So it be more efficient in transporting goods and transporting uh fruits. Uh for an example uh transporting tools uh it may make the time they transport things less. Also uh I thought uh there wasn't no chatbot for FA. So uh the first uh speaker was uh Dr. Muhammad. He spoke about upcoming shabbot that fou are making. So I thought if uh we can make a question answering system that uh helps the users in their experience with using the platform. So it make it make it easier for the users to use the platform. Uh as a lot of farmers are not trained to use the platform. So there will be a lot of questions. So we can make these concerns uh a big real solution. We can integrate a questioner system that showcases or we can make an simple chatbot that answers the formers and the unexperienced people that use the platform to use it easier.
Uh so I think uh the project may be like a small questioner system uh maybe like a simple chatbot that helps the farmer to use the platform more efficient and to make their experience on the platform more efficiency.
Okay. also here uh in the environment tools. I think we are building a sustainable for users to be easiest to use the platform uh to to make their experience on the platform much easier.
Uh also to encourage uh small and uh and youth people to uh go and visit the platform to help them in in their projects. Uh uh in conclusion, leveraging data analysis is uh sorry.
In conclusion, leveraging data analysis is a crucial and I think making uh it easier and sustain making the sustainable agriculture. Uh we are welcome for any questions about uh data analysis about FA.
So thank you.
>> Thank you very much Muhammad. Uh I would like to thank uh our all amazing students that had uh presentations today. It uh uh all the presentations were very inspiring and it's uh it's very clear that the future of agriculture is in very capable hands. Uh now we're moving to our Q&A session. Uh I'm pleased to to hand over to my colleague Elena who will be your uh Q&A navigator. Uh however before we have a special guest here today with us I would like to introduce Dalia uh an economist from the FAO's regional office for near east and north Africa uh based in Caribel as well. So Dalia if you're here with us today uh I will hand over uh to you if you would like to uh say a few remarks uh and takeaways. Over to you Dalia. Thank you very much for joining us.
Thanks, Jenna. I'll keep it really short. I know we're over time. Um, thanks uh to all of the students from Zoeda University. I think your presentations um really confirmed what we've been saying for a while, which is that young people are not just the leaders of tomorrow, but you're already leading uh agri food system transformation today. Um, and we're very firmly committed uh at FA and here in the regional office to investing in in in young leaders like yourselves um uh to not just to continue to innovate and come up with these um digital as well as other solutions um but also to bring those ideas to life. Um I just want to mention a couple initiatives you in addition to um what was already shared by the team but we have you know at the global level the uh with the world food forum the annual transformative research challenge. So if you have digital solutions that you're interested in testing or doing more um research on this competition can help you and provide resources to to develop and implement that research. Um this year's deadline has already passed. Um but you can always apply in the next round. Um in the region right now we have the hack for safe uh food uh challenge uh hack for safe food. Um and and this is a competition focused on innovative or digital solutions uh that address food safety challenges in the region. And I will post the link in the chat. So if your digital um technologies or tools are uh uh looking at food safety then please make sure you apply. The deadline is um 10th of July. And we also uh support the commercialization of the most promising solutions. So it's it's it's if a good idea doesn't enter the market um um then then there's a lot of lost value there. So um we have a six month to nine month incubation program with small grants through the agri nation startup cup for the most promising um ideas. So I I like I said I don't want to take up too much time and I'm happy you can always get in touch with me um I'll put my email um to learn more about how we support young um innovators in particular um developers of digital and AI solutions. Um and I uh yeah hand back to you Jenna and to to the colleagues.
>> Thank you so much Dalia. Uh it's always great to see colleagues from the regional offices how they're supporting youth and the the initiatives that you mentioned. I think it would be very interesting for our students to uh get to know more about uh these things. So if I please may ask you to uh Yes, thank you. You already did share the link.
Thank you so much. So now I will pass over to our navigator for the Q&A, uh, Alena. Alena, over to you.
>> Thank you. Thank you so much, Dalia and Yana. And huge thank you to the crew from the Wild City. Your passion, creativity, and knowledge are truly appreciated, and it's been a pleasure to hear about the exciting developments you're bringing to the world of agriculture.
I'd like to also thank Jana for her excellent work in coordinating this session and ensuring everything runs smoothly. Now we are moving into the next uh part of our event uh questions and open discussion. This is your chance to engage with the ideas shared, ask questions and dive deeper into the topics that have sparked your uh curiosity. I encourage everyone to be as interactive as possible. This is a space for dialogue. So feel free to share your thoughts, reflections, and of course questions uh for our student presenters and FAO experts. We'll take questions one at a time. So, please raise your virtual hand if you have something you'd like to ask or feel free to type your questions in the chat. We have already couple of questions in the chat that we can use to start our open discussion.
Uh we have the first question from Burj from Godir uh who is asking which countries have already successfully implemented fa digital tools and what lessons have been learned and how can aformatics platform support decision making for small holders in Africa.
Who would like to answer this question?
Maybe Carl Digga.
>> Hello. Thank you for the question. A very interesting question but a broad question. So um FAO operates in most countries in the world. Uh the data that we have available uh can be used in many of the situations uh specifically for small holders. So whilst the agroinformatics platform as we've heard is not targeted to be used directly uh by uh the small holder um I'm sure my colleague DGA will explain more about the digital services portfolio for that the uh through the extension workers and agreneurs and policy makers we hope that it will be directly impacting the lives of the small holder. So for example uh using the data in the platform it's uh possible to look at the uh evapo transpiration and the gross water productivity to uh identify which fields are producing more or less or to look at the crop calendar or to look at the uh events from an animal health situation that might be directly impacting your area.
So maybe I'll pass the floor to my colleague DGA to talk about the last mile.
>> Yeah. Um thank you for a question. Thank you Carl. Um so um as I mentioned in the presentation we are currently live in 13 countries. So in Africa it's um Sagal, Rwanda, Tanzania. In Near East it's Egypt, Jordan, Iraq. uh in Asia we have implementations in Bangladesh, Sri Lanka, it's the geography sort of goes on but specifically for the digital services portfolio um the implementation as I mentioned is local within a country each country creates its own version shall we say look and feel as well as a content because it's um sort of oriented towards the context of the country and uh it's available within the country. So to see the version you have to be in a country.
Uh the global version which uh we use for the presentation is available uh throughout and I believe the new version of it will be downloadable from Google Play Store and Apple Store um shortly in a few weeks. um they are sort of more general and um I think there was also a question about uh Nigeria specifically considering that there is no implementation in Nigeria there is no version develop uh implemented in Nigeria. So yeah, um I think I answered the question. Maybe I got a little bit of >> I hope.
>> Yes, let me know if you need any clarifications. Thank you.
>> Thank you for answering both questions.
We can move to the next question from DA. Uh if we could give more information about the data data collection pipelines. Muhammad, would you take this question?
Thank you, Elena. So before maybe we talk about the data collection pipelines, let's talk about the data sources. Where does the data come from?
Uh data comes from a multitude of places. Some people for example like to put the data on a bucket uh share it with a drive uh send it over an secure FTP like SFTP server etc etc. And we have we have we have implementation for all of that. Sometimes we even go and grab the data ourselves. So there are and then there are different ways to classify the data pipelines. We can classify them based on data type or we can classify them based on on on their tolerance to latency. So we have data that needs to be streamed because they are very frequent and they don't have very high tolerance for latency and we have data that could be patched. We have support for both. So m since I know professor da is a computer science professor maybe I'll I'll go a bit into the technologies used in each uh so for example for the streaming uh pipelines uh we use a me a cafka-ike messaging system but we use Google cloud popsup which is very cafka-ike and we used uh also for both of them airflow for orchestration uh for the uh for the for the for the batch data pipelines data collection pipelines uh we use uh containerized we use services like cloudr run jobs uh kubernetes jobs that basically runs on a schedule or runs based on an event trigger that would go and and and batch uh the collection of like a subset of data and then run it through the pipeline of the pipeline then does quality assurance quality confirmation and then uh yeah pre some pre-processing if needed and then before putting it finally to the data warehouse of Of course, we have different data warehouses and data leaks based on the data types. I hope that answered the question. If yeah, there are any follow-up questions, I'm willing to answer them. Thank you, >> Matthew.
>> Thank you so much, Muhammad. Obviously, if there are follow-up questions, please feel free to raise your hands. Uh there were a few questions in the chat that we directly responded. So, please have a look. Obviously, if you have additional questions, you can raise your hand right now and we'll answer the questions. This is also to remind you that we will be sharing um slides after the webinar is over.
Now, I'd like to ask participants if there are any additional questions.
Please raise your hand. Share your ideas, questions.
We have another question from Muhammad regarding the DSP. What measures have been taken to ensure that the application's user experience is accessible to digitally illiterate farmers?
This is a very good question. Dika, would you like to respond?
>> Yeah. Um, always a difficult uh area.
First of all, as I mentioned, I I think I mentioned um the design of application in general was performed uh uh originally was done in Rwanda and Sagal in a with the small communities and um the look and feel were simplified as much as possible so that um there is no confusion. Let's put it this way. We also ran the field tests in um uh other countries uh and improvements to the UI and uh user interface as well as the user experience have been modified and improved based on the feedback. So the latest feedback that we're getting is that it's um sort of um easy to use and um intuitive and to sort of on the other side in terms of content that's why we sort of keep the messages as short and simple uh as possible and when possible we complement uh the messages with audio recordings, video and images just to increase the possibility of delivery of the information. Yeah.
Thank you.
>> Thank you, DA.
Please let us know if anyone else has more questions.
If not, we can slowly go towards closing of the open discussion.
In this case, I will hand the mic to back to Carl.
Thank you.
>> So, I'd just like to thank everyone for participating today. I found the students presentations particularly exciting and uh wishing everyone a wonderful day.
Thank you so much Carla for the closing remarks. Uh DGA would you like to add anything? I will then ask also Dr. Da uh for her closing remarks after Captain DGA. Thank you very much.
>> Yes. Um I would like to join Carl in um sort of congratulating the students a really exceptional work very interesting and I hope you only sort of increase the curiosity and tenacity that with which you approach your research and work and take it further. Um yeah, I I believe it is in your hands and uh I hope also you will join us on the next stops during this flight and uh sort of learn more um from other u other universities and other work done around the globe. Thank you again and um well have a nice landing.
Have a good one. Bye.
>> Thank you very much. Da Muhammad, would you like to add anything to the closing remarks and then over to Dr. Da. Thank you.
>> Thank you, Anna. So, yeah, as as Karen already said, um amazing work, amazing presentations by the students. Uh really, I mean, I'm really excited and thrilled to see uh the results of all of that work. Stay curious. Uh and yeah, that's hopefully we hope we are we we're hoping for a better future because of you guys. Thank you very much.
Thank you very much Muhammad Dr. D. Over to you.
Uh >> thank you Msiana uh and sincere thanks to everyone who played the role in making today's session so engaging and thoughtprovoking.
It's been a pleasure to see the uh the insight and thoughtful contributions from all our students and participants.
uh your active involvement reminds us of the importance of creating platforms where young minds, educators and international partners can connect and collaborate meaningfully.
Uh actually today's session has highlighted the impact of shared learning environments where diverse perspectives come together to explore new approaches and deepen our understanding of global uh agricultural challenges. We hope the conversations that sparked here will continue well beyond this event uh since as as we saw the the agroinformatics platform and FA's digital services portfolio are rich with tools and opportunities. Uh they are designed not only for academic use but also for real world problem solving and long-term pro progress across the agricultural sector. At Zil City, we are proud to be uh part of this effort and to empower future leaders with digital knowledge and practical resources they need to drive lasting change. Thank you once again for joining us. We look forward to seeing how how you will take today's discussions forward and to reconnect in future sessions. Thank you and take care.
>> Thank you very much Dr. Dara for the amazing closing remarks. Uh we really thank Zo city to being part of this initiative. The next stop uh is with University of Sydney on the 23rd of July. I will be sending invitations to all of the participants who joined us today. You can share with your networks and uh to whoever you think might be interested in joining. So thank you very much. The recording will be shared as well once ready. And uh I'm looking forward seeing you at the upcoming sessions. Thank you everyone and have a lovely rest of today. Thank you. Bye.
Up Next
BCI-Based Windows Cursor Control: EEG Signal Processing & Machine Learning
@bmsitmedia8115
568 views•2022-07-11
Introduction to Secure Multiparty Computation with Yehuda Lindell
@fhe_org
7.7K views•2021-02-04
HTTP Requests Explained: GET, POST, PUT, DELETE
@codecademy
103.1K views•2021-10-07

Enigma Machine Mechanics: WWII Encryption Explained
@JaredOwen
13.2M views•2021-12-11
Related Study Plans & Knowledge Roadmaps
Structured learning paths in Computer Science