






















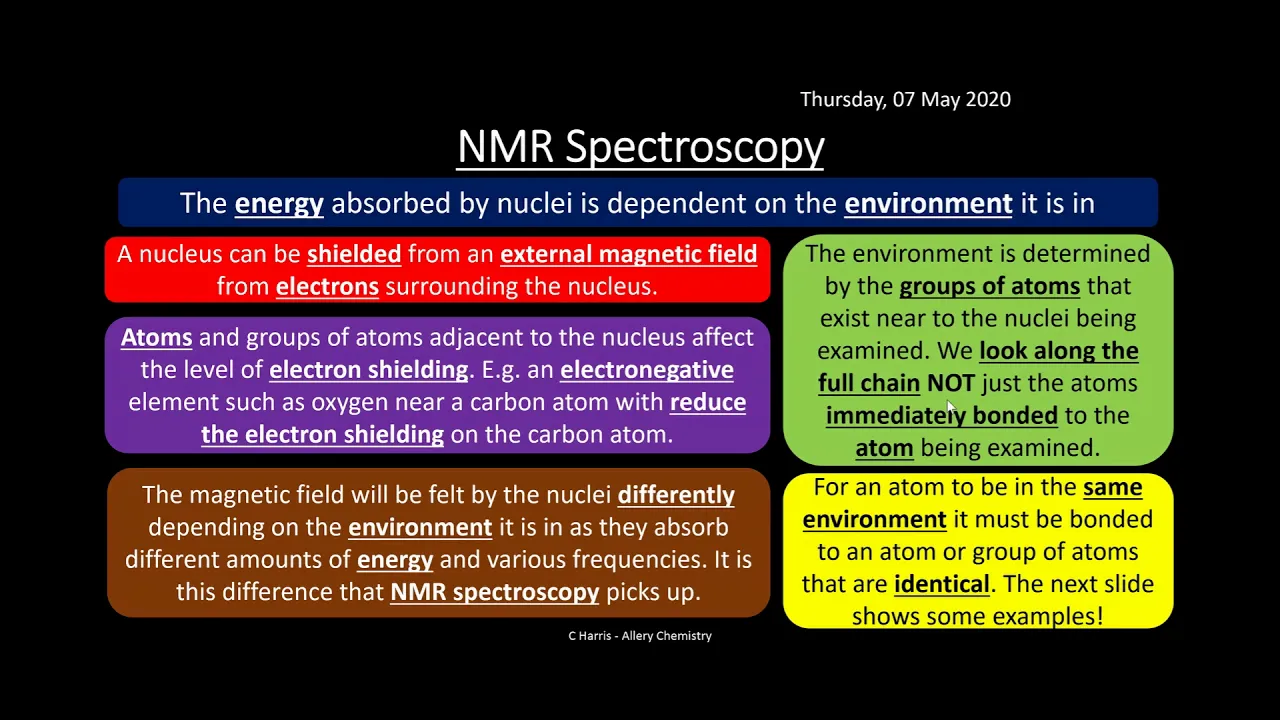
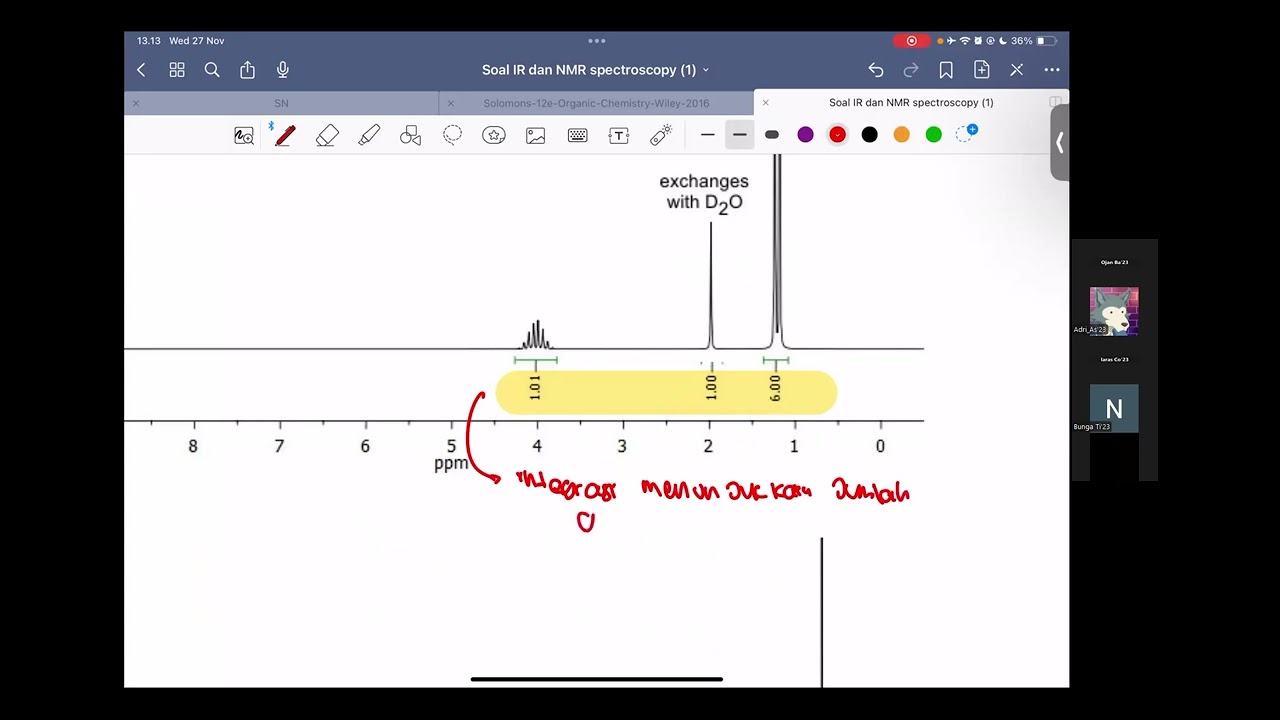

Proton NMR analysis involves interpreting four key aspects of hydrogen peaks: (1) identifying the number and types of unique hydrogen atoms based on molecular symmetry and chemical environment, (2) determining peak splitting patterns using the n+1 rule where the number of neighbors equals tips minus one, (3) recognizing overlapping peaks using the hat trick technique, and (4) interpreting chemical shifts (delta values) ranging from 0-12 ppm to identify functional groups such as alkanes (0.5-2 ppm), halogens (3-5 ppm), aromatics (7 ppm), and carboxylic acids/aldehydes (9-12 ppm).
Proton NMR Interpretation: Analyzing H-NMR Peaks
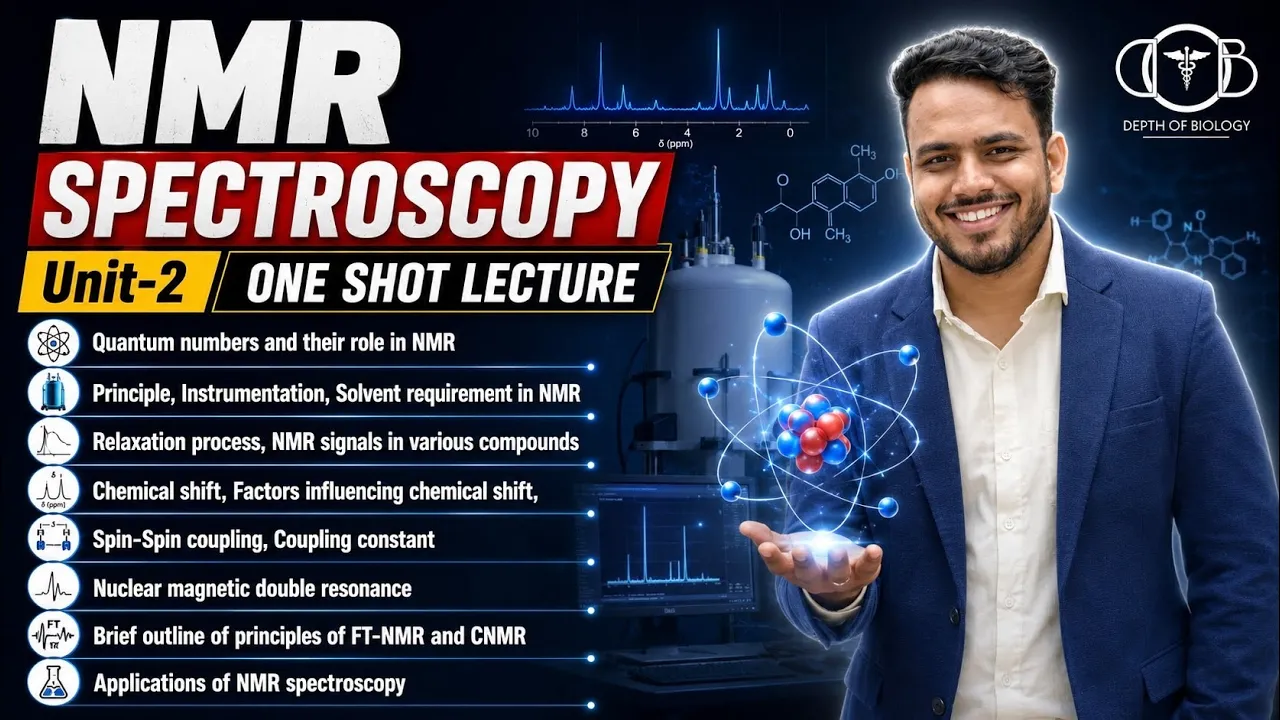
Added:Basic physical principles of NMR spectroscopy, including nuclear spin, magnetic resonance, and the role of the external magnetic field.
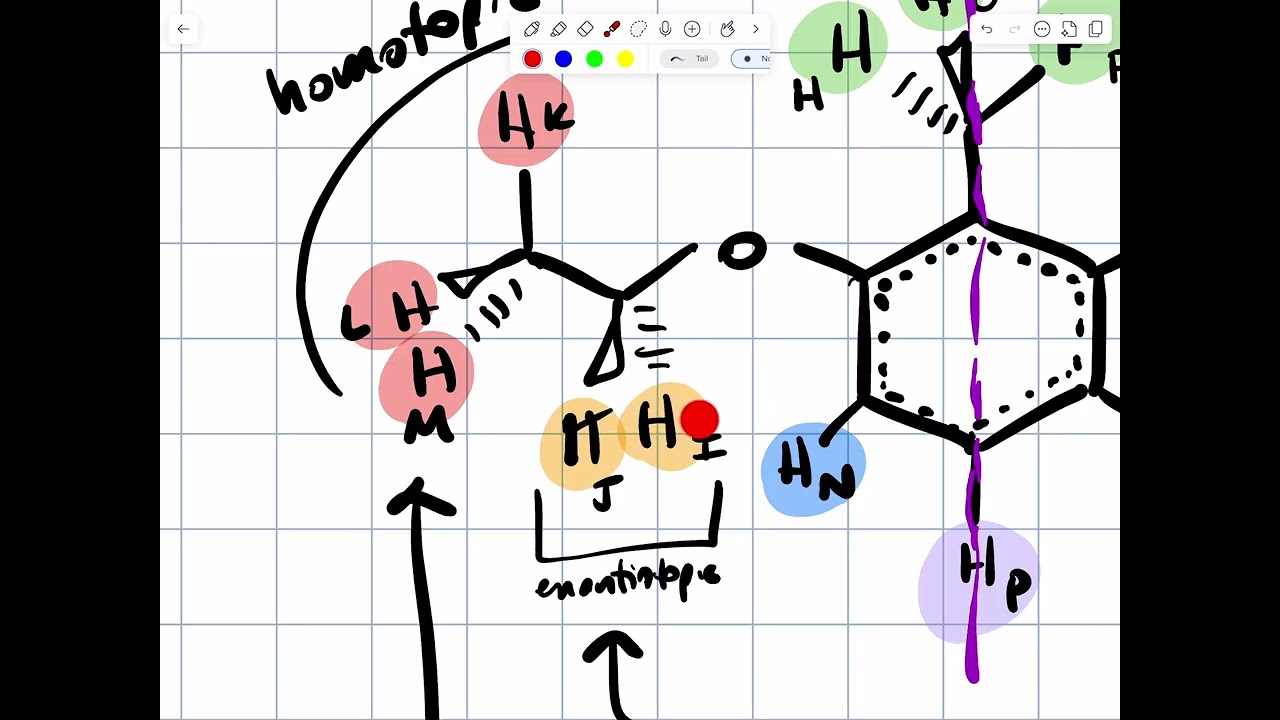
Molecular symmetry and chemical equivalence, allowing the identification of homotopic, enantiotopic, and diastereotopic protons.
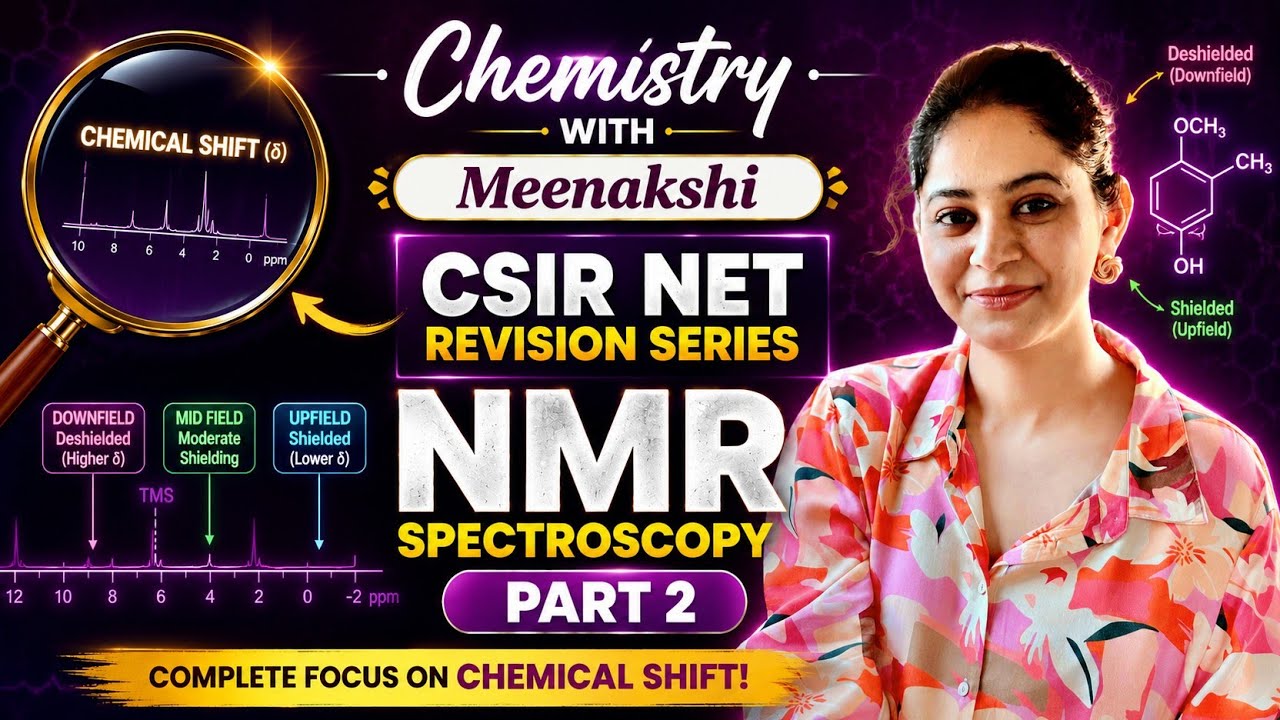
The concept of electron shielding and deshielding caused by local electron density and electronegative elements.
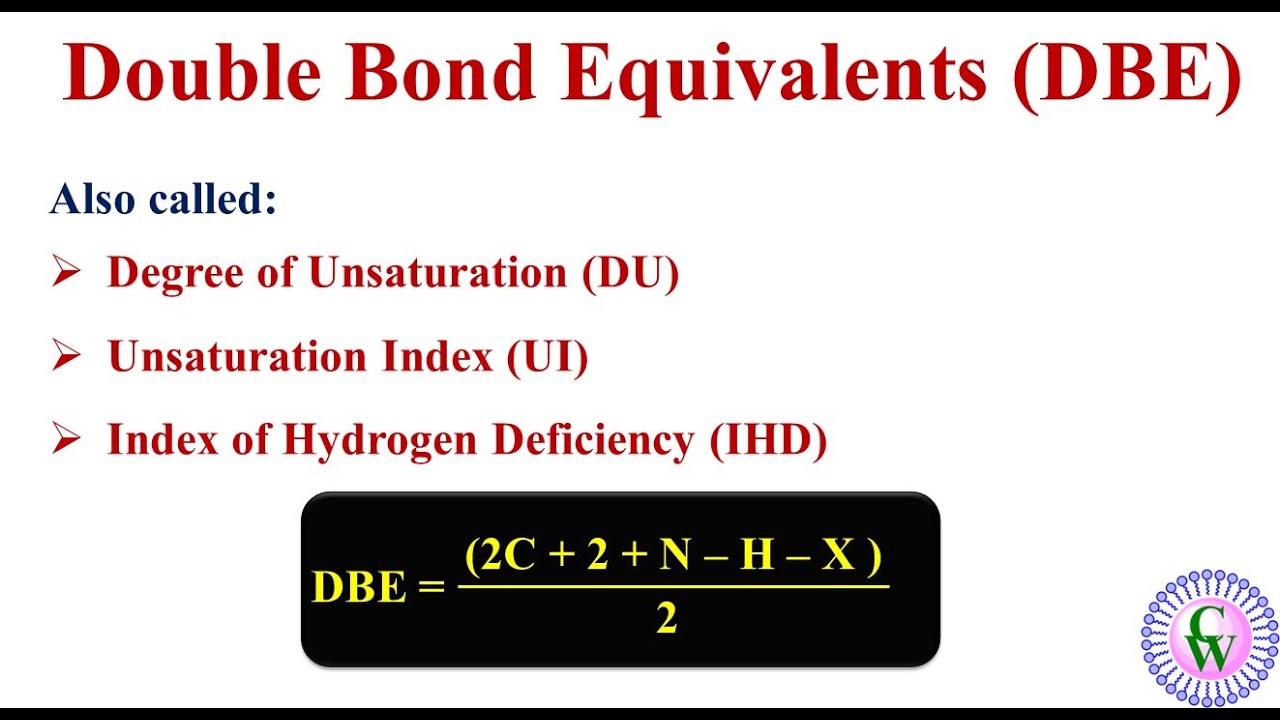
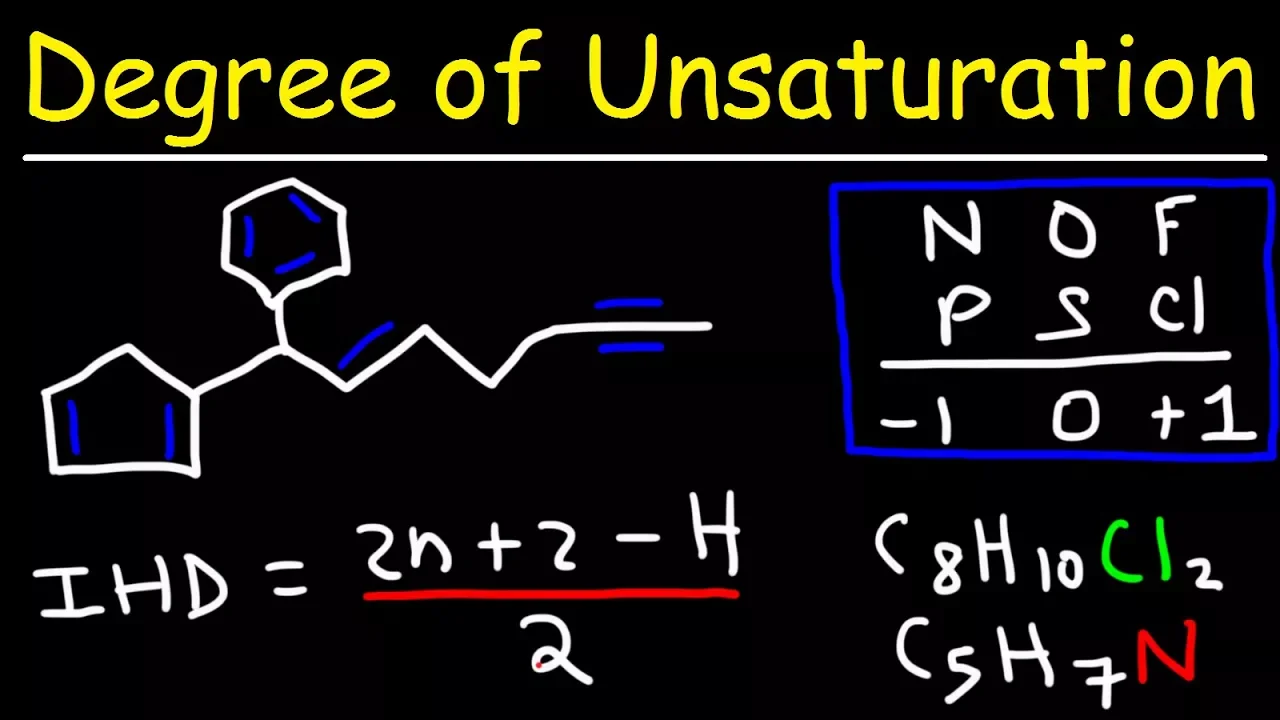
The ability to calculate the Degree of Unsaturation (Index of Hydrogen Deficiency) from a molecular formula to predict rings or pi bonds.
Interpreting Carbon-13 (13C-NMR) spectroscopy to analyze the carbon backbone of organic molecules.
Analyzing complex, non-first-order coupling patterns (such as ABX systems) and diastereotopic proton splitting.
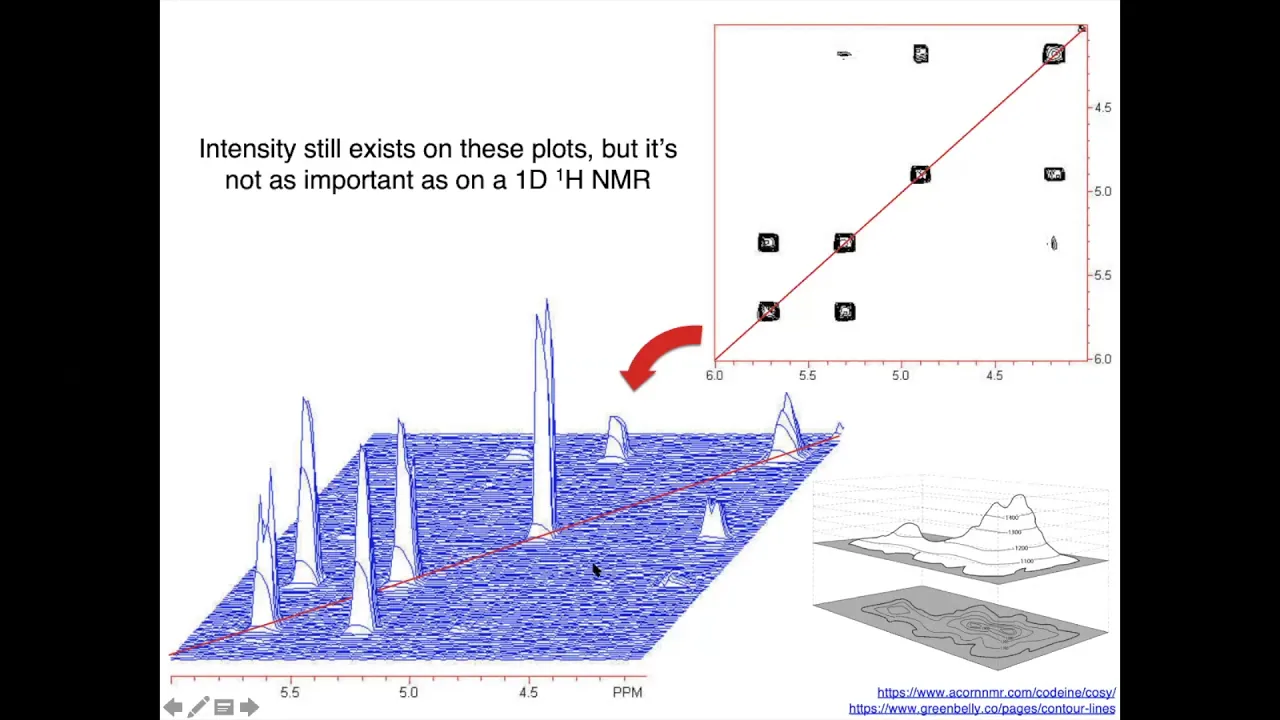
Applying multi-dimensional NMR techniques (such as COSY, HSQC, and HMBC) for structural elucidation of large biomolecules.
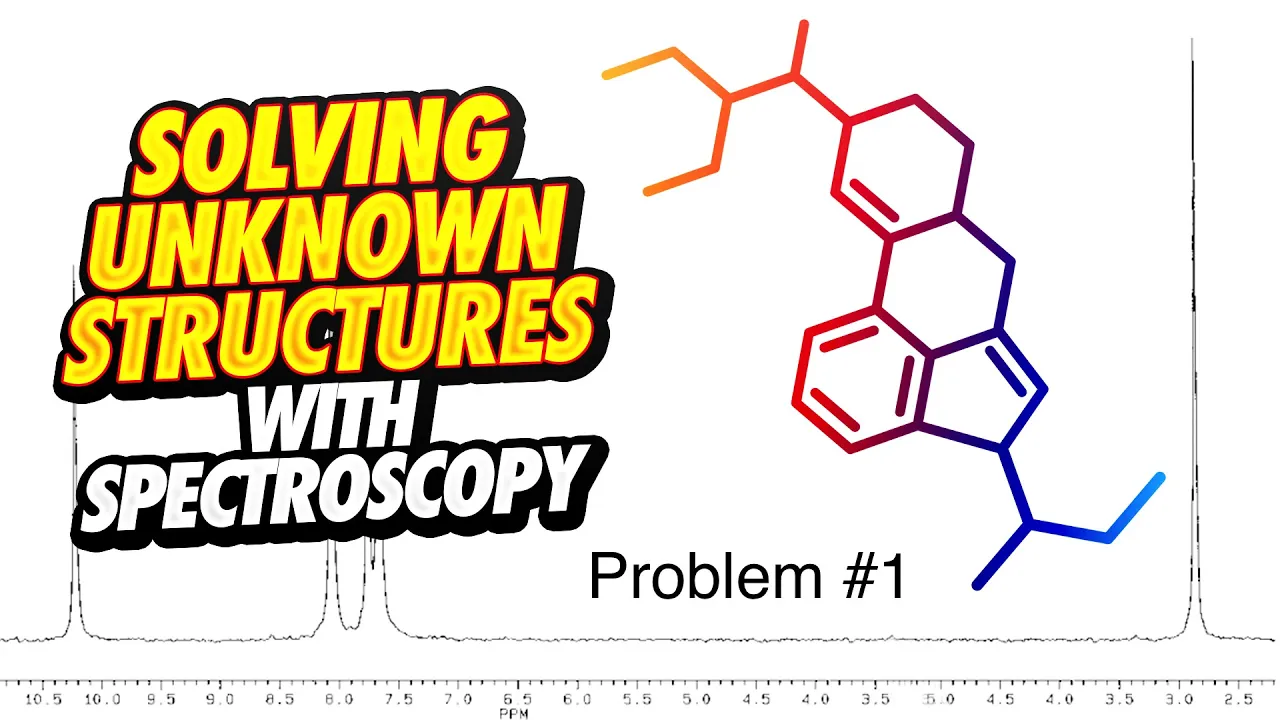
Combined spectral analysis using NMR, Infrared (IR) Spectroscopy, and Mass Spectrometry (MS) to determine completely unknown chemical structures.
1.2M views10.6Klikes11:30Original Release: 2013-01-24
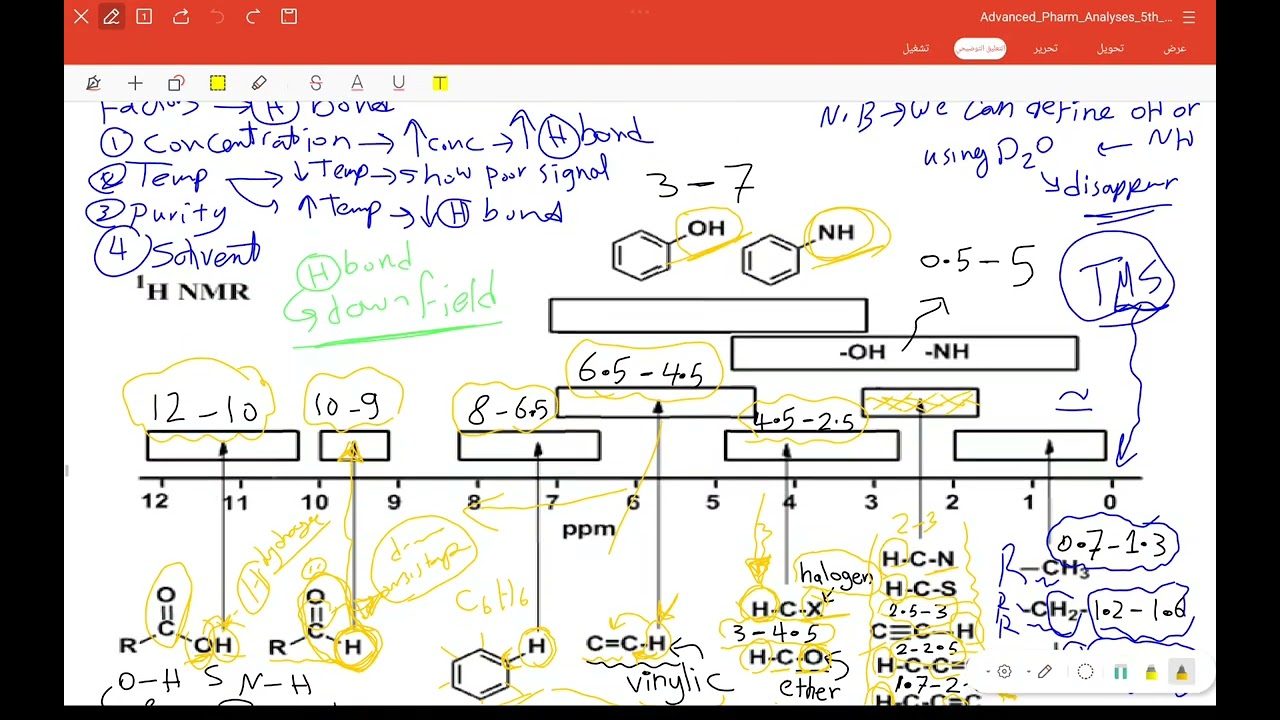
Leia here from Leia for.com and in this video I will show you how to analyze the graph for proton NMR there are four things you want to look at when analyzing the NMR graph first we'll look at how to analyze it and then we'll apply it to a simple example however if you understand what I show you you'll be able to take this information and apply it to more complex examples the first thing you want to look at is the number of hydrogen types when you want to look at the splitting of the peak you want to identify the number and types of neighbors and lastly want to identify the cause of the shift we'll start by looking at the idea of types of hydrogen NMR disregarding how the Machine Works simply analyzes the types of hydrogen that you have in a molecule and the similarities and differences in how it relates to the rest of the molecule so for example if I have something like CH4 since the carbon is surrounded by four equivalent hydrogens I only have one hydrogen type same thing if I have an ethane which is C2 H6 since every hydrogen on this molecule is bound to a carbon that has a carbon next to it with three hydrogens every hydrogen is essentially the same if I look at a longer carbon chain this is when the hydrogen types start to differ for example let's look at the molecule propane that has a total of three carbons and eight hydrogens notice that every hydrogen on the terminal carbon is the same and this is because there is an sp3 bond between the carbon and the central carbon allowing the carbon to rotate and therefore not differentiating between any of the hydrogens however notice that this molecule has a plane of syry so that the carbon on the right is essentially the same as the carbon on the left making the three terminal hydrogens on either side the same this gives me one type of hydrogen and then I have two hydrogens on the central carbon however these are different from the terminal hydrogen based on the fact that they are located on a secondary carbon while the terminal hydrogens are located on a primary Carbon Let's look at one more example a methyl cyclopentane where the hydrogens will be represented by Green lines and I'll draw the hydrogens on the substituent the methyl substituent is different from any other Carbon on the ring and so the three hydrogens on the methyl are considered equivalent the tertiary Carbon on the ring has a unique hydrogen making it one type next to that I have two hydrogens on a secondary carbon however since this is symmetrical the two lower hydrogens on the secondary carbon are also equivalent if I move further to the left it appears that the two hydrogens circled in blue both top and bottom should be the same as the ones I circled in yellow however the blue hydrogens have two hydrogen Neighbors on each side while the yellow hydrogens have two Neighbors on one side but only one neighbor on the other side this makes them different and so in the molecule methyl cyclopentane I have a total of four types of hydrogens as far as an is concerned the next thing we want to look at is the splitting of the Peaks that show up on the NMR graph you will see many different variations and we'll draw out a few examples I will show you how to analyze them disregarding the scientific aspect behind the NMR machine and rather focusing on what this means to your interpretation of the graph let's assume that every hydrogen or hydrogen type has a single Peak to show that it exists on the graph if I have a hydrogen neighbor next to it let's assume that the neighbor simply takes the peak and splits it once that means if I have no neighbors where neighbors will be represented by a lowercase n I will have a single Peak if I have one neighbor this peak is split into two and so I get what's called a doublet if I take this doublet and add a second neighbor for a total of two neighbors I simply add one Peak giving me what's called A Triplet if I add one more for three neighbors I get what's called a quartet the mathematical way of solving this is using the rule of n + 1 where n stands for the number of neighbors plus one for the original Peak therefore I can simply look at the peak on my graph count the number of tips that I see subtract one so it'll be tips minus one and that will give me the number of types of hydrogen neighbors let's engineer this backwards if I see four tips 4 - 1 is three that gives me three neighbors 3 - 1 is two neighbors 2 - 1 is one neighbor and 1 - 1 is zero or no neighbors there is one tricky aspect that can sometimes show up when analyzing Peaks and that's when you have two peaks showing up at approximately the same area on the graph for example let's say you see this on the graph at first glance it appears that you have five tips that means 5 - 1 is four neighbors however if you use what I call the hatrick then you will recognize that this is not one Peak but actually two and the hatrick has to do with a mathematical formula that tells you the height of the individual aspects of the peak but instead of applying a mathematical formula when you are crunch for time draw a simp simple hat on the peak notice that when I draw a triangle over this peak I wind up hitting every single tip same thing for a double it and the same thing applies for this complicated cointet however going back to my original Peak if I try to do the hat trick notice that I have this peak right here that does not fit and so I know that is incorrect however notice I can draw two separate hats or two separate triangles and this shows me that these are actually two peaks that are overlapping on the graph you find the number of neighbors as you analyze the splitting however it's important to mark this on the pieces of your graph so that you can identify how the different pieces of the puzzle fit together for example say I have these two peaks on my graph and I am told that the peak on the right represents two hydrogens and the peak on the left represents three hydrogens assuming the rest of the molecules irrelevant I can look at the peak on the right and determine that it has three neighbors and the peak on the left only has two neighbors using this information together I can say that if the peak on the left has two neighbors and the peak on the right is two hydrogens then the two neighbors are the two hydrogens and the same applies for the three hydrogens on the left that are the three neighbors to the group on the right and that means that these two groups are likely connected in a way that gives me the rest of the molecule bound to a ch2 bound to a ch3 and last but not least we'll look at the chemical shift or the Delta value of the individual Peaks on the graph your NMR graph will range from the number0 to approximately 12 and the Peaks will show up all along the graph if you look at a table you're going to see a very large and very broad set of number values tell which functional groups cause the shift to move and how far to the right and left however instead of memorizing these values I highly recommend that you practice recognizing them for example you might see on the table that the value for alcohol or the hydrogen on the RO ranges somewhere from 1 to 5 this is a very broad number and you can have any other type of peak show up within 1 to 5 so this will not help you Iden ify that you have an alcohol if however you recognize a certain set of basic values and practice identifying how they show up you're more likely to get these values correct the numbers and values that I do recommend memorizing are as follows between the values of 3 to 5 you're going to have your halogens at approximately the number seven is where you will have your aromatics and ranging anywhere from 9 to 12 you'll have the terminal hydrogen on a carox or alide you can analyze the other values that we'll show up but here is my interpretation of the rest of this graph some will call it upfield some will call it upstream and downstream higher shifted or lower shifted I break the table down into two very simple values towards the right I call it boring and towards the left I call it exciting by boring I mean a carbon with hydrogens and nothing too exciting in terms of Highly electronegative groups if you have a straight chain carbon the Peaks will likely show up to the right and that is because there are no highly electronegative atoms to deprotonate the hydrogens and cause them to shift left however look at your halogens your halogens are more exciting and therefore will shift your value towards the left aromatics are even more exciting because they have their own electric field giving you values around seven and finally fin the hydrogen on a carboxilic acid or alide are next to such strong groups these will shift all the way to the left there is one more Peak you want to recognize at zero when you see a small line especially with the letters TMS written next to it don't worry about this TMS is what is used to zeroize or create a basis for where the numbers will show up on the graph and that is not part of your molecule so don't worry about it and now let's apply this concept to the example drawn here are you struggling with organ chemistry are you looking for information to guide you through the course and help you succeed if so download my ebook 10 secrets to acing organic chemistry using the link below or visit leer side / orgos secrets that's o rgo Secrets if you enjoyed this video please give it a thumbs up and even share it with a friend or two if you have any questions regarding this video leave a comment below or contact me through my Facebook page at facebook.com/ forai there will be many related videos posted over the course of the semester so go ahead and click the Subscribe button to ensure that you don't miss out
Up Next

6:09
Coupling Constant in NMR Spectroscopy: Organic Chemistry Explained
@readysetorgo
316.2K views•2014-07-28
83:56
Biocatalysis and Catalysis in Islatravir Synthesis | Merck Webinar
@SCIwheresciencemeetsbusiness
675 views•2020-10-08
10:06
1H NMR: Determining Number of Peaks from Structure
@MSJChem
59.2K views•2017-04-06

17:31
Edible Water Bottles: A DIY Guide to Sodium Alginate Spherification
@ryan
10.5M views•2019-06-21
Related Study Plans & Knowledge Roadmaps
Structured learning paths in Chemistry
chemistry
Nuclear Chemistry: Decay, Meds & Fuel Cycle
01Introduction to Nuclear Structure and Radioactivity
02Decay Dynamics and Kinetics
03Radiation Interaction and Detection
+ 2 more learning modules
24h5 modules
Explore Roadmap
chemistry
Supramolecular Chemistry: Forces & Machines
01Foundations of Chemical Bonding and Intermolecular Forces
02Introduction to Host-Guest Chemistry
03Thermodynamics and Dynamics of Self-Assembly
+ 2 more learning modules
16h5 modules
Explore Roadmap
chemistry
Photochemistry: Excited States & Reactions
01Foundations of Light-Matter Interactions
02Molecular Orbitals and Electronic States
03Photophysical Processes and Jablonski Diagrams
+ 2 more learning modules
18h5 modules
Explore Roadmap
chemistry
Coordination Chemistry: Bonding & Properties
01Introduction to Transition Metals and Ligands
02Crystal Field Theory (CFT) and Geometry
03Magnetic Behavior and Spin States
+ 2 more learning modules
14h5 modules
Explore Roadmap