








![Journey to the Edge of the Universe [4K]](https://i.ytimg.com/vi_webp/QhM5zAVvOI4/maxresdefault.webp)




![[Galaxies SIG] Don't You (Forget About Cosmic Noon) - Allison Strom](https://i.ytimg.com/vi/ckAJN6t_u8s/maxresdefault.jpg)



![제임스 웹 우주망원경! 볼 수 없는 은하를 관측했다?! 천문학을 뒤흔들 가능성이 있는 놀라운 발견, 재이온화시대에 만들어진 은하라니?! [안될과학 랩미팅]](https://i.ytimg.com/vi/8C8J4MvrODc/maxresdefault.jpg)

![[Galaxies SIG] Understanding the Production and Escape of Ionizing Photons with HWO - Anne Jaskot](https://i.ytimg.com/vi/E4EDn-KWie4/maxresdefault.jpg)




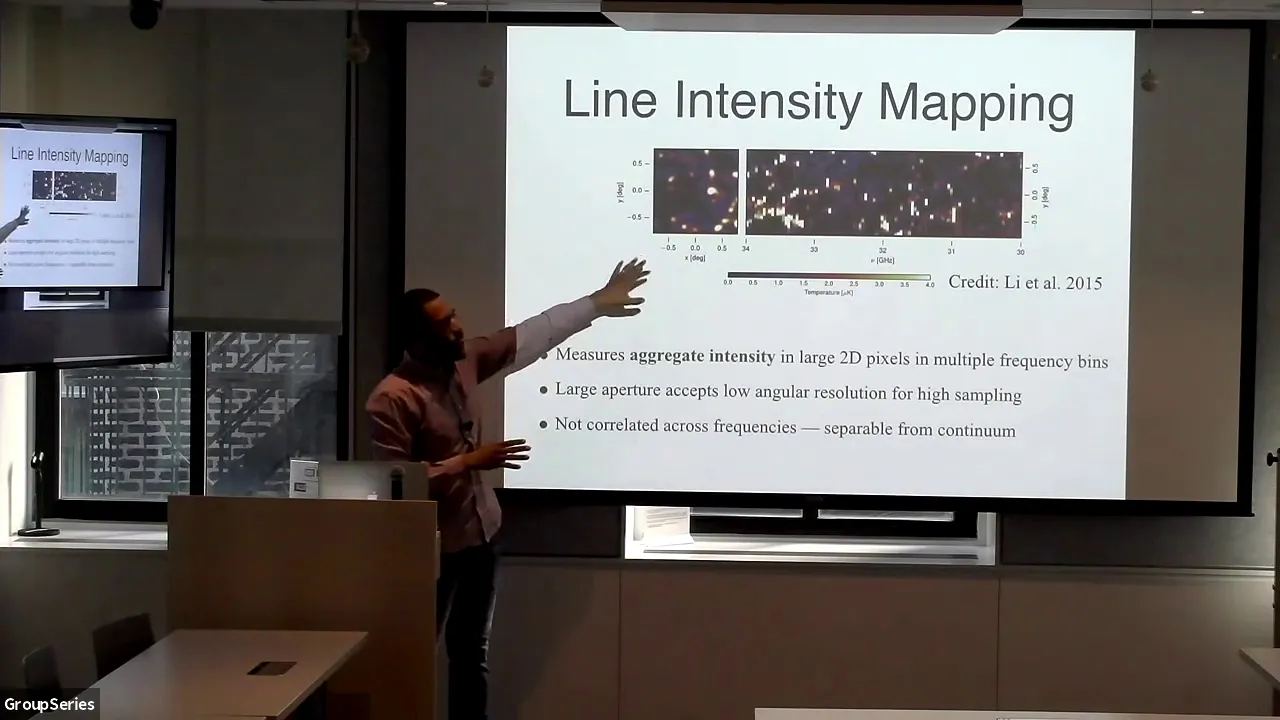


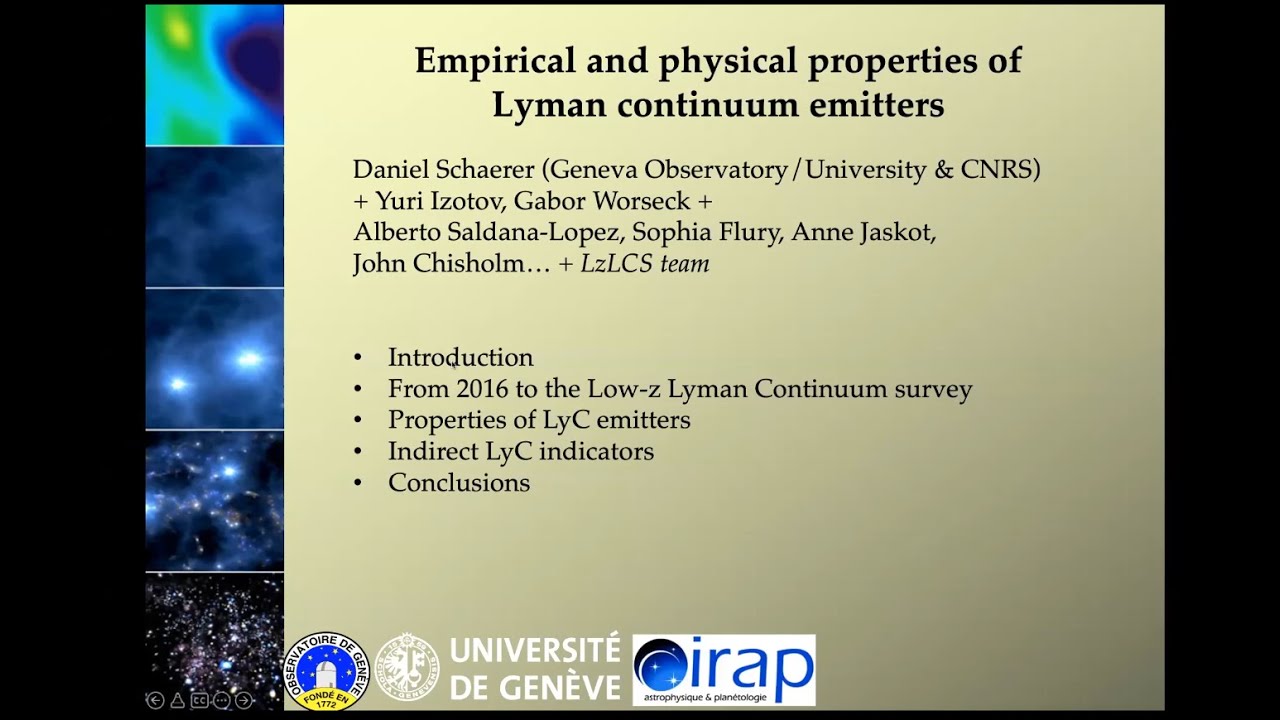
Lyman-alpha emitting galaxies (LAEs) are crucial tracers of star formation and reionization in the early universe because their strong Lyman-alpha emission line (intrinsically 8-9 times brighter than H-alpha) can escape galaxies more easily than continuum light, allowing detection of low-mass, young galaxies that would otherwise be obscured by dust. However, LAEs typically show lower stellar masses and different properties compared to H-alpha selected galaxies due to resonant scattering of Lyman-alpha photons through neutral hydrogen in the interstellar medium, which reduces the escape fraction. Studies of LAEs at redshift 2 reveal they have stellar masses comparable to the Milky Way progenitor (~10^10 solar masses), star formation rates of ~5 solar masses per year, and exhibit outflows indicated by asymmetric Lyman-alpha profiles. The correlation between Lyman-alpha peak separation and ionizing photon escape fraction provides a method to estimate which galaxies contributed to cosmic reionization, with typical escape fractions of 5-10% for LAEs at z=2 being consistent with the values needed for galaxies to drive reionization.
Lyman-Alpha Emitting Galaxies From Reionization to Cosmic Noon | Jorryt Matthee (ETH)
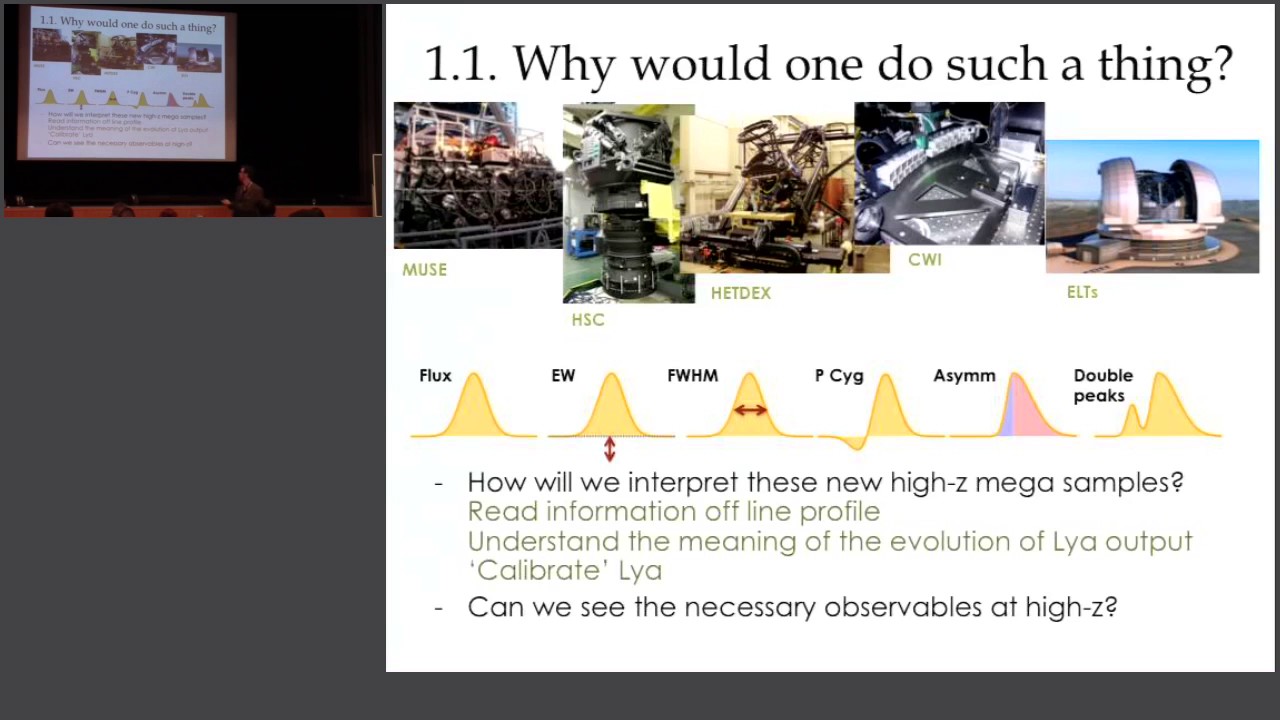
Added:okay welcome to the friday astrophysics seminar at the institute for computational science uh today it's my pleasure to introduce dr eurid mate um yuri did his masters in in leiden with um with uh with yorkshire and he stayed enlightened i think for his phd and is now at zwiki fellow at the university of zurich uh so euret is an expert in galaxy evolution especially galaxy formation at early cosmic times both observationally but he also uh he also works on computer simulations so he's you know a well-rounded astrophysicist and today he will introduce us to lyman alpha emitting galaxies from the epoch of organization to cosmic node thank you just before while i'm starting my slides indeed i prepared a full talk on live and alpha emitters if people are interested in the simulation part i actually have backup slides so in case you want to hear more after we can we i'm happy to discuss that yes it's nice to be here i'm actually in zurich as well so i still feel i'm actually at the at the venue um so um yeah so as robert introduced i'll talk about observational results of irish lime and alpha emitting galaxies and to introduce that i think it's good to have a bit broader background why why alignment alpha and the main questions really behind my work are very basic questions how galaxies form in the other universe i'm particularly excited in understanding understanding the earliest phases of galaxy formation and very related question to this is how did stars and galaxies reionize the universe i think most people agree now that stars were responsible for unionization and that the contribution from quasars is likely subdominant and what are really key what's really the key in observable for these kinds of questions are is basically young stars you want to observe young stars in distant galaxies but stars are continuum sources and it's hard to detect continuum sources in particular spectroscopically if you want to take spectra and also stars ionize gas around them and that gas will shine in emission lines which are much typically much brighter and for that reason i am mostly observing emission line galaxies in particular because young galaxies with young stars will have very strong emission lines if we want to get a complete senses of star formation i think that the best emission lines to use are hydrogen emission lines so you're not sensitive to metallicity and very bright hydrogen emission lines are the balmer alpha which is indicated by the red line and the lyman alpha lyman alpha line these are this line the strengths of these lines are related because they are from similar transitions the h-alpha line the balmer alpha line is is known particularly in the local universe to be an excellent tracer for very recent star formation because it's basically shining when very young stars with ages less than 10 mega years ionize ionize the gas it's also relatively red it's 650 nanometers which means that it's not very susceptible to attenuation only in the most extreme dusty environments but in typical environments the attenuation is mild on the other hand the lyman alpha line which is the line i'm mostly studying and this is a line in the very ultraviolet part of the spectrum that means it's much harder to observe in the local universe because our own atmosphere blocks it are actually our own solar system emits lime and alpha light so that's a bit complicated but for distant galaxies it's easy to observe because of redshift this line is intrinsically brighter than h alpha by a factor eight to nine which is it's nice um but it's very susceptible to dust because it's in there it's a very blue uv emission line and what's particularly important is that the transition is a resonant transition which means that when lyman alpha photons travel through the interstellar medium and also intergalactic or circumcollective media they can scatter if there's neutral hydrogen and this will change this will basically change the the way how much and the way how the way we see these lyman alpha photons and just from an observational side this is the star cosmic star formation ray density mapped with various tracers and if we want to map this with these bomb or emission lines which are very sensitive traces to back to recent star formation we can do this with age alpha out to red shifts here from zero to redshift two and a half roughly from the ground and this is set by by the atmospheric emission at higher redshifts the alpha line is redshifted to the mid infrared and our own atmosphere is too bright this will change of course when we have the spectrograph on the james webb space telescope which will open up which will basically open up a gel flap for all the higher redshifts the lyman alpha line on the other hand it's much easier to observe at high redshifts because then it's red frame uv that brave wavelength is red-shifted into the optical where we where it passes through the atmosphere and where we can observe it with our best instruments as you can see here there's a small wavelength redshift range where these lines overlap [Music] this is about redshift2 it happens to coincide with the peak of star formation activity and this is the ratchet range that i've been studying a lot to look at galaxies in both these emission lines because we know that the intrinsic strengths of these emission lines are related and this is the highest redshifts where you can do that and this will allow us to to basically connect our view of the lower redshift universe where we have much more observables of distant galaxies to very high ratchet galaxies where we can typically see lyman alpha and actually for many galaxies we only see lyman alpha so with this survey which is called the extruder lyman alpha survey we are studying these questions what are actually lime enough emitters and um i will explain this in more detail we will also investigate how the lyman alpha emission lines um what they can teach us about the escape fraction of ionizing photons which is an extremely important quantity to know and i'll explain that in detail um the second part of my talk um as i said before the talk started my talk is a bit modular so we'll see if i can actually address all these case all these different points depending on just depending on the time i have a few slides on case studies of bright galaxies that we have seen in the very very early universe one case study on a galaxy that we know that resides in a highly ionized bubble um one galaxy where we can actually see circum galactic gas around it and the very recent work which i'm sure that i'll present is the work to to actually look at the stars directly in such a bright galaxy instead of looking at the emission lines all right so about this redshift tool survey so the first thing to do is if you are interested in what are in understanding what makes a galaxy alignment alpha emitter is doing a consensus survey and that's what we did with this um with this double with a double narrowband technique and what we did is that we observed a part of the part of the sky called the cosmos field with two filters and those filters select emission lines and particularly alpha and lamin alpha lines and a matched redshifts so we can actually select galaxies through h alpha emission and alignment alpha emission blindly and simultaneously so in the volume in this volume of the cosmic cosmos fields we can basically see um h alpha limit alpha for all galaxies and what we see however is that in the java data set we see this red spatial distribution of galaxies it's quite a nice clustering there's actually protocluster as you can see here it's actually spectroscopically confirmed now to be a protocluster um if we switch to the lyman alpha view the spatial distribution actually looks quite different even though this is actually the same redshift and should be the same galaxies um if we also look at the galaxies the properties of these different galaxies selected in these different ways they're quite different so for the each alpha view we say we see 600 galaxies with masses comparable to the current mass of the milky way uh while for lamb and alpha we actually see much lower mass galaxies and the actual limiting luminosities are comparable for these lines so what this tells you is that with lyman alpha you pick up much more low mass galaxies compared to h alpha and the actual samples that for which we detect both these lines directly are they barely overlap even even though from principle you you expect that they would overlap what this means that is that for most of these h alpha emitters which tend to be more massive galaxies the lyman alpha line is too faint and this means that the lyme enough escape fraction like the fraction of these photons that are produced which we can estimate from age alpha it's basically very low so we don't see it anymore and on the other hand for these lyme and alpha emitters they are typically much veins or galaxies with low star formation rates and the age alpha line is defined that's a bit unfortunate and there's only a small overlap in this in this example and the real question basically is is why is lamin alpha escape fraction low or why does the alarm enough escape fraction apparently vary uh with stellar mass so that has to do with scattering so just to explain that a bit this is a very simple toy picture of a galaxy as we observe there are stars that in an h2 region and in this h2 region lime and alpha photons are produced and they travel towards us through the interstellar medium and in this picture only the ism only has neutral hydrogen there's no dust um the uv continuum photons they can just travel directly as i said there's no dust some lime and alpha photons may be lucky and actually not encounter any hydrogen along the way the chance is very low of course that's basically hydrogen everywhere what's much more likely to happen is that lime and alpha photons will encounter neutral hydrogen due to resonance scattering the photons will be absorbed and re-emitted in the in a random direction and with a velocity shift and only a fraction of them will actually um may actually be observed may actually be in our sight line what's actually much more likely is that there's actually dust in many of these hydrogen clouds which means that many of these lyman alpha photons that should travel towards us and they they had a much longer they traveled much longer path length because they are scattering in the ism they're basically locked or trapped in the ism much longer than normal uv continuum photons and that makes the likelihood of being absorbed by a dust particle much higher and this is the main mechanism why the lyman alphascape fraction is low in massive galaxies where there tends to be dust this is the basic picture but quantitatively of course this is a poorly understood process it also depends on many properties like the actual velocities and spatial distribution and to try to understand this in a more quantitative way we are have been doing this exude alignment alpha survey which is a survey of 35 galaxies observed with extruder that's extruder is a spectrograph on the vlt and it's the unique thing about exchuter is that it covers the entire wavelet range that you can observe from the ground in one go but the downside is you do it for one galaxy at the time the resolution is also quite good in spectral resolution it's a factor about four better than typical uh instruments used for for for galaxy surveys uh at high rate shifts and that's nice for lyman alpha profile studies to tell well i'll present so we observed 35 this lime and alpha meter for about three hours per source and note we selected only galaxies that we know are lime and alpha emitter so that's a bias in the sample and what we can do is then see what are the properties of these galaxies how do these properties compare to other known galaxy population so i'll present results on the stacked spectrum because stacked spectrum has a nice signal to noise and it basically shows the average spectrum of such a such a galaxy the average laminator as you can see has a it's strongly dominated by line emission there's lyman alpha on the left by selection and we see other emission lines as well hr found fully on the on the right oxygen 3 and h beta and around 5000 angstroms and a few other features now there are some gaps in this wavelength coverage and those are due to features of the of our atmosphere but um the survey was designed specifically such as the wavelength of these gaps are actually not very important for our science cases and so what we see from this spectrum is that indeed these galaxies have tend to have a low mass typical lime and alpha materials had are actually milky way in terms of their stellar mass they are milky way progenitors they had the stellar mass that the milky way had apparently likely had 10 giga years ago and the star formation rate of these galaxies is around five solar masses a year which i think is slightly higher than what what are the estimates of the star formation rate of the milky way back then and also what we see from the spectra is that the the dust attenuation as we expect is it's very mild and there's not that much dust but simultaneously i know that this dust generation is expected to be low for all galaxies with comparable mass so what we can already see from this is that while we select lime and alpha emitters which are expected to be just for galaxies we actually get similar dust attenuations as normal galaxies for these types of masses which is interesting um just to go quickly through this this is um with with all these line ratios we can show that the the galaxies are actually powered by star formation and not by aegean activity um this is i don't think it's very surprising given their low mass what is nice is that we can actually constrain the ages from these line line um equivalent widths so the galaxies are actually very young on average and from uv emission lines in particular helium-2 which is a emission line it's actually the balmer alpha line from the helium atom the ionization energy is 54 electron volts so you need extremely hard ionizing photons to be able to see this emitting this line and emission we see it very faintly i must admit but from the strength of this helium line we can actually get a very good idea of the stellar metallicity of the stars that power these lines because you need very hot stars to be to ionize helium and stars that are hot tend to be very metal poor so we can actually get an idea of the metal metallicity of the stars and it's it's quite low um not unexpected of course by ratchet just looking at the star formation rate um the star formation rates are similar to the dust attenuation they are quite normal given the stellar mass i have to say that actually our star formation rate calibrations may not be applicable to these kinds of galaxies because they depend on the standard metallicities if you convert a jar for luminosity to a star formation rate there are assumptions there um but if we assume if we use the metallicity that we think is applicable uh we would conclude that these galaxies are actually quite normal uh for their star formation rate they have normal star information rates given their stellar mass so these are not particularly bursty galaxies not particularly worthy not particularly testing we can do chemical abundances as well i'll skip this um what is what we do see what is quite unique is that we see um it's not necessarily unique but it's quite ubiquitous we see outflows being present in these low mass galaxies with a variety of tracers um i'm listing three of them and i think all these independently from each other indicate that there are outflows in the installer medium the first is the lyman alpha profile i'll go i'll come back to that later but the shape of the lyman alpha profile is skewed towards the red you see two peaks and the fact that the rather beak is brighter than the bluer indicates that the lyman alpha photons scatter through an outflowing medium and then in the oxygen tree line we actually see broad wings in the ionized they're brought they're brought basically something that broadens the ionized gas which could be an outflow and then most i think most directly is basically down the barrel the direction of outflows by absorbing uh interstellar gas which is blue shifted with respect to the systemic redshift so all these three um um observations indicates that there are outflows present in these quite low mass galaxies and summarizing all these different observations of galaxies and comparing them to more luminous galaxy samples at different redshifts we can try to get the picture of what makes a galaxy alignment emitter and that's summarized in this picture and on the left i show a galaxy for which i would say there's a highly high likelihood that we observe it as a limit alphabet and on the right the opposite and there we identify three different processes the first is simple galaxies need to be young and they need to have star formation because otherwise they don't emit emission lines we see actually that the star the specific star formation rate which is the relative star from x-ray to the stellar mouse it's not very it's quite similar to other galaxies with comparable mass so this doesn't seem to be the main distinguisher of what makes a galaxy alignment alpha meter as i said the dust attenuation needs to be low otherwise it's hard to see uv emission lines but again the dust attenuation is not extremely low so it's likely that the third explanation is the most important in determining whether galaxies align alpha meter or not and that is basically that there need to be paths for these lime and alpha photons to escape easily through the ism there are two ways to do that either there are basically chimneys in the interstellar medium through which there's basically no neutral hydrogen or very very small golem densities and the laminar photos can easily escape through those chimneys or just in general the h1 density is lower so that there's less scattering events and less basically that makes the effect of dust attenuation it makes the likelihood of the laminar photosynchronic dust lower and so you can have basically those those white channels or the color grade scale being different between these two different scenarios and i think it's interesting to speculate a bit on why for lyman alpha emitters this is the case that apparently the the h1 column density is different and one explanation is just that this it is a stochastic effect uh it's just a viewing angle effect that we all galaxies have a similar uh um the similar h1 distribution if you average overall sidelines but we happen to pick up lime and alpha meter if we look at a fortunate sight line could also be that there just simply are more favorable sidelines for galaxies with certain characteristics for example galaxies that have strong outflows they may be able to drive such holes in the ism and then therefore we may be able to observe them as lime and alpha emitters and did these and these two things are open questions too to be studied in more detail um also by having proper comparison examples um just to move on how common why do we care about laminators how common are they um and to answer that i'm actually going to wonder what how what the entire universe would be and what kind of line alpha emitter the entire universe would be we can just simply instead of having looking at the uh looking at individual galaxies we can basically sum the entire star formation rate of the universe sum the entire alignment alpha luminosity density of the universe and calculate the laminar fatscape fraction of galaxies in the universe and so you can do that using luminosity functions that are known over redshift interval and you can see that the ratio of the lyman alpha to the star formation rate density increases by an order of magnitude from redshift two to six basically the globally average escape fraction is around two and a half percent at ratchet two and it's forty percent or thirty percent at right six so our bias sample at redshift2 is sits actually here and what what you can see is that it actually is comparable so even though this is a biased sample ratchet two it's comparable to the cosmic mean at very high redshifts at the e-book of reunionization and what i think this implies is that if we move from studying galaxy samples at the peak of star formation history many galaxies will uh will look like the galaxies on the left um but if we move towards the more distant universe we expect that most galaxies tend to be lime enough emitters their ism conditions tend to tend to favor mine alphascape which means that we can basically predict all these properties that there will be higher equivalent widths there will be less dust the ism will be more highly ionized and these fraction of low density sidelines will be higher and all these things can easily be tested in the future with without the rest frame optical spectrals could be all right so that's about what makes galaxy's lime health emitters um now i want to talk a bit about what we can learn from the escape fraction of ionizing photons using lyman alpha profiles and i need to explain a bit on laminar profiles to do that so um as i said lime and alpha photon scatter um if if they're emit if we would if they would not scatter we would see a lyman alpha profile that would simply be a gaussian following the the motions in the h2 region that emit the photons if they encounter our neutral hydrogen gas we expect the photons to be redistributed to the wings because of resonant scattering and if the gas is outflowing we expect that the rather photons can actually travel through this gas more easily than the bluer photons so we expect a profile that looks like this if the gas would be inflowing that would this would flip of course um if we look at the average profile of the redshift two galaxies we we see this outfit this profile is characterized by outflows the velocity shifts of the red line to the systemic which is basically the position of the peak is about 200 kilometers per second and that's much lower than what has been reported in much brighter galaxies which tells us that there is the velocity shift is sensitive to the h1 column density and this tells us therefore that brighter galaxies have a higher colon density and what is also interesting is that we actually if we select galaxies online when alpha we actually see similar profiles all the way from redshift 0 and measured by hst uv spectroscopy to ratchet six and which is quite interesting and it's it's it's nice if you want to use live and alpha profiles to learn something about realization that i i will address what i want to show here is this main result found by izato avadal on the lime enough as time continuum escape fraction so the lymphotium escape fraction basically says how many ionizing photons that stars produce escape from uh from a galaxy and this is a extremely important property in order to understand which galaxies reionize the universe because ionizing photons reignites the universe and it has a long history of being very difficult to measure particularly high redshift where we have the lyman alpha force blocking all that emission but even at low redshifts because it was found that most galaxies actually don't have a basically have not have a zero escape fraction and recently there has been a lot of progress and um there are escape fraction measurements and what has been found is that there is a very clear correlation between the escape fraction which is extremely hard to measure and the peak separation of the lime and alpha line which is actually not very hard to measure and this is the best correlation that has been found by numerous of studies and this makes it nice because this means that we can get an indirect estimate of the ionizing escape fraction from the lyman alpha profile so we can do that for this for this galaxy sample and i'll skip it a bit and we actually find a few different uh it's a bit detailed it's i don't have the time to explain all the detail but i'm happy to explain that answer our questions there are a few different calibrations but the calibrations on average agree that the for these typical lyman alpha meters and redshift 2 which i have seen are comparable to average galaxies in the epic of the escape fraction of ionizing photons is around five to ten percent uh as indicated from the lyman alpha profile and this is around the right number that we need for galaxies to drive uh realization and this is quite a nice result because for a long time the the inference has actually indicated a much lower number but but from these lyme and alpha profile we can change that estimate of course the average number is i don't think super interesting it's nice that it works but what you really want to know is which galaxies have a higher escape fraction compared to others because this impacts the morphology of renalization for example massive galaxies have a higher escape fraction and then you expect realization really to be to start first in the most over-dense regions on the other hand if low-mass galaxies have a much higher escape fraction you expect it to be much more homogeneous um modulo clustering effects of course but the the prop galaxy property dependence of the escape fraction is very important and this is ongoing work to try to map this dependency with lime and alpha profiles and just want to highlight some ongoing results is that well we see this average lyman alpha profile that is really well understood with this double peaked profile scene from which you can explain with scattering only we see these two galaxies which are showing either a triple peaked liman alpha line which is this blue line in the middle um that is basically indicating a two component ism structure whereas part of the lyman alpha photons actually scattered and part of the line enough photos did not and in this like more extreme galaxy on the on the right we actually see that the lyman alpha profile is almost the same as the h alpha profile which indicates that there's hardly any neutral gas in the ism from the direction of the stars to to us so these galaxies are really exciting because they indicate um high escape fraction of ionizing photons and we can use these to to see what's what's what is uh really causing this um all right so i was rushing a bit because i want to move on um so i want to move on to a few of these case studies of what we can do at the highest spreadsheet where observations are very challenging just because galaxies are very distant and sources are very faint um we also only have a limited wavelength coverage where we can see galaxies but it's already exciting to show what we possibly can do and i'll just go through these all these these case studies and as you will see many of these case studies rely on results or the interpretation of these observations rely on results that i've shown before um and the first case study is a highly ionized bubble and richard 6.6 so as i said before the lyman alpha line is used as a tracer of when reunionization happens this is shown in this illustration on the left when galaxies are when the universe is not fully reionized when there's neutral gas in the intergalactic medium [Music] whether galaxies reside in ionized bubbles or not will affect how we see darham and alpha line if a galaxy is in an ionized fairly large ionized bubble um first let's if a galaxy is in a fully ionized universe we can see the lyman alpha profile exactly how it escapes the interstellar medium as a double peak if there is some neutral gas we expect that the blue or peak will be absorbed by intervening and by the intervening neutral gas in the intergalactic medium so we expect that if we move from redshift 2 to 7 we expect that the profiles change from this to this this is indeed what is observed most lime and alpha lines look like a single red peak likely because the intergalactic medium absorbed the bluer part of the line if the galaxy is even more neutral and ionized regions around galaxies are smaller and this absorption wing moves to the red and you actually start to lose laminar from galaxies and the way how much this happens depends on the neutral fraction of the intergalactic medium and it depends on how this actually how this line profile from emerges from galaxies um but so this is used by by doing these kinds of measurements for very large samples of galaxies people have been using this kind these this fact to infer the neutral fraction of the intergalactic medium in particular at redshifts above seven where we don't know about that many quasars so quasar measurements are much harder ways our absorption lines are saturated because the neutral fractions are higher than 10 to the minus five and above those uh neutral fractions the absorption lines from the alignment alpha force basically is completely saturated um and we don't have sk ska yet so you want to do something um so we so people have been using laminate lines to do this um so one exciting galaxy that we discovered actually it was discovered by a hawaiian team and we confirmed this discovery is this galaxy that they called cola1 and this is actually the first galaxy for which we still see a double peaked lemon alpha line even though the redshift is 6.6 so it's an extremely all simulation all hydro simulations that are built to study realization actually predicts that those galaxies should not be observable so but that is because they assume a uniform uv background but what what we what this this the detection of this galaxy of this lime and alpha line means that this galaxy resides in a highly ionized bubble um we can put a lower limit on the size of this bubble based on the velocity out to which we see it and what is interesting is that as i showed before the peak separation of these lyman alpha lines is a tracer of the ionizing escape fraction so what we can do is for this galaxy we can actually measure the ionizing escape fraction so you can measure the contribution to the local uv background from this galaxy and then work out if this is enough to ionize this region um it turns out that it it's very unlikely to be enough so so even though we know that this galaxy resides in an ionized region and we can quantify its own contribution and we know that there need to be more ionizing sources and for to to try to find those we got awarded a jim's web program to blindly search for galaxies in the ionized bubble um with with with the grayson spectrograph so we will find all galaxies out to some star formation rate limit and then we can address whether those galaxies so we can either find the right sin the scenario on the right but we see that there are some moderately bright galaxies around this galaxy um basically an over density that helps ionizing this bubble or we can actually not find that and that actually may mean that the the ionized bubble is actually driven by unseen even fainter galaxies so you can indirectly learn something about which galaxies realize the universe from from the set of observations at least that's the that's the hope um the second case study that i quickly want to show is another galaxy at the same redshift it's not the same galaxy at the same redshift the reason why it is at the same rate is that we can actually find galaxies at that specific redshift very well for atmospheric uh reasons but what we saw for this galaxy this is a triple merger this is an hst picture of the galaxy in the background so there are three uv complexes within five kiloparsecs from each other they're all confirmed at the same redshift so there's another projection effect the contours actually show carbon 2 line emission which is basically showing cool gas seen by alma it overlaps with the stars mostly and it's a very complex structure we see three uv sources one two three four sources of cool gas emission so it's a very complicated structure [Music] but what we want to do with muse is that this galaxy is a known bright liman alpha emitter the lamin alpha line is here and with the muse ifu you can actually uh very very since with a very good sensitivity search for extended emission and that extended emission could show uh neutral gas around the galaxy in which the lyman alpha photons scattered and with muse we detected that gas and shown in the color image here in the center the black contours are uv star-forming regions matched at the same resolution and in the color scale you can actually see the extended line management so it's alignment alpha halo around the galaxy and what this shows is that there are basically some neutral hydrogen gas that in which some of the lyman alpha photons that are produced in the center central component are scattered so the gas is illuminated basically by these photons that are originating from the from the center it's interesting to look at the shape of this uh halo and we can do that just by looking at it or by my modeling doesn't really matter um it's a bit elongated in the direction of the other components i think that's not unexpected if you see multiple components of a galaxy being separated in one direction that the gas structure follows that direction as well it's nice to see that but still we still need to address what the source of this gas is is this actually primordial gas that is in falling or is this actually enriched gas or even stripped in dire interactions and from these laminate observations we cannot address that um it would be possible to address that perhaps with with metal lines because for example you would expect this extended emission to be more luminous and metal lines in case it has been enriched or is basically expelled from the galaxy or a stripped gas instead of primordial so we hope to observe that in the future looking at other properties comparing this lyman alpha halo of this ratchet 6.6 galaxy to other galaxies um there have been claims that lyman alpha halos around very high galaxies are shallower than around lower wretched galaxies basically the lyman alpha light disperses more slowly we actually that could be a sign of more neutral gas away from galaxies so the scattering continues out to larger radii this is actually not what we see so in this galaxy we see that the cgm structure being illuminated by lyman alpha is actually very similar to galaxy satellites or ebox i think that probably indicates that this galaxy similar to the other one resides already in a more evolved part of the universe a more more ionized part of the of the universe um good um so now the last part um and i see it luckily i have some time to explain that in some detail i hope um so i've been talking about emission lines all the time live in alpha h alpha carbon 2 and the reason for that is that those are easier to observe because all the light is centered in basically a few angstroms or in a few pixels on a spectrograph if you want to learn something about stars in a galaxy you need to measure the stellar continuum it's much harder and i've been working with the muse team on a new data set that's called the muse extreme deep field it's very expensive it's a 140 hour observation of the hubble extreme deep field with muse we uses an ifu so it slices this picture in 3600 wavelength layers with a width of one angstrom so it's a 3d picture uh i actually do have a movie because i will actually start it now and every change you see is basically a different wavelength um so if you were just just looking at it i'm the arrow is pointing towards the galaxy that i'm studying and there you see it appearing suddenly um if you just look at this you can see emission lines popping up on all different kinds of location locations uh slowly so it's an extremely rich data set that you can use to study to study all these galaxies in the in the field it looks like a circle because all those 140 hours were slightly rotated after each other and that's actually very nice to reduce systematics in your data set observational feature this is that is currently being used to look at extended lime and alpha gas filaments connecting galaxies there's a study looking at rotation curves lower ratchet galaxies quite out to far right but high radii and but i'm looking at this galaxy shown with the arrow um this is the spectrum of that that galaxy this is the brightest galaxy in this field at high redshift it's at redshift 4.8 so the universe is about 1.5 giga years old um and the signature noise is really you don't you don't get that for typical observations the lineman alpha signal is 650 but we're not interested in that here but we actually have a signature noise of about 30 in the in the continuum which means that most of these wiggles that you see in this spectrum um are actually real um and they are not from from from noise of your of your measurement and um many of these wiggles uh are due to absorption from interstellar gas uh there are some emission faint emission lines but there are also a few features which are from stellar atmospheres and by fitting those features with with models you can infer the stellar metallicity and the age of the stars in this galaxy and this is the first time that this is possible for an individual galaxy that's such a high red shift and i think this is nice to to do because in the end one of the reasons to to find all these very distant galaxies is that we want to learn i want to learn what the properties of the stars in these galaxies are and you can only do that in the end by by actually matching the spectrum spectra of these stars instead of if you look at emission lines you're always sensitive to photo edition for translation modeling um back to emission lines we do detect carbon four line emission which is quite rare to detect in distant galaxies this suggests a very hard ionizing spectrum a low metallicity um but i want to talk about stellar metallicity and just to show what how this works and what is the constraining power um that is shown in this figure and this shows the relative spectrum of the lowest stellar metallicity model compared to higher stellar metalistic models in the colors changing from blue to red you can see that there are lots of wiggles in this spectrum and you can constrain those wiggles to constrain the metallicity the signal noise of this data is this gray band so all measure all variations within the gray band you basically cannot constrain um so from this this data we can constrain a metallicity at least lower than 0.2 solar from from the overall band but there are a few features that are more constraining that i'll focus on and those are the two stellar wind features from nitrogen five and carbon four nitrogen five is shown on the left so what these are are b sickening feature from from winds escaping from very massive stars particularly nitrogen five you need extremely massive stars to to be able to ionize that um to get that to see that transition and this is a very gives a very good constraint on on the metallicity so we could infer a metallicity from these lines but the issue is that we infer a different metallicity if we look at different lines which is a bit unsatisfying dissatisfying the yellow model which is the best model for the the nitrogen five line is a metallicity about ten percent solar it actually predicts a feature that is much too strong for what is observed in the other line which actually prefers much lower metallicity so one way to solve this is by instead of tuning your metallicity is tuning your star formation history because we assumed here that either we have a single stellar population basically a single birth star formation history or continuous star information history in both those models can actually not satisfactorily explain the spectrum of this and this galaxy however if we do quite complex two-component star information history so if we assume that the star formation history of this galaxy consists of two bursts um we have some priors on the on the edges of those bursts that i can answer if you are interested and those models can actually fit the spectrum much better and you can say well of course you add more free parameters you get a better fit that's true but on the other hand there's also additional data that we did not use in the fitting and the two burst model fits all that data better the most obvious thing is just the image from hst it's a columbia it's a clumpy source and the muse data actually does not resolve that source it actually has the as the sum of all this light then there's also the infrared photometry from other from hubble and spitzer data that's better matched with this two-component version and the h-alpha luminosity is matte as is better it's better matched [Music] so let's just skip one so um so yes um this is a galaxy where we where we have a constraint good constraint on the stellar metallicity and i think that's nice and we can actually compare that um as my final final slide to learn something about what we should do in the in the future uh particularly if you want to find such galaxies um because in the future of course observational time is is not is limited and you cannot get such spectra for all galaxies and if you want to observe very low metallicity stars you want to select the best targets um and i think this also nicely circles my entire talk because what we find is that the stellar metallicity if we combine our measurement which is the red the solid red red point has a big error bar because of the uncertainties on the star formation history but if you want to find lomets list the low stellar metalistic systems um looking at galaxies with a high observed lime enough equivalent width is a very efficient way to do this because we see a very nice correlation um and that's uh so that means that the line alphabet with is a good pre-selector of very young and near-primordial systems just to add final note you see the error bars are very big here um so that's not very satisfying i just want to show from modeling how much we can reduce the error bars in quite an easy way as i said the major uncertainty on this error bar this is the the pdf so the arrow bar basically the width of the of this uh of this pdf that you can see on the left um the error bar is basically because we don't know the star formation history of this galaxy if we let's say simulate similar galaxy with a known star formation history and we and then fit it again and we get similar error bars of course but if then we can ask what if we actually know the age alpha luminosity from future james rep observations as i said that jim's the hr luminosity is very sensitive to recent star formation and indeed if you know the intrinsic gauge alpha luminosity you can basically shrink your error bars on the metallicity by a lot so that shows that you can basically fix this um the degeneracy between variations and star formation history and metallicity if we have age alpha measurements so i think that's a very bright future because these measurements are expected two years from now and i'm just going to leave you with my takeaway points which are basically the titles of my modules and some open questions that we learned from all these different science projects i'm happy to discuss more or answer any questions thanks for listening okay thank you you're right okay any any questions uh so if you do have questions just uh you know just raise your hand and then let me go and answer that uh in the meanwhile i'm maybe you know i just take the prerogative and ask the first question um so um you mentioned at some point uh like different ways of how you know these diamond and alpha emitters or certain galaxies are alignment alpha matrix or not lemon alpha matrix and to some extent this reminded me a little bit of this of this you know question about a unified agn model so is there like um like some arguments to be made for whether uh being alignment alphabet or not is just a geometrical uh line of as a viewing angle essentially effect uh maybe based on the clustering uh or is there like some clear evidence that that that's not the case that there's something else uh that must be different between between lemon alpha majors and and the other galaxies yeah i think that's a good question i actually submitted the proposal to andre to try to answer that but um so i think there is some evidence that the viewing angle is important um because we actually see that all the lyman alphabets are very compact galaxies we may be looking at them face on so that may be the case and if we particularly if you compare to a child emitters or galaxies that are not strong lime enough emitters they seem to be more elongated so i think there is some there is something pointing towards that direction um but what you want to do is actually you want to observe galaxies selected irrespective irrespective irrespectively of their alignment half emission and then observe their lime and healthy mission that's very hard to do with high redshift because it's hard to you want to basically control for the intrinsic lyman alpha mission so you want to ideally control for the intrinsic half emission and that's not very easy uh to do it at rich tree um but we could we could do that quite easily in the in the future if we have o3 samples from james webb um having said that so i in ongoing work i did a stack on i looked at the lyman alpha line profiles which tell you something about how did the photons escape through the gas and and if you separate so you would expect that the galaxies that have a fortunate viewing angle have a narrower alignment alpha profile compared to the galaxies with a an unfortunate viewing angle so i split i made a stack of galaxies splitting by the profile the lyman alpha profile which basically means splitting by how the photons travel through the ism and in that stack you can actually still see differences in the uh the stellar prop in like the inferred stellar properties so you still see differences in you see that the stack that has like favorable amino lines of sight has younger stars so that indicates that viewing angle is not the only thing i think it's a combination of a certain galaxy property like a young age or a few million years after our starburst that will enable more viewing angles to be favorable so you have a combination of a systematic effect and a stochastic effect i think that will be the answer but then what's the relative importance of the two is is the challenge okay thanks i think that was very nice answer uh any questions you mentioned at the very beginning also that um when you look at the star formation rate density uh that it's done with a combination of h alpha for you know below redshift two and a half and then uh if you go to high redshift i guess because it drops out of hst you go to lyman alpha so and then i think we also saw that you know the more massive objects are absorbed in lemon alpha so you don't really see them and so don't we then have a you know potentially a strong bias are we not missing potentially a significant amount of star formation at at high region uh if we if we look at lyman alpha yes so i think i was a bit i didn't explain it properly i think so this um so this the famous star formation density right um you know what i'm actually going to draw um because the lime and alpha star formation density is not shown here and this is the so the this is the start from e3 density mostly from uv continuum and if you would try to estimate the lemon alpha star formation and the zoom thing is exactly in the way if you want to estimate the lime and alpha star formative density uh on this diagram i think it actually would it would look like something like this based on the laminar luminosity if you convert a luminosity function to a star formation rate density and that this was actually used to uh to this difference was used to argue that the global limit alpha escape fraction increases to high redshift or the opposite the global line of escape fraction decreases to lower redshift and that's exactly because you get you builds up massive galaxies does have dust and those are not lime and alphabets anymore so you do not want to use this line for complete senses of star formation right um you do i think it's still nice to at least have it with emission lines because if you do it with uv continuum there's other other issues to worry about yeah okay thanks okay any other any other questions for speaker it seems everyone is uh afraid to ask or maybe it was too much information um yeah i i should have i actually got slightly confused with the time and i thought i have so much time and then i thought i know i don't have too much time sorry well i i well you ended uh actually perfectly on time so okay so i have one more question that i can ask um and this um so you also showed this kind of relationship uh you know really briefly between escape fraction and outflow velocity and at first sight this seems a little bit uh strange right because uh you showed i think uh if you can make pull up the slide that uh if you have higher outflow velocities so this is not the height this is not the outflow oh sorry okay what is it what i'm seeing near the exit this is the the separation of these two lamin alpha lines and okay this is okay well okay so then it makes more sense okay that makes sense because if it's broader then obviously you have more stuff intervening and so you will have a lower escape fraction right okay so i think then this question is uh answered itself okay that makes sense yes okay okay good yeah because i was wondering so why is it that uh i mean it could still be that uh uh objects which have higher outflow rates have a lower escape fraction i mean it would be kind of counter-intuitive uh with the picture that they clear out the path but um but who knows right so okay good i think i understand it all right um that's the last chance to ask uh any questions uh for urith uh otherwise i mean you're is here he's a local uh you can send him an email um and uh you know he's a very friendly guy so uh just send me an email if you have any questions about this and his work and uh yeah i thank you uh uh to eurid uh for being here uh today and well good luck with your with your new proposals thanks thanks
Up Next

Decoding the Lyman Alpha Forest: Quasar Light & Cosmic Structure
@AlasLewisAndBarnes
2.9K views•2021-04-07
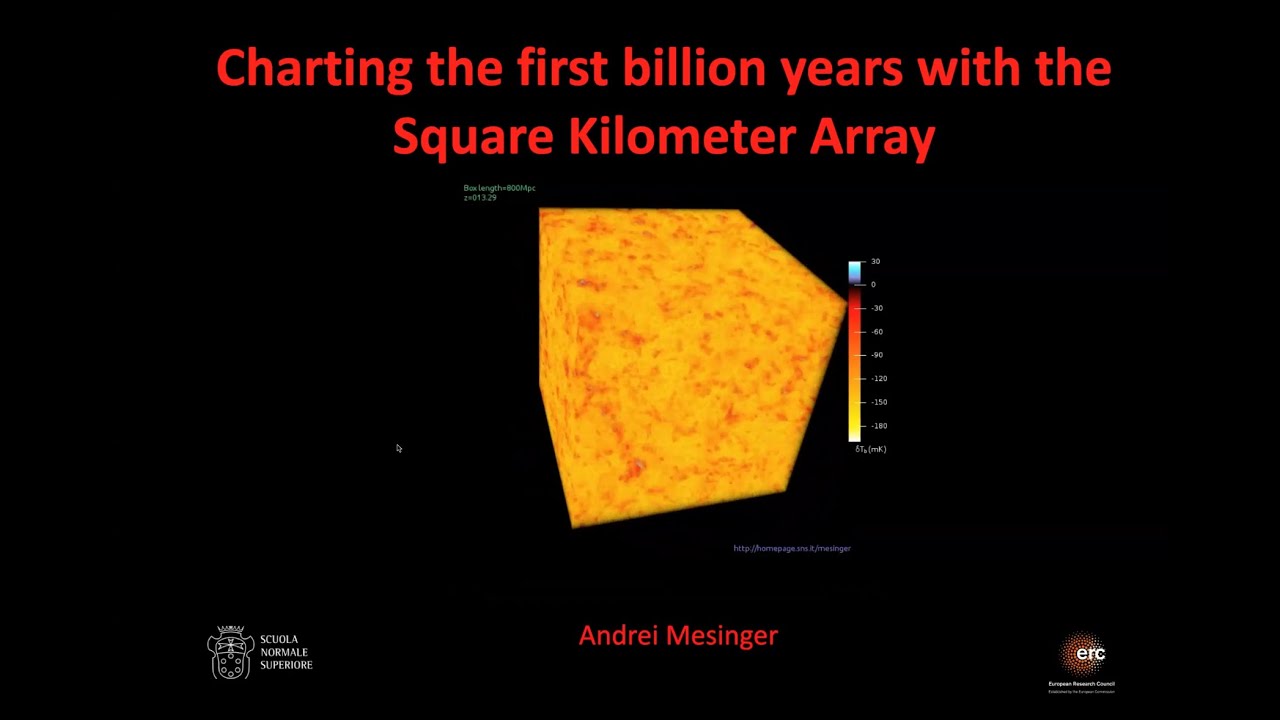
First Billion Years of the Universe with the Square Kilometre Array
@iaaudc
121 views•2022-05-26

Kepler's Laws of Planetary Motion Explained (Educational Astronomy Video)
@Peekaboo_Kidz
404.9K views•2023-02-17

Gamma-Ray Bursts: Cosmic Snipers Explained | Astronomy
@kurzgesagt
15M views•2016-07-31
Related Study Plans & Knowledge Roadmaps
Structured learning paths in Astronomy