



















The spin echo is a fundamental MRI technique where a 90-degree radiofrequency (RF) pulse is followed by a 180-degree RF pulse that reverses the spin orientations, causing dephased spins to realign and recover their transverse magnetization (signal), thereby overcoming the signal loss caused by magnetic field inhomogeneities (T2* effects) and enabling more accurate tissue characterization.
MRI Physics: Understanding the Spin Echo Sequence
Added:Basic principles of Nuclear Magnetic Resonance (NMR), including nuclear spin, net magnetization, and the Larmor equation.
The effect of a 90-degree Radiofrequency (RF) pulse, specifically how it tips magnetization into the transverse plane.
The concept of transverse relaxation (T2 decay) and the natural dephasing of protons in the transverse plane.
The difference between intrinsic spin-spin interactions and external magnetic field inhomogeneities that contribute to T2* dephasing.
How parameters like Echo Time (TE) and Repetition Time (TR) are manipulated in Spin Echo sequences to produce T1-weighted, T2-weighted, and Proton Density (PD) contrast.
The mechanics of Gradient Echo (GRE) sequences, contrasting them with Spin Echo in terms of speed, RF pulses, and susceptibility to T2* effects.
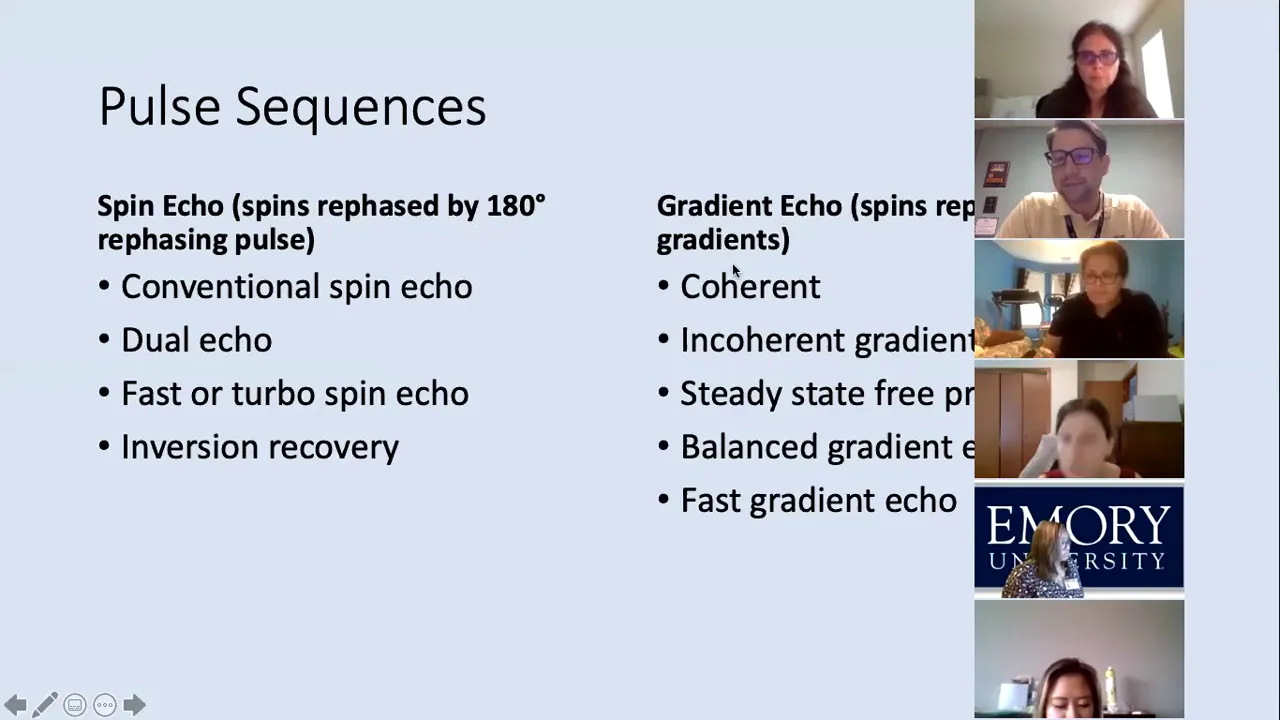
Advanced Spin Echo variants, such as Fast Spin Echo (FSE/TSE) and Inversion Recovery sequences (e.g., FLAIR and STIR).
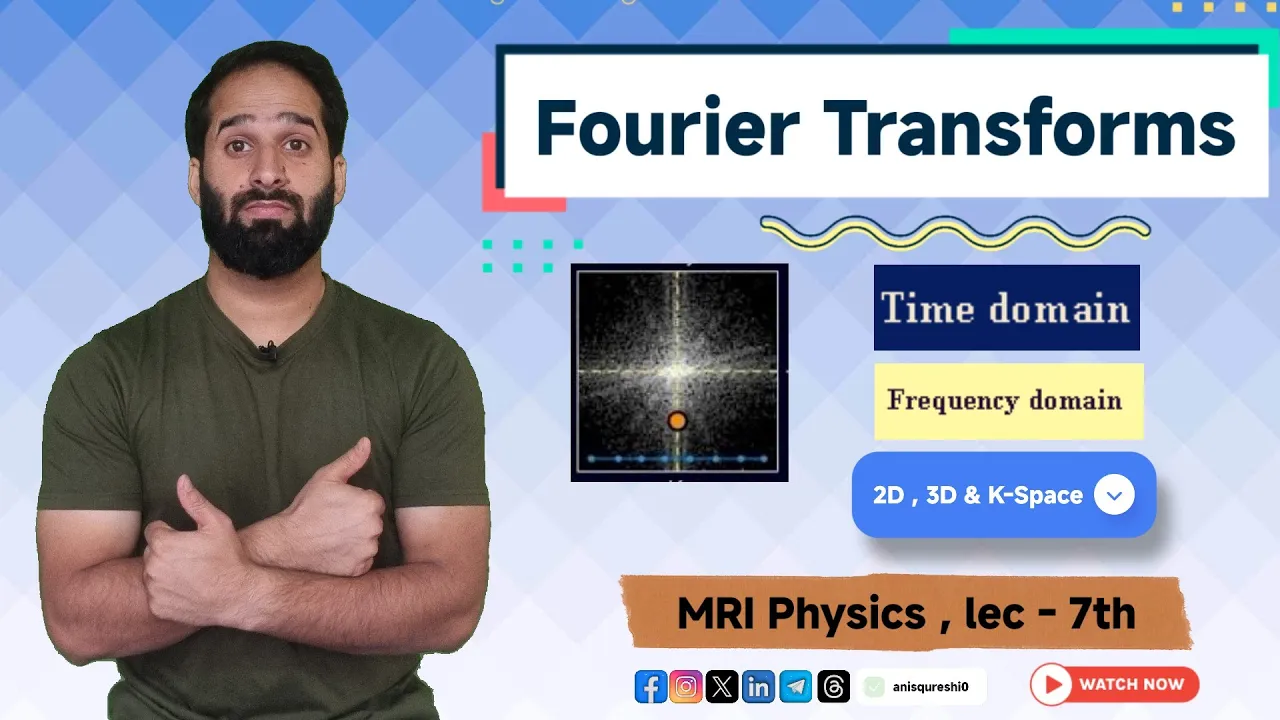
The relationship between the acquired spin echo signal, K-space trajectory, and the Fourier Transform used for image reconstruction.
86.9K views401likes28:26Original Release: 2014-09-23
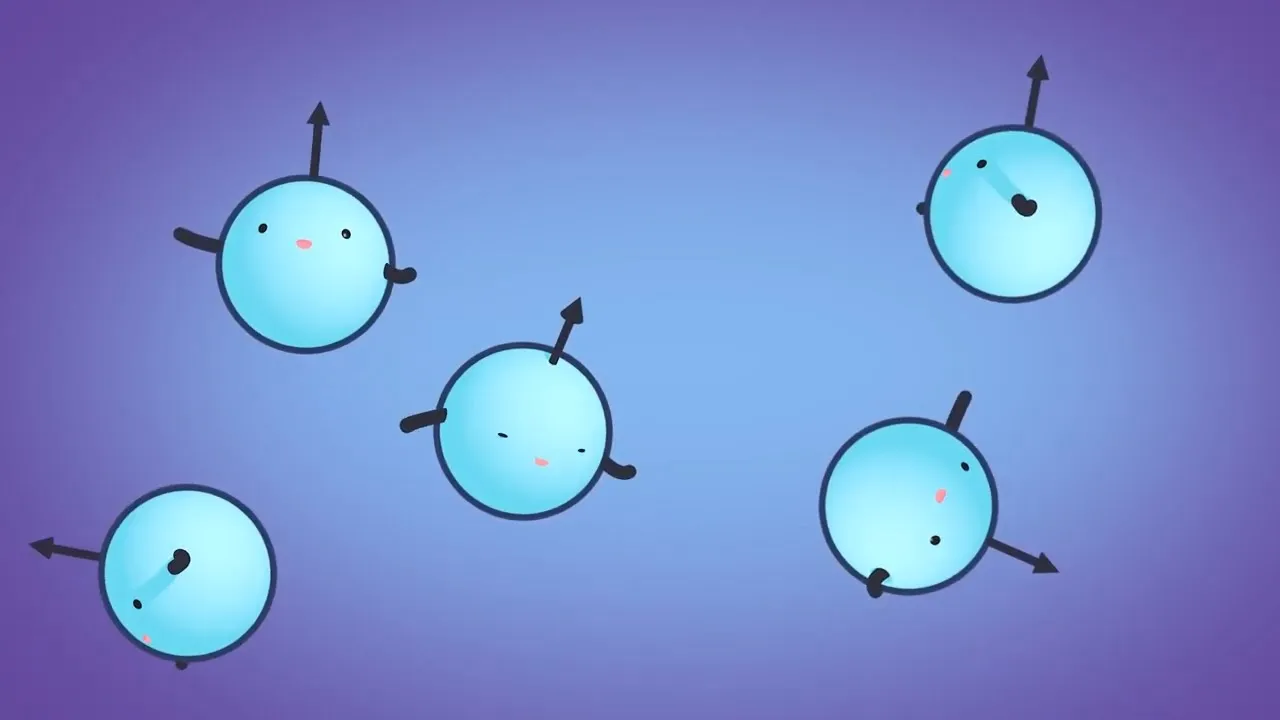
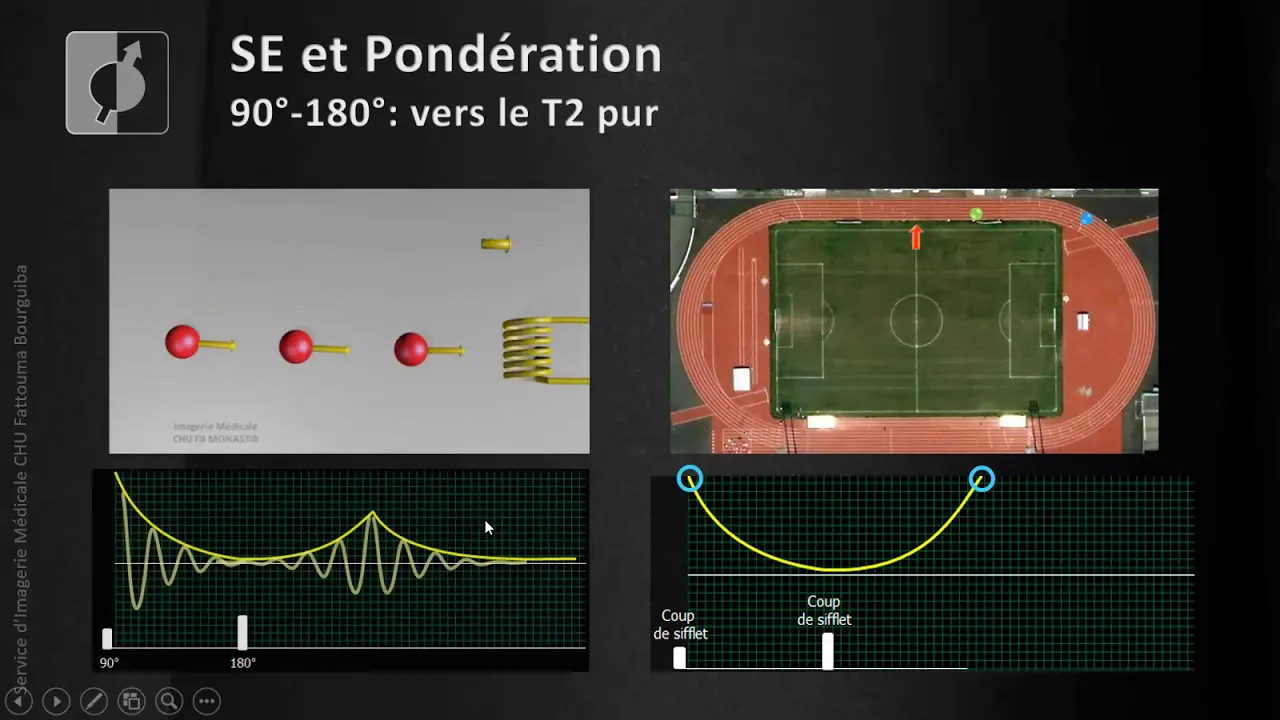
i want you to consider the following from our starting point we were able to apply our rf for a certain period of time at a certain strength to achieve a 90 degree rotation of those spins then there was a period of time where they dephased somewhat what i want to do now is turn that rf on again but this time i want to leave it on for twice as long and what's going to happen if we leave it on for twice as long is we will start to rotate these spins again not only 90 degrees but since it's twice as long we will rotate them a complete 180 degrees now keep in mind that at the outset the blue was precessing faster than the red causing this amount of de-phasing if we rotate this 180 degrees they're still processing in the same direction because as i discussed with someone earlier the direction of precession is a function of the static magnetic field which hasn't changed so now we're in the scenario where the one that is precessing faster is actually behind so to speak the one that is processing slower and if we now watch what happens over time they will eventually catch up with each other to the point where they're now back completely in phase and what's happened is all of the transverse magnetization that is signal right the coherence that was lost before has been recovered by applying that 180 degree rf pulse so as long as we just one second so as long as we apply right our b1 wait a period of time apply b1 again this being a 90 and this being a 180 and then if we wait that same period of time at this point in time we will have right zero signal loss due to that t2 prime effect you were going to ask so the frequency that you applied would be like if they're innately rotating okay so let let me let me address that because so murthy asked that question i think during the break is that well okay hold on a second so these are precessing at different frequencies based on the nature of the tissue so when i turn on my b1 or my rf the frequency that i'm choosing is based on b naught so maybe it's not going to match this maybe we're not even going to have resonance with these spins we won't generate any signal in the first place so that is where we get back to the point that these changes in frequency are tiny right whenever we whenever we turn on our b1 right it's never applied and we'll talk about this actually next it's never applied with a single frequency so we don't choose one we don't know that the lawnmower frequency is exactly this one number and we transmit a single that's physically not possible secondly for precisely the reason you're saying that there is some variability in the magnetic field strength we always transmit a range of frequencies so we're always well encompassing this and these are these are tiny gradations of difference so this effect where we recover this loss of phase coherence following this sequence of a 90 and then a 180 degree pulse is called a spin echo it's called an echo simply because we have loss of signal and then recovery of signal so it's like when you you know when you're a kid and you go in the tunnel and you scream and your voice trails off and then it comes back up again so this seemed like an echo because we have a decline and then an increase in in the magnitude of this signal and it's called a spin echo because it is a function of the behavior right of these of these spins and the way that they precess at different frequencies depending on the nature of what's going on in the tissue so is this clear if not we should clarify this is re the spin echo is fundamental to a lot of what we're gonna do for the rest of the week so if it's not clear it will be a really good time to clarify it yes this one yeah it is rf it's the same thing but it's applied for twice as long so think of it this way these groups of spins start out like this we knock them down to 90 degrees so now their magnetization is in the transverse plane when we started out at rest and we turned on the rf we rotated them 90 degrees from where they were well this is where they are when we turn it on again we wrote they we could rotate them another 90 degrees but we keep it on actually twice as long to rotate them a full 180 degrees now it is true if this is what you're thinking that when you do this everything gets rotated 180 degrees if there is for example between this between these two rf pulses you flip this down 90 degrees and there is some relaxation both transverse and longitudinal so there is during this period of time some small amount of longitudinal magnetization that recovers however much that is it also gets rotated 180 degrees just this time frame is so short relative to the time scale of longitudinal relaxation that it's an inconsequential amount that actually recovers and the only substantial effect that we see is the effect of the on the magnetization that's in the plane right in the transverse plane that that gets pushed all the way around okay okay okay all right anything else any other questions yes does this mean you want your time to echo then to be twice the amount of time between the 90 and 180 degree pulse so that the phases come back together exactly so well it depends on what you want if you want this to work most effectively then this 180 must be symmetrically placed between the 90 and when you sample the signal okay absolutely because the what you're doing here is there is a certain amount of dephasing that occurs over time and then you reorder the spins by giving that 180 degree rf pulse they can only recover right what they've already lost and they can only recover it at the same rate so you have to wait the same amount of time for them to come back into phase and if you start out too early then they're not going to be quite back into phase okay if we if we just look at this graphically so so let's say that this is the actual let's do this differently so let's say that this is what we observe following a single 90 degree rf we put these in the transverse plane and we don't do anything else and this is the rate at which transverse magnetization is going away okay this is due to what this phenomenon right this is t2 star which means it's a combination of spin spin exchange of energy and a combination of that t2 prime effect that variability in the static magnetic field okay well what happens in the case of a spin echo well this point in time of course is right after the 90 degree rf pulse so let's say at this point in time we apply our 180 degree rf pulse so what changes well it turns out that what happens is that at this point in time there begins a progressive increase in signal because what is signal signal is the transverse magnetization and at this point in time after we reorder those spins they are progressively coming back into phase there is an increase in the amount of phase coherence and an increase in the amount of net transverse magnetization so if we plot this over time there is going to be an increase and if we follow what happens over time well eventually remember there was dephasing the 180 reorders those spins and there's rephasing at some point they get right back into phase what if we keep watching they go back out of phase again so what happens here then is that at some point in time all of a sudden the signal starts to drop again now it turns out that if we connect the dots here this is t2 okay so if you want to measure the t2 star of the tissue you can simply hit it with a single 90 degree rf pulse and then as it is relaxing you can sample multiple times just measure the signal multiple times then you can plot this and you know fit the exponential and you could measure the t2 star of the tissue if you want to measure the t2 of the tissue it's a little more complicated you have to provide this 180 degree rf pulse and you have to look for these this point at which it comes back up and then starts to decline again or you have to measure so that you are symmetrically at least this was supposed to be symmetrical right sampling the same amount of time after the 180 degree rf pulse is the time between the 90 and the 180.
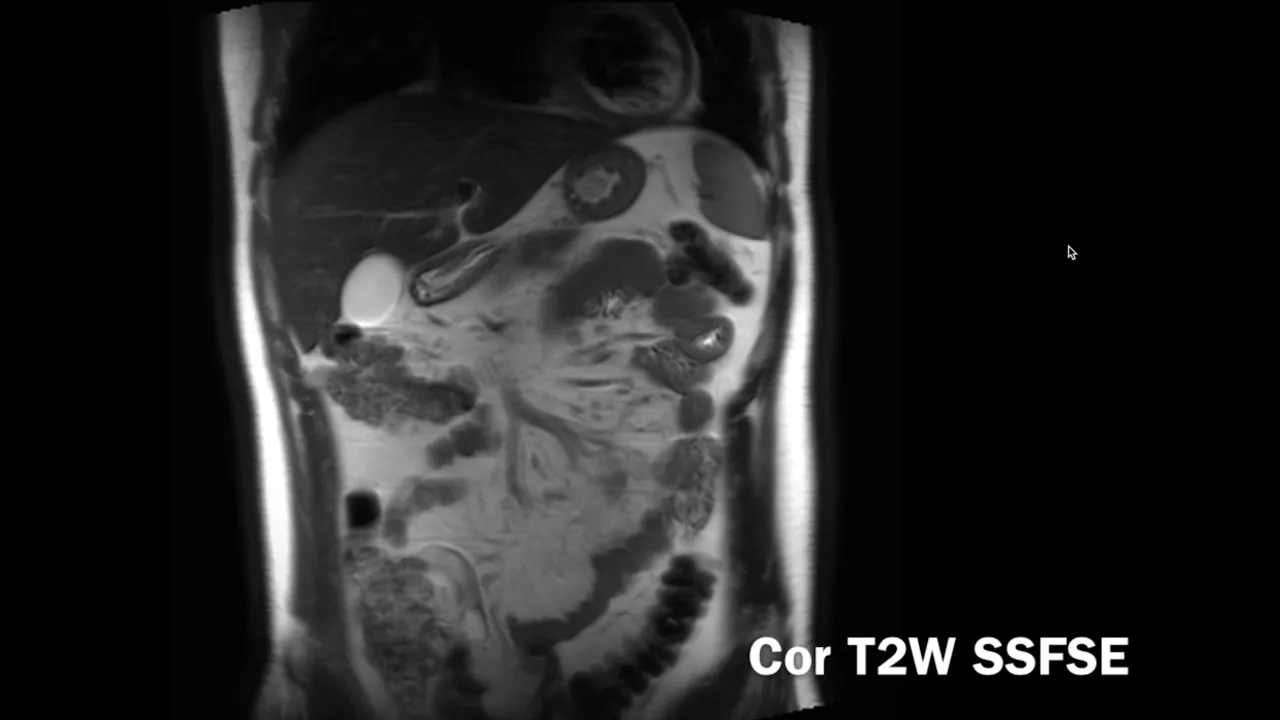
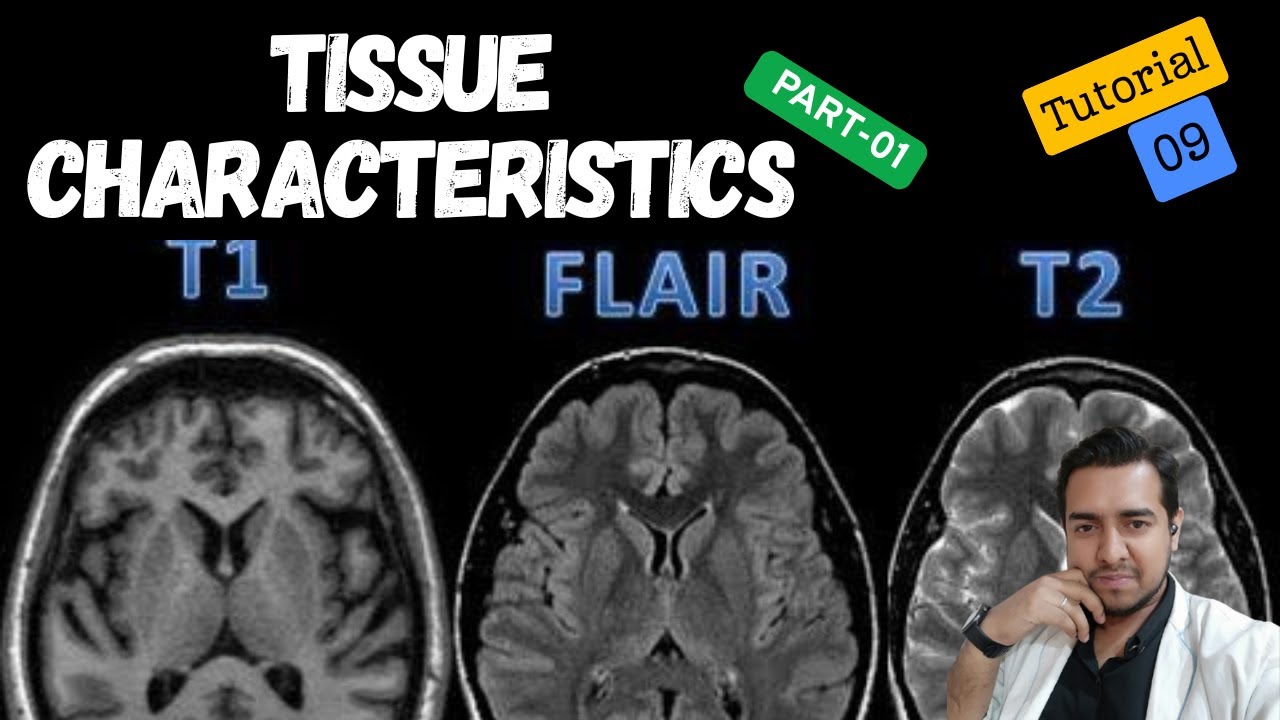
and if you do that and you do that with right several different tes the 180 always has to be midway between the 90 and te then you could sample the t2 curve the thing that's making the difference between these two t2 prime right is something that you can never directly measure is t2 kind of different for different tissues or is it just so yes so t2 prime is a function of the magnetic susceptibility of the tissue which again is something that we'll talk about more specifically later on uh it may be a function of the tissue or it might be a function of something else that's in there so as i was saying the most extreme examples would be if you have air tissue interfaces or if you have metallic fragments let's say in the tissue you can have dramatic t2 prime effects but otherwise there are right there are generally um you know certain characteristic t2 prime effects of specific types of tissue yes okay and if you want to measure this and this actually might be a parameter of interest to measure in some cases what you need to do is measure both t2 star and t2 prime and compute the difference yes when you want to do one calculation sure so i think that in terms of a clinically relevant example so people do this in research all the time but in clinton as a clinically relevant example would be for example patients that have iron overload or iron deposition so one thing that causes dramatic t2 prime effects i mentioned metal but even if it's not you know a gross metallic fragment iron deposition in tissue causes dramatic t2 prime effects so if you want to look at someone let's say with hemochromatosis or that's you know had multiple transfusions and look at some kind of measure of end organ damage so looking at myocardium or looking at bone marrow or liver this is actually a way to quantify the effect so because you look at the pictures it looks black i mean what are you going to say about it but you can actually quantify this effect and maybe say something there are people who are looking at ways to correlate this with myocardial dysfunction for example so that would be the thing i would think of right off as a as a clinical measure the other area where it's important is in the brain in functional brain imaging so this t2 prime effect which we typically sample qualitatively as t2 star is really the source of the signal when we do things like uh you know functional mri to localize function in pre-operative patients okay did i answer your anything else absolutely so that's actually what i was alluding to here you could give a single rf pulse and you could measure the signal as many times as you want and in fact you would do it many times in order to accurately reproduce this curve and measure t2 star or the other time you might do it is let's say and this is getting a little bit ahead of us but let's say for example you were interested in images with two different types of contrast right the time at which you sample the signal is one of the determinants of contrast that determines our t2 or now t2 star contrast so you might be interested in images which have both a short te as well as images which have a longer te so what you can do is give a single rf pulse and then sample twice your tr might not be occurring until almost certainly wouldn't be occurring until much later okay and in fact i wasn't going to get into this today but in this example right these two sets of images were all acquired in a single acquisition that's what we would call so this would be called you know multi-echo imaging where we excite once and we sample twice at two different echo times so essentially you get two sets of images for the price of one because if we think about it we're not really at this point yet but based on everything that i've told you so far this would probably be a good place to look we talked about how you modulate the contrast of your image and let's suffice it to say that we're always going to have to repeat this business at tr multiple times to generate enough information to actually make a useful image so can you infer from what we've talked about so far what parameters would have something to do with the amount of time that it's going to take us to do this it's important to start to think about the role of time because that tends to be really the limiting factor in mr i mean there's so many things you can possibly do right there's so many different types of imaging you can do and you know we all know some radiologist that keeps patients in there until they're like screaming to be let out after an hour or more but what ultimately determines how much you can do within a reasonable examination time is how long it takes you to do the imaging so what's the what's kind of the bottom line what's determining your time here anybody any ideas okay well the tr is key right because we have to repeat this multiple times and we repeat at a time interval of tr so for whatever the number of repetitions are that will be required and that's something we really won't talk about until tomorrow it's going to be happening every tr so the length of tr is going to be a direct determinant of our imaging time your t1 weighted images as we've set this up so far where we make tr very short to maximize contrast due to t1 take a lot less time those t2-weighted images where you make the tr very long in order to suppress those t1 differences those can take a prohibitively long period of time unless we do something else to compensate for that so the number of repetitions and the time interval of that repetition are the major determinants of time and there are some others which we'll get to but if you want to sample multiple times within a single tr that's free so in this example we're able to get essentially two sets of images of the brain without any additional time because we're waiting for that tr regardless of which type of image it is we just sample the signal twice after we generate some signal right and that signal is transverse magnetization sound familiar okay that over time that there is an exponential decay of that signal and that the time constant that governs this is called t2 so t2 is a number expressed in some unit of time usually in milliseconds which tells us how rapidly our transverse magnetization is going to go away after we generate the signal now we made this case a little bit more realistic and as a result a little bit more complicated by saying that if we actually observe this we don't observe t2 we observe a more rapid rate of decay governed by a different time constant which goes by the name t2 star and that the reason for this difference is that inevitably once we put the patient or the sample or whatever it is into the scanner there's some variability in the magnetic field strength and since we all know that the frequency of precession is determined by principally by the field strength right this gamma is the gyromagnetic ratio which is a constant that depends on the nucleus we're looking at so field strength is really what determines the processional frequency so if there are two locations in the image and they have slightly different magnetic field strengths so if we look at what's happening to the populations of spins in these two different locations that after we generate our signal if let's say number one in that location things are experiencing a slightly higher field strength they're processing a little bit faster and there will be a progressive separation or loss of phase and therefore loss of net transverse magnetization or loss of signal amplitude and that phenomenon is totally separate from the spin spin exchange of energy that accounts for the natural t2 rate of signal exchange okay this is what we talked about yesterday we could generate a spin echo to recover this difference now i wanted to just take a chance to show you two different images so on your left this is what we call a spin echo image and on your right is what we call a gradient echo image don't worry about those names we're going to get to that tomorrow but the point is that in this image over here our signal is measured on the t2 curve in the image on your right our signal is measured on the t2 star curve so the difference is that we use a spin echo to generate this image on the left and to recover that extra signal that's lost due to that variability in the static magnetic field and in the image on the right we don't do that we just excite the spins measure the signal and we get what we get so if you compare these two images what do you notice what's kind of a salient difference between the two images the contrast is different okay that's true since t2 and t2 star are different the t2 or t2 star going from tissue to tissue will not necessarily vary in the same way and the contrast is going to be different but i think if you look at these two images you look at the image on the left and the image on the right do you notice that the image on the right the t2 star image is kind of much grainier it's not as crisp and smooth an image these two images are acquired with exactly the same spatial resolutions the number of pixels in the two images are exactly the same there's no difference in the actual spatial resolution of the image but when you look at our sampling on the green line on the t2 star curve there is at whatever time we choose to make our te when we sample the signal there is always going to be less signal around as a result the signal to noise which visually is reflected in the sort of overall variability or graininess of the image is always going to be worse when you're sampling on t2 star right that's just something to keep in mind whenever you're not using a spin echo we'll talk about this more again tomorrow and you're sampling on the t2 star curve you're always going to have less signal yes uh two things the t2 you that's a spin echo so you have to sample it when it recovers that signal at the peak right correct so in other words if we put the details in here so in order to sample at t2 what we need to do is at some point not at some point but midway between when we start which is zero on the time scale is when we give our 90 degree rf pulse midway between then and the point at which we want to sample the signal we need to give a 180 degree rf pulse and what happens is that until that time the signal decays along the t2 star curve at this point in time we begin a recovery of signal which crosses the t2 curve when we get to te at which point by the way it immediately starts to decline again with t2 star okay my second question is when we when we look at a t2 what we are thinking of as a t2 image is it actually a spin echo almost always yes now the problem is i don't know what you mean when you say a t2 image because again the term t2 image is really not a is really not an accurate term in the first place because to me right as a purist when you say a t2 image a t2 image is an image where for each pixel in the image we have plotted this curve and quantified t2 and generated an image where the actual numerical value placed in each pixel is the quantitative measurement of t2 okay what you're probably talking about is a t2 weighted image and i would think if you're talking about a t2 weighted image you would talking you would be talking about this type of image that employs a spin echo that being said i often hear people erroneously look at this type of an image which is called a gradient echo image and refer to it as a t2 weighted gradient echo image we're going to talk about gradient echo imaging tomorrow it's not possible to have a t2-weighted gradient deco image because the signal here is measured on the t2 star curve but to make a long answer short the t2 weighted images you're typically looking at employ a spin echo
Up Next

10:54
Piezoelectric Effect and Reverse Piezoelectric Effect in Ultrasound
@radiologytutorials
52.1K views•2023-04-03

12:53
21cm Hyperfine Transition in Neutral Hydrogen: Radio Astronomy Basics
@AaronRobertParsons
12.4K views•2011-10-13

32:32
NMR Spin Physics I: Zeeman Effect, Resonance Condition & Larmor Frequency
@nptel-indianinstituteofsci8064
2.3K views•2024-01-17

27:14
Entropy and the Second Law of Thermodynamics Explained
@veritasium
27.5M views•2023-07-01
Related Study Plans & Knowledge Roadmaps
Structured learning paths in Physics
physics
Nuclear Physics (Decay, Fission & Reactors)
01Atomic Structure and the Binding Force
02Radioactive Decay and Half-Life
03Nuclear Fission Mechanics and Chain Reactions
+ 2 more learning modules
12h5 modules
Explore Roadmap
physics
Soft Matter (Polymers, Colloids & Rheology)
01Foundations of Soft Matter & Thermal Forces
02Polymer Physics and Macromolecules
03Colloids, Surfactants, and Self-Assembly
+ 2 more learning modules
38h5 modules
Explore Roadmap
physics
Analytical Mechanics: Lagrangian & Hamiltonian
01Mathematical Foundations: Calculus of Variations
02From Newtonian Mechanics to Constraint Dynamics
03The Principle of Least Action & Lagrangian Mechanics
+ 3 more learning modules
28h6 modules
Explore Roadmap
physics
General Relativity (Spacetime & Cosmology)
01Foundations of Relativity: Special Relativity
02The Geometry of Spacetime: Equivalence Principle & Curvature
03Einstein's Field Equations: The Mathematics of Gravity
+ 2 more learning modules
55h5 modules
Explore Roadmap