























To locate an earthquake epicenter, first determine the difference in arrival times between P and S waves from a seismogram, then use the Earth Science Reference Tables to find the corresponding distance to the epicenter; finally, calculate the origin time by subtracting the P-wave travel time from the P-wave arrival time, and use triangulation with three stations to pinpoint the exact epicenter location.
How to Find Epicenter Distance from Seismic Station | Earth Science Tutorial
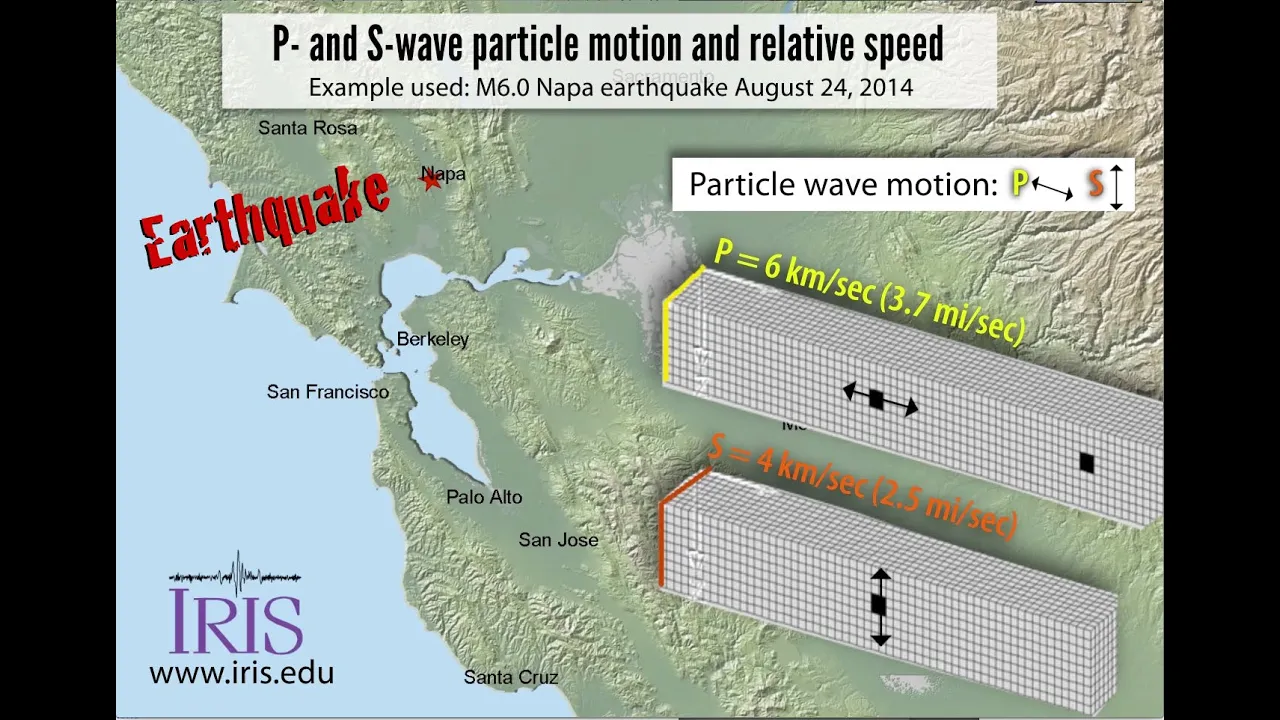
Added:Understanding the basic characteristics of seismic waves, specifically the differences in propagation speed and motion between P-waves (primary) and S-waves (secondary).
Familiarity with basic earthquake terminology, including the distinction between the epicenter (surface location) and the focus or hypocenter (subsurface origin).
Ability to read and interpret a seismogram to identify the arrival times of different seismic wave phases.
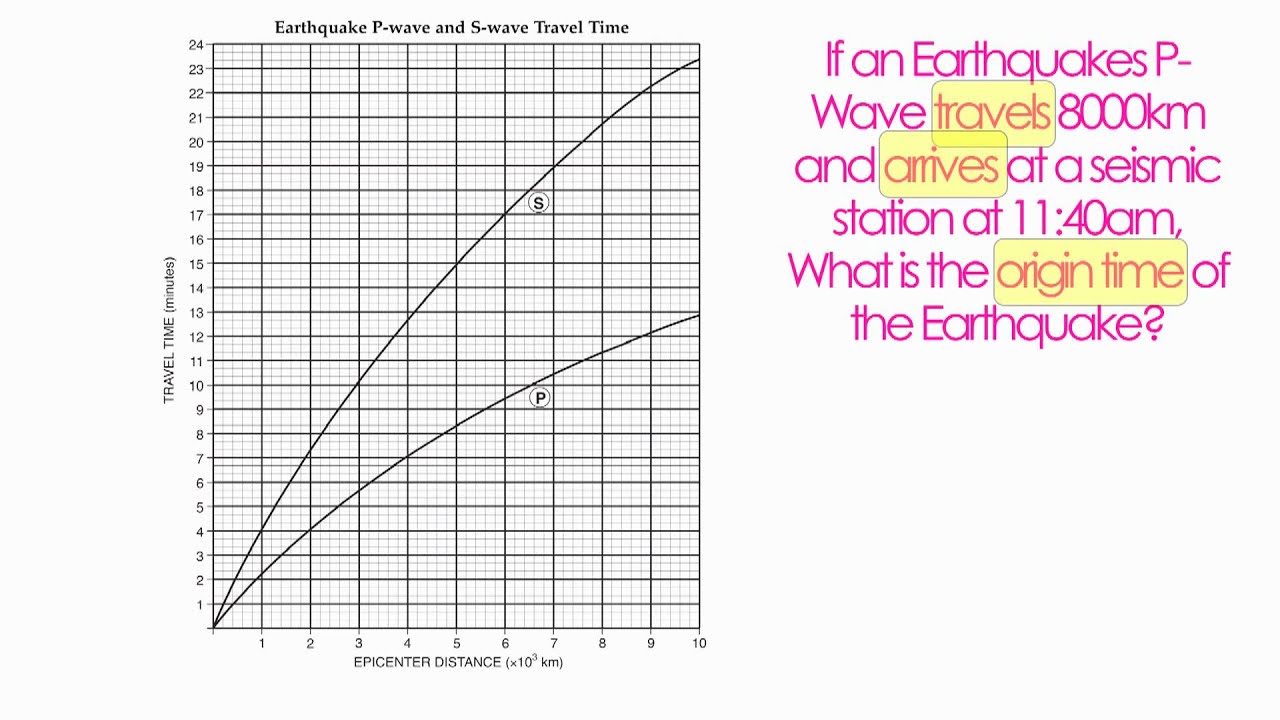
Basic graphing skills, specifically the ability to read and extract data from travel-time curves, such as those found in Earth Science Reference Tables.
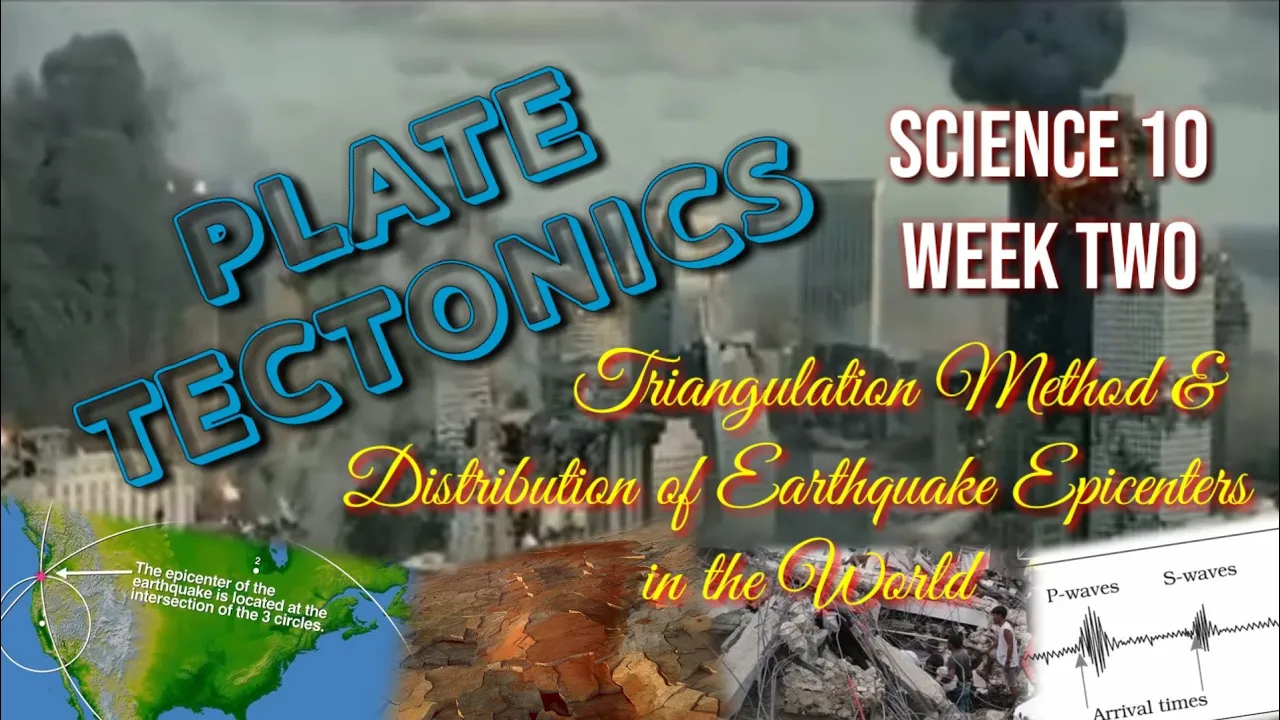
Applying the triangulation method using distance data from at least three different seismic stations to locate the exact geographic epicenter of an earthquake.
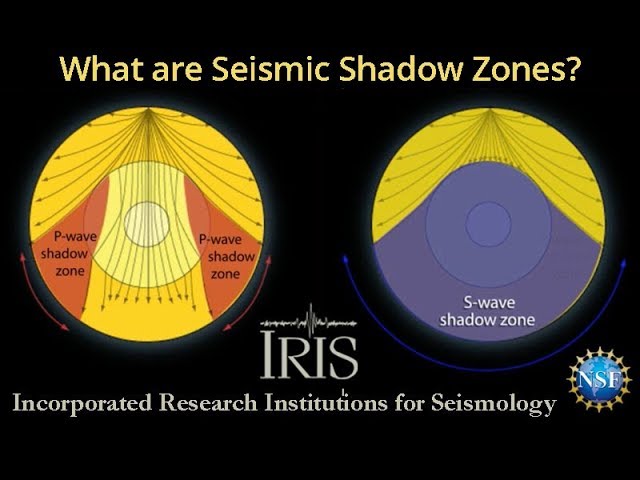
Investigating seismic shadow zones to understand how wave refraction and reflection reveal the internal layered structure of the Earth, including the liquid outer core.
Calculating earthquake magnitude (such as the Richter scale) by combining epicenter distance with the maximum amplitude of seismic waves recorded on a seismogram.
Exploring the mechanics of modern Earthquake Early Warning (EEW) systems and how they leverage the speed differential between P-waves and destructive S-waves.
176.8K views2.1Klikes15:31Original Release: 2017-12-12
all right so this is a video that's just going to showcase a simple method to locate an epicenter from one to three different stations the whole goal here is so that you understand specifically how you do this step by step so what I have here is three different seismograms from three different stations located based off of city that are going to be on a map that'll be on the backside of the page which we'll get to in a few moments what I need to do first though is I need to find the variety of arrival times now these are when the seismic waves are in this case the P and S waves first arrive at a station so what I'm going to do is with these seismograms I have listed here P and S wave arrival times with a variety of different times each of these starts at two hours 30 minutes and 0 seconds how that set up is like so where I have hours minutes and seconds one of the most concerned with though at this point to find distance is the minutes and seconds we'll get back to the hours moment when we figure out exactly when the earthquake started so what I got here is I see that I have 2 hours 30 minutes 0 seconds these large lines right here represent whole minutes each of these individual sections represents 10 seconds apiece so just for example this one right here would be 2 hours 31 minutes and 0 seconds this one here would be 2 hours 31 minutes and 40 seconds so when I go over here to the P wave I'm looking specifically where the P is I'm just going to take a straight edge here and bring it down to my time bar here if you look right here it hits perfectly this line that is represented for 31:32 two hours 33 minutes and 0 seconds I do the same thing for the ass wave and in the purposes of what we're going to work with here it is going to be best to get this to the nearest tenth of a second as if we look right here this is going to be just off one of the 10 second lines this will be more reference for 2 hours 35 minutes and 10 20 30 seconds I could do the same thing for these other sections here but we're just going to stick with Chicago I take what I found on those sections and then I just transfer it to these boxes here so the P wave arrived at Chicago at 2 hours 33 minutes and 0 seconds the S wave arrived 2 hours 35 minutes and 30 seconds the difference in arrival time is the S wave arrival time subtracting the P wave arrival time so what I need to do here is just set up and I'm just going to use my scratch paper here I'm going to do 2 hours 35 minutes and 30 seconds I'm going to subtract 2 hours 33 minutes and 0 seconds now when we're subtracting here it's going to be difficult to actually use a calculator because remember that we're talking about either base 100 versus base 60 this is what we normally use in math class this is what we are going to be using since this represents time all right now if I do my straight subtraction here I don't need to do anything I see right here that 30 will subtract it beautifully with the 0 35 minus 33 will also subtract again I mentioned before I don't need to worry about the hours because those cancel out right away so I see 30 minus 0 is gonna be 30 seconds 35 minus 33 maybe two minutes this is my difference in the arrival time so I'm gonna transfer that here to the difference in arrival time is 2 minutes and 30 seconds I could do the same thing here for the arrival times I would find from Tampa and also for wink again we're going to stick with Chicago and now we're going to focus on finding the distance to the epicenter this is where I have to go to the reference table snow science reference tables on page 11 you'll see right here now this looks like a very intimidating chart in reality it's actually set up rather straightforward if I look right here I have on my y-axis the travel time in minutes each of these small lines represents 20 seconds so this would be 20 seconds 40 seconds this would really be 60 seconds but because we like to round up 60 seconds translates nicely to one minute then one minute 20 seconds one minute 40 seconds and so on now if I wanted the odd number of values for the seconds it would be basically directly in between these lines as in 10 30 and 50 seconds the bottom here has the distance the station would be from the epicenter now I see right here it's times 10 to the third kilometers so that were where where that is coming from is that times 10 to the third km is the same thing as thousands of kilometers so what that means is if I have 1 times 10 to the third kilometers that is the same thing as 1,000 kilometers that's just so you're aware that they are so we'll put this on the Regents either way in the scientific notation or in the expanded format that we have here we're going to stick with this we're going to do both of them but I'm going to stick with the expanded format so what I'm translating it just realize that the one here presents 1000 kilometers this represents 2,000 kilometers this represents 3,000 kilometers and so on now these each of these little lines right here represents 200 kilometers or if remember in the expanded form it would be 0.2 times 10 to the third kilometers the odd values would be directly in between two so this would be 200 400 600 800 101 excuse me 1,000 kilometers this would be 100 kilometers 300 500 so on so I can get a variety of different distances here what I'm going to do and that's gonna be referencing this difference in the arrival time that I originally found the two minutes and 30 seconds the way that this chart is set up is at this space that is in between the p-wave and s-wave travel bars is that I need to find the space in between here that is going to match two minutes in 30 seconds how I do that is I need to take a scrap piece of paper if I just happen to have here doesn't matter what it could be it could be just a small little slip of paper or can be even the edge of the piece of paper that you're working with all right I'm gonna put it almost directly on top of the travel time bar on the y-axis now I'm gonna make a mark at zero so then I know exactly where zero is and then I'm gonna go up one two minutes and then I got 20 40 seconds right here 30 is going to be directly in between now that I have these small little marks I'm gonna then I'm just gonna make these a little bit more predominant that way we can see exactly where they're gonna go what I do now is I take this to the p-wave line and I have one knotch basically keep in contact where I'm gonna find eventually this top line is gonna meet with the S wave travel bar so if I go up like so eventually I'm gonna meet at a point where they match okay so if I look here I think I got a pretty good one right here this looks like it's roughly going to be about 1006 1004 hundred kilometers how I know that is first off I see that the top notch here is in direct contact as in not just a little bit but completely in contact with the S wave travel bar and the bottom one is still in contact with the P wave travel bar this space in here should match two minutes in 30 seconds so the first thing that I'm going to do is I'm going to lead the distance that this matches and I'm going to place it in this box here so if I reach straight down and put it right here that's gonna be one thousand one thousand two hundred one thousand and four hundred kilometers always remembering to place down my units P Way travel time is going to be relatively straightforward notice I have not moved this piece of paper I'm going to read from where it hits I am going to move it across my pencil and I see that it hits directly on three minutes this bottom line remember is the P wave travel bar you can see that that it's still referenced here so I'm gonna rate a label here 3 minutes and 0 seconds just for good measure I also would want to double check to make sure that this is the appropriate time so if I look right here this is 3 minutes 0 seconds up here if I were to check the S wave travel line I see that it's pretty much just directly in the middle between 5 minutes and 20 seconds in 5 minutes and 40 seconds so the s-wave took for this station five minutes and thirty seconds to travel there I'm going to do my double check by subtracting these two the one that represents us and the one that represents the p-wave the 30 minus zero is 30 seconds 5 minus 3 is 2 minutes you see right here this matches what I have here in the difference in the arrival time so I know that this distance of 1,000 and 400 kilometers is that what I am specifically looking for the last thing to fate and figure out for Chicago before I bring it down to this map here is the time of origin the time of origin is literally when the earthquake first started now I'm gonna have to take my P wave arrival time of 2 hours 33 minutes and 0 seconds I'm gonna just place it down right here so what I'm going to do is I need to take the P wave arrival time that I have abbreviated P 80 and subtract from it the P wave travel time PT t so I'm taking this time here and subtracting this time here so this will look like 2 hours 33 minutes and 0 seconds I'm going to subtract 3 minutes and 0 seconds the zeros go right down 33 minus 3 is 30 and 2 comes down so this earthquake first started at 2 hours 30 minutes and 0 seconds by the end of this I should have all three of these stations matching at the time of origin each of them will have different travel times distances difference in arrival time and obviously different arrival times so assuming I have also done these two other timeframes I'm just going to show you what I need to do by taking this distance here and then either just use this compass now this particular compass this is going to be my center point and I'm going to be matching it up with one of these series of holes that will match a particular distance on the bottom I always use the provided scale and notice that I have all of the stations listed here Chicago Tampa in wink Texas so the first distance I have was 1400 kilometers so I put my brass Center at 0 I'm going to find which hole matches one thousand and four hundred kilometers and see it's this small little hole here so I'm just gonna make a little note that it's the fourth hole from the end I'm then gonna bring the entire compass up to Chicago I'm gonna count the one two three four holes and then I'm just gonna draw a circle that represents one two three that represents every point that is going to be one thousand and four hundred kilometers away from Chicago this is going to be the process that we call triangulation that is eventually going to have something from Tampa and from link that is going to get wherever my epicenter is going to be I need the three circles because all three circles are going to intersect at one point all right so once again this is just a refresher to understand how to find arrival time my difference in the arrival time distance from the epicenter p-wave travel time and the time of origin remember it's a good idea to do the double check where I can make sure that where I'm finding on the reference tables the distances in between this space here matches what I identified from the difference in the arrival time thanks very much and have a good day and think earth science always
Up Next
35:28
Magnetic Survey: Principles, Data Acquisition, Corrections & Interpretation
@physicsgeophysicslearningw6104
16.1K views•2020-12-30

12:54
Triumph of Orthodoxy Icon: Byzantine Art & History Explained
@BenCallan
2.1K views•2024-08-06

9:49
FastAPI vs Flask vs Django: Choosing the Right Python Web Framework
@TechWithTim
302.5K views•2024-05-26

1:42
Game of Thrones Opening Credits: A Cinematic Analysis
@gameofthrones
46.3M views•2011-04-18
Related Study Plans & Knowledge Roadmaps
Structured learning paths in General & Interdisciplinary Studies
general-studies
Elevator Engineering: History, Physics & Cities
01From Hoists to Safety Brakes: The Dawn of Vertical Lift
02Hydraulic vs. Traction: The Engineering Physics of Elevators
03Modern Speed, Safety, and Algorithms
+ 2 more learning modules
12h5 modules
Explore Roadmap
general-studies
Rubber: Material Science, History & Geopolitics
01Origins of Natural Rubber & Mesoamerican History
02The Chemistry of Natural Rubber & Vulcanization
03The Geopolitics of the Rubber Boom & Colonization
+ 2 more learning modules
12h5 modules
Explore Roadmap
general-studies
Containerization: Evolution, Logistics & Trade
01Ancient Trade & Bulk Cargo: Amphorae to Barrels
02The Industrial Revolution & Cardboard Packaging
03The Containerization Revolution: Malcom McLean
+ 2 more learning modules
12h5 modules
Explore Roadmap
general-studies
Textile Tech: Evolution, Labor & Global Impact
01Pre-Industrial Textiles: Handloom & Cottage Industry
02Mechanization: The Spinning Jenny to the Power Loom
03The Factory System & Global Labor Transformation
+ 2 more learning modules
10h5 modules
Explore Roadmap