






















![Calculating Breakpoint to MIC Quotients [BMQ]](https://i.ytimg.com/vi/YXPBAzkir3Q/maxresdefault.jpg)

LC-MS/MS (Liquid Chromatography-Tandem Mass Spectrometry) combines liquid chromatography separation with mass spectrometry detection to provide highly sensitive and specific quantitative and qualitative analysis of complex mixtures. The workflow involves sample preparation, separation using HPLC with mobile phase gradients, and mass analysis where ions are generated through electrospray ionization and fragmented in a triple quadrupole system (Q1 for parent ion selection, Q2 for fragmentation, Q3 for product ion detection). Key advantages include superior selectivity over traditional techniques like LC-UV and GC-MS, enabling confident identification of compounds with identical molecular weights through characteristic fragmentation patterns. Method development follows three essential steps: compound optimization (identifying parent and product ions), chromatography optimization (selecting appropriate columns, mobile phases, and gradients), and source optimization (adjusting ionization parameters). Advanced data acquisition modes such as MRM (Multiple Reaction Monitoring) and MRM Cube enhance quantification selectivity and sensitivity for multi-analyte screening applications.
LC-MS/MS Fundamentals: QqQ Technology and Method Development
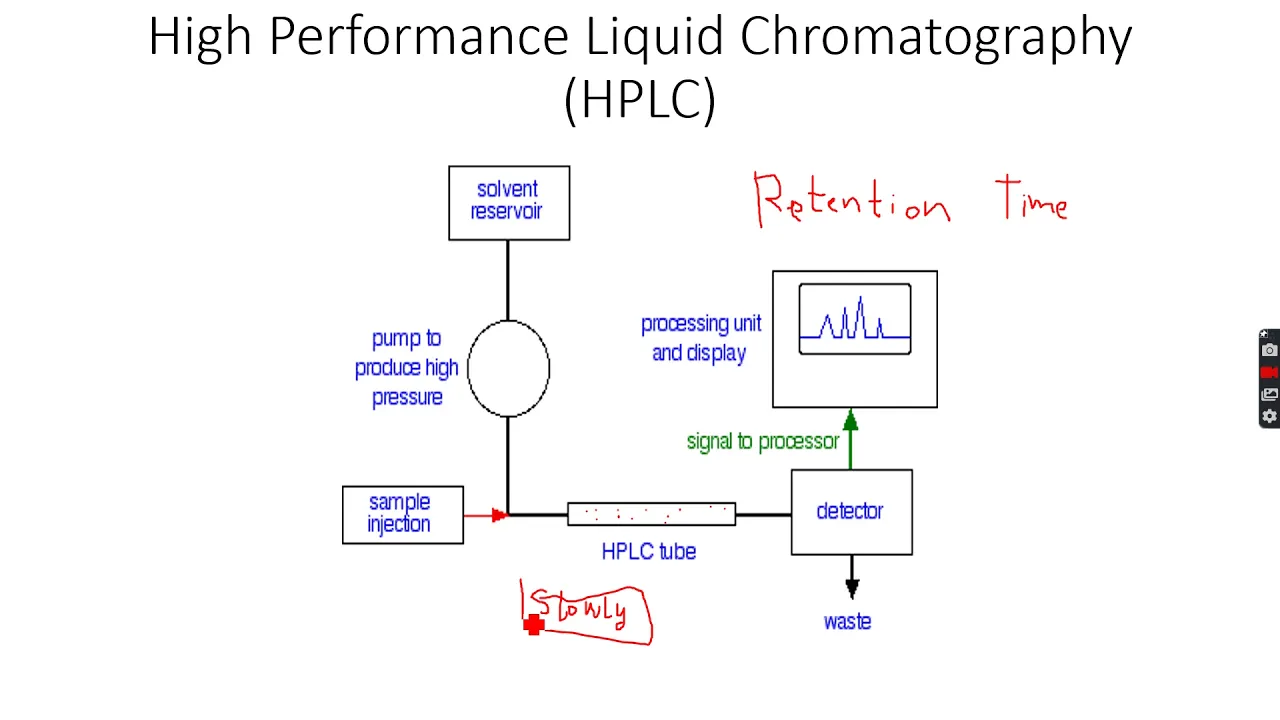
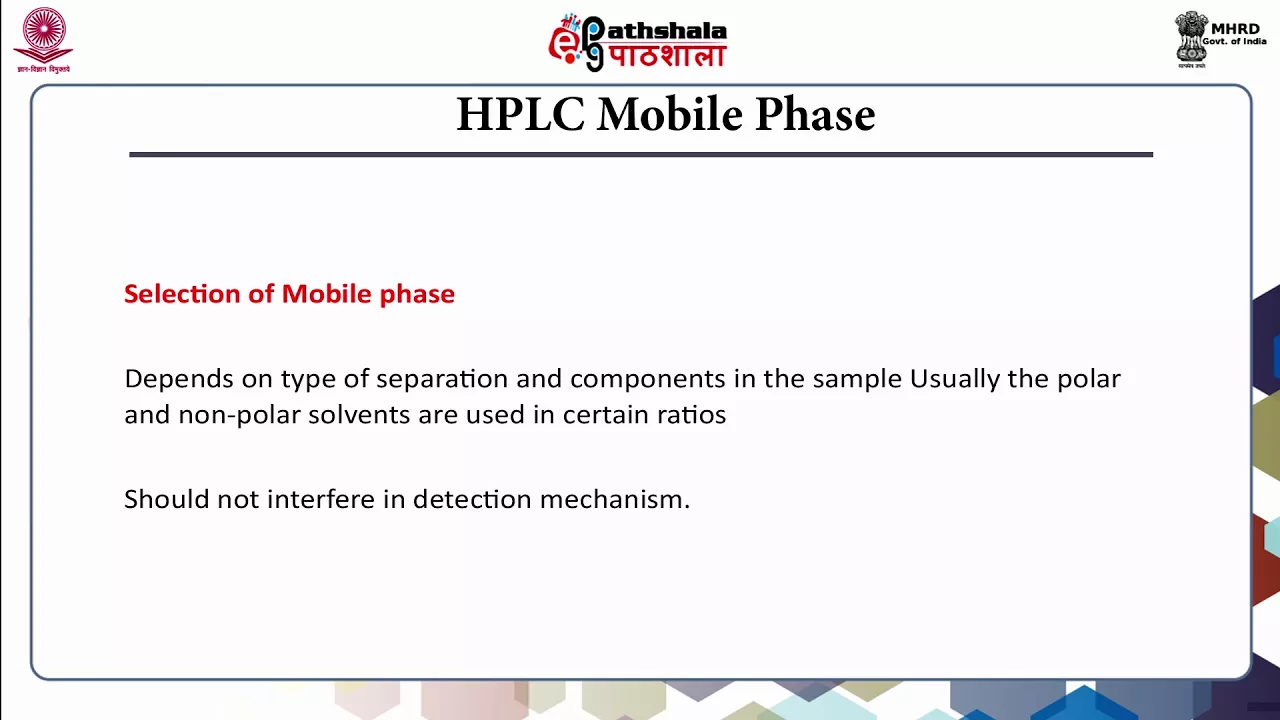
Added:so first of all Let's Take it Back to Basics so what is the lcms workflow and what does it look like so the first part we consider is what samples and what analytes we're going to use so different applications this could be any food samples or water samples or drug molecules whatever your application is the second part to consider is your sample preparation so this plays a fundamental part of the lcms workflow however today what we're going to focus on is the First Step which is separation so the next few slides I'm going to talk about the hlc system and the column so step one separation the hplc system so here on the left we've got our CX X and 2 and the first part I'm going to talk about what is in the top compartment so we have our mobile phase a which is usually aquous and we've got our mobile phase B which is organic then we have our gaser which is there to remove any air in the lines and in this case we've got a binary pump system and the purpose of these pumps is to deliver mobile phas at both steady and precise amounts and our mixer ensures our mobile phase is mixed before continuing to the column so this is what is in this compartment of the hplc system the next part of the hplc system when are going to go through so then we get flow to our Auto sampler we have a syringe here which is shown in D the syringe is used to pick up accurate amounts of sample then we have our column moving which is shown here and the diagram is shown on the right and this keeps our column at consistent temperature and our sample Loop which is loaded with sample Jordan injection so this is just what the hplc looks like the next part to consider in our separation is choosing a column so the components of the mixture are carried through a stationary phase by a flow of mobile phase and the separation is based on the differences in migration rates among the sample components so typically on a column you'd have say some silic particles with um a stationary phase bonded to it sometimes a polymer that is specific and the smaller the Affinity a molecule has for a stationary phase the shorter the time spent in a column so it's really important to choose the correct column for your specific application so this is what a typical chromatography gradient looks like so first of all our mobile phase serves two purposes the first purpose being to displace compounds from the stationary P cause an illustion the second being to transfer transport other compounds through the column and the rest of the LC system so typically we start with a high aquous starting conditions we then ramp up to more organic and as we ramp up to more organic we get more hydrophobic compounds ofu as our organic part increases and then typically we would keep this part a high organic to wash any remaining analyes off the column and then back to aquous for column equilibration so this is just a typical gradient now if we touch on the second part today which is the mass spec so first of all what information does a mass spec tell us so we can gain molecular weight information technically the M over Z which is our Master charge ratio we can also identify the detector masses at any given time and we're also able to look at some fragmentation information also though how can we use this data so one way in which we can use this data is for quantification so for Quant another way mular formula identification the Third Way reproducible fragmentation pattern that gives us clues about functional groups and these can be specific to say two molecules with the same M over Z and help us identify which one's which so this is the information that mass Beth will tell us and how we can use this data so two main ways we can ionize is ESI which is electrospray ionization and apci we typically mainly use ESI um that's that's really common because as you can see it encompasses a lot large molecular weight range and it deals with molecules with polar and very polar um you can also use apci typically in nitroamine applications and but today we're mainly going to focus on electrospray ionization so electr spray ionization how are ions created in Mass spectrometry so we get our flow from the LC and the flow is then displaced into a fine spray of droplets we're then able to form charged droplets we get some heat so we get desolvation and evaporation then we get ionic repulsion with clustering and then our ions enter the mass spe it's important to note that we have these other parameters so we've got our K plate and AR and gas and the purpose of AR and gas is to basically push away anything that isn't our ion of Interest so this just reduces solvent molecules and anything we don't want enter in the mass analyzer so how do our ions travel so this is an example of what the inside of our 7500 system looks like so we've got the O ofus we've got q1 Q2 and Q3 so q1 is where we identify our parent ion or preas ion Q2 this is our Collision cell so this is where fragmentation will occur and then Q3 this is where we would then measure our product ions so what is msms so just as we spoke about before we get two Mass measurements so in just typical Ms we would only measure q1 so we'd only measure our prease ion where here we're measuring both our preas ion in q1 fragmentation in Q2 and then measuring our fragment ions by a second Mass analyzer in Q3 so now let's look at some data acquisition and workflows so now our ions are formed we then decide on our goals and we pick a specific workflow that's um good to use for our application so first of all let's talk about traditional quantification which is mrm so this is what mrm scans for quantification typically look like so as I said before we've got q1 where we identify our parent item in this case it's 215 then we have Q2 where fragmentation occurs and then we have Q3 where we're selecting our products ion and in this case it's 185 so let's now consider the importance of Ms Ms data in comparison to Ms data so here we've got our standard we've got this P here and here we've got a matrix blank and a spike sample so when we're just using Ms data we're observing interference in The Matrix blank and in the spike sample as you can see here so this is just Ms data however when we use mrm data as you can see we're reducing them well we're reducing or eliminating the interference in The Matrix blank which means we're going to reduce and eliminate in our Spike sample which makes it much more easier to identify so now I'm just going to talk about some scans that are unique to our Q trap system so our Q trap system can perform both quantitative and qualitative scans on the same platform and within the same experiment so the two scans I'm going to touch on today is mrm cubes and Epi scan so mrm cubes this is a workflow for highly selective quantification so at the beginning the wayg it's exactly like mrm so we select our prease ion again which in this case is 215 we then get fragmentation occuring in Q2 and then we get isolation of our iron and we get another fragmentation occuring here here so we get a second generation product iron and then this is scanned out so we get two basically a pair of product ions that are specific to our preas ion which obviously makes this much more selective so now let's look at the benefits of using this scan say for instance over mrm for some applications so here on the left you can see we've got interference in our Matrix blank which means we've got interference in this where when we're using mrm cubes we're reducing the interference in The Matrix blank which means that we then get a reduction in our Spike to now let's move on to the next data acquisition and workflow which is mrm EPI and this can be used for multi-target screening so mrm Epi works simly to mrm however we set an intensity threshold in the software so first of all again we select our preas iron which in this case is 215 we then get fragmentation appear in R Q2 but this time we use a spread of three Collision energies the software then controls the full time and the ions then EX and from this we get a fragmentation pattern so how can this help us so we look at this example here is this phoxy carb so we've got our Matrix sample here and we've got our phoxy carb QC here and as you can see there's been a shift of retention time in The Matrix sample and we're unsure whether this is phoxy carb or not because based on retention time we can't really tell because this could have shifted for numerous reasons however when we use the Epi scan we look at our Matrix bank here we see we've got a fragmentation pattern and if we compare this fragmentation pattern to the fragmentation pattern we get for the 1 ppb QC you can see the fragmentation pattern is completely different so then we can say we're confident that this isn't phoxy Gar so just to summarize traditional techniques including LC UV GC suffer from gcms to perform cross reactivity and inadequate selectivity lcmsms is a has many advantages including accuracy and precision Rob robustness sensitivity we can get more confidence when identifying a specific compound and we're able to analyze large panels of compounds and easily add in new analytes to the methods so despite an upfront investment the pay sample cost with LCM SMS is lower if you want to look at this in a lot more detail you can click on our on demand Series so the next part of this highlight series is going to cover method development so it's going to give you some tips and tricks on what you need to think about When developing a method so let's think about the three steps of method development the first step would be compound optimization the second would be looking at your chromatography which we've just touched on before we'll touch on a little bit more in this section and the third would be our source optimization so first of all let's look at compound optimization so there are three major experiments when thinking about our compound optimization the first being our q1 scan because we need to identify our preas ion or parent ion the second being our product iron scan because we want to be able to identify our frag and then the third are mrm scans and this is really where we're optimizing our parameters so this is just a diagram of a mass backc and this is kind of an infusion setup so we' have a syringe and with flow going to the mass back so compound optimization so as I said the first experiment is a q1 scan where we identify our appearance so during this step we'll scan a given Mass range that encompasses our analy of Interest so here our analy of interest is respiring and we've got 68 doton so we've chose our start Mass to and stop Mass to Encompass this so our start mass is 605 and our stop mass is 635 so typically the mass range should be large enough to include addu and in general for a rule would be say plus 25 dotons in positive mode just so we've got a range where we're actually going to identify this molecule okay so the second experiment in our compound optimization now we've identified our parent ion is our product iron scan and this is where we want to identify our fragment of interest and see how this fragments so typically for this we'd set our stock Mass about plus one do of the parent mass or pre Mass so here we've got our P ion is 609 so we've got our stock Mass at about 610 so plus one do and here from this you can see we get a our fragment and we can look at you know you might have in mind what how it's going to fragment and you can identify which fragment is which the third thing to consider now is when is our mrm scans where we optimize our parameters so the first thing could be to look at is the clustering potential so typically the ideal declustering potential will be at the apex of the peak as you optimizing your compound and DP corresponds to the voltage applied to the orifice to minimize the solving clusters so DP is applied before any fragmentation occures and a compound DP is dependent on the parent and not the transition so because it's dependent on this the DP profiles for the same compound should be the same therefore we can't actually use DP to eliminate fragments that are unrelated to the parent the second parameter in our mrm scan for compound optimization we could look at is Collision energy so again the ideal Collision energy will be at the Apex of this piece and after ramping RCA you'll want to choose this volume and in general as a rule the smaller fragments will need a higher C than larger fragments then we have Collision cell exit potential so cxp transmits the ions into the Q3 quadriple so that's the purpose of this and typically it is between 10 to 15 volts and again you'll find ideal cxp at the apex of the Pak when you're doing your compound optimization so now let's look at step two which is our chromat graphy we touch on this a little bit more before and it's in more detail in our under series but let's look at how column length affects things so column length is directly proportional to both pressure and ution time so for a given particle size column efficiency will be directly proportional to the length of the column and it's good to bear this in mind when choosing a column for a specific application the next thing to think about is particle size so as our particle size decreases our pressure is going to increase and our Peak width is going to decrease so when choosing our particle size we need to consider our sample and Sample prep the next thing to consider in chromatography is the selection of a mobile phase so typically a great starting point is.1% formal castom water for our aquous mobile phase MPA and a nital or me EOL for our mobile phase B which is typically organic and here we've just got a list of buffers that we could use and phes and obviously this was is completely specific and application dependent so typically you'll lose you'll most likely lose sensitivity as you increase the pH but increasing ionic strength may also cause loss of sensitivity too so these are just things to consider and as I say it is application dependent again this is a sample gradient where we start off a high aquous we then ramp to more organic and our more hydrophobic components will then elute we then keep it a high organic as we wash the column and then reduce the organic content and increase the aquous content and and then we go into column equilibration okay so the next part of this is our scheduled mrm methods so once we've got the chromatography that you're happy with we can then schedule retention time so schedule and our retention time will improve 12 our time and point across the peak so scheduled mrm monitors each transition at an expected retention time and this means that we can monitor more transitions without while remaining to have Optimum dra time so this is just um an example of how we can set up an mrm method in our software so step one we run a mid or high level standard we then create a method in analytics which we go into in more detail in our on demand series and then we are then able to copy and paste the attention times into the method now let's look at source optimization step three so to optimize The Source in this PR part of the presentation we'll be looking at on column Source parameter optimization so we've gone through these before so we've got gas one gas 2 K gas and iron spre voltage and these are things that we all need to consider um when thinking about our source optimization so once we've got those values we can then look at our optimized LC methods and this just shows example of the C software where we've chose our optimized LC method and then from step one where we've got done our compound optimization and we now know what our ideal declustering potential is our ideal Collision energy and our ideal Collision cell exit potential energy is we can then input this into the method when creating a method from scratch it's good to first know and use geneic Source conditions so this shows The Source conditions the C gas gas one gas two and temperature and iron spray voltage typically used for our different sources with our optiflow Pro ion Source being specific to our CX 7500 system so important things to note when thinking about Source optimization so replica injections are especially important for temperature optimization and this is because say we we have three injections for temperature optimization it may may take one or two injections for the temperature to actually reach the temperature we input if you have a large panel of analytes you'll need to make individual methods again this just shows an example of source optimization so for this specific compound we can say there is we can see there is an increase as ions voltage increases so just to summarize so method development does take time so you need to plan ahead and and when building um a method you need to think about the three steps we've discussed today and we need to start with your compound specific parameters our LC method will also impact our source optimization parameters and if we are adding components to a current method you'll still need to follow the steps that are out land here
Up Next

Thermodynamics and Protein Folding: Bioenergetics Explained
@humbiocore
43.7K views•2011-07-18
Biocatalysis and Catalysis in Islatravir Synthesis | Merck Webinar
@SCIwheresciencemeetsbusiness
675 views•2020-10-08
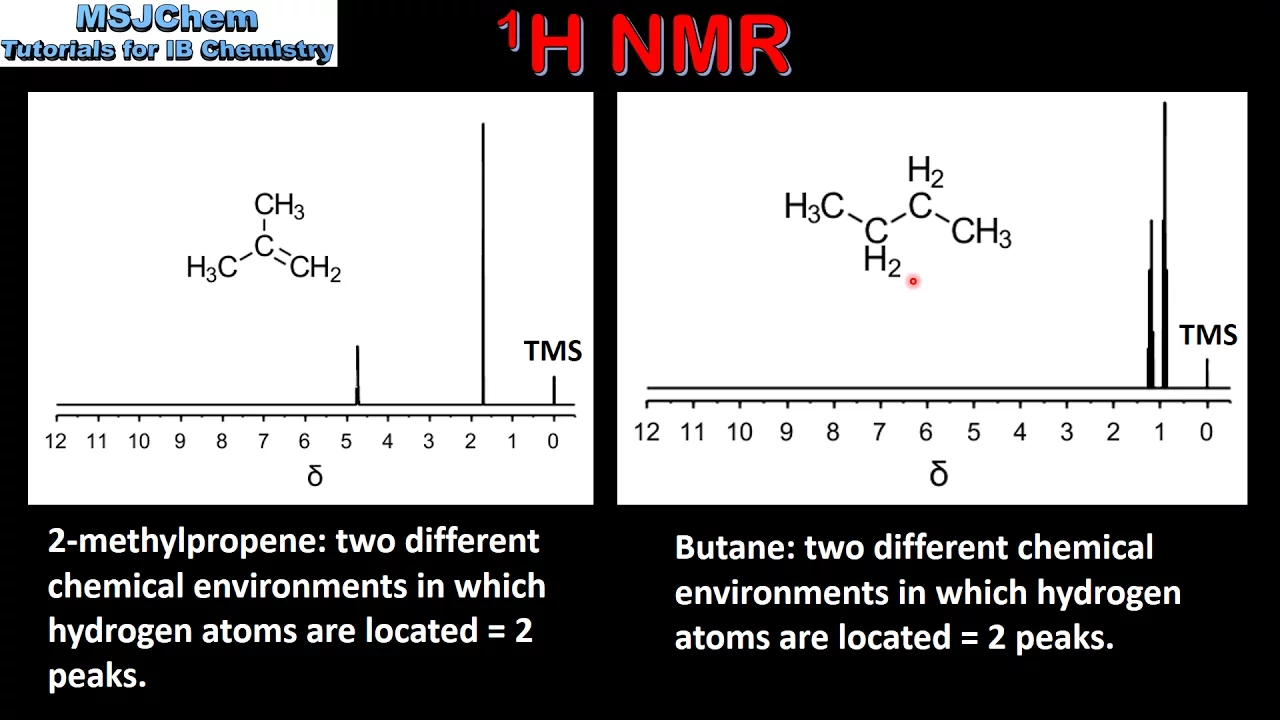
1H NMR: Determining Number of Peaks from Structure
@MSJChem
59.2K views•2017-04-06

Edible Water Bottles: A DIY Guide to Sodium Alginate Spherification
@ryan
10.5M views•2019-06-21
Related Study Plans & Knowledge Roadmaps
Structured learning paths in Chemistry