










![An introduction to Persim for analyzing persistence diagrams [Waqar Hussain Shah]](https://i.ytimg.com/vi/NEo0Hlh1nGY/maxresdefault.jpg)

![Persistence Images [Rachel Neville]](https://i.ytimg.com/vi/zEENPFCHxh0/maxresdefault.jpg)

![Algebraic Stability of Persistence Diagrams [Ziva Urbancic]](https://i.ytimg.com/vi/YR3uhNNblaA/maxresdefault.jpg)




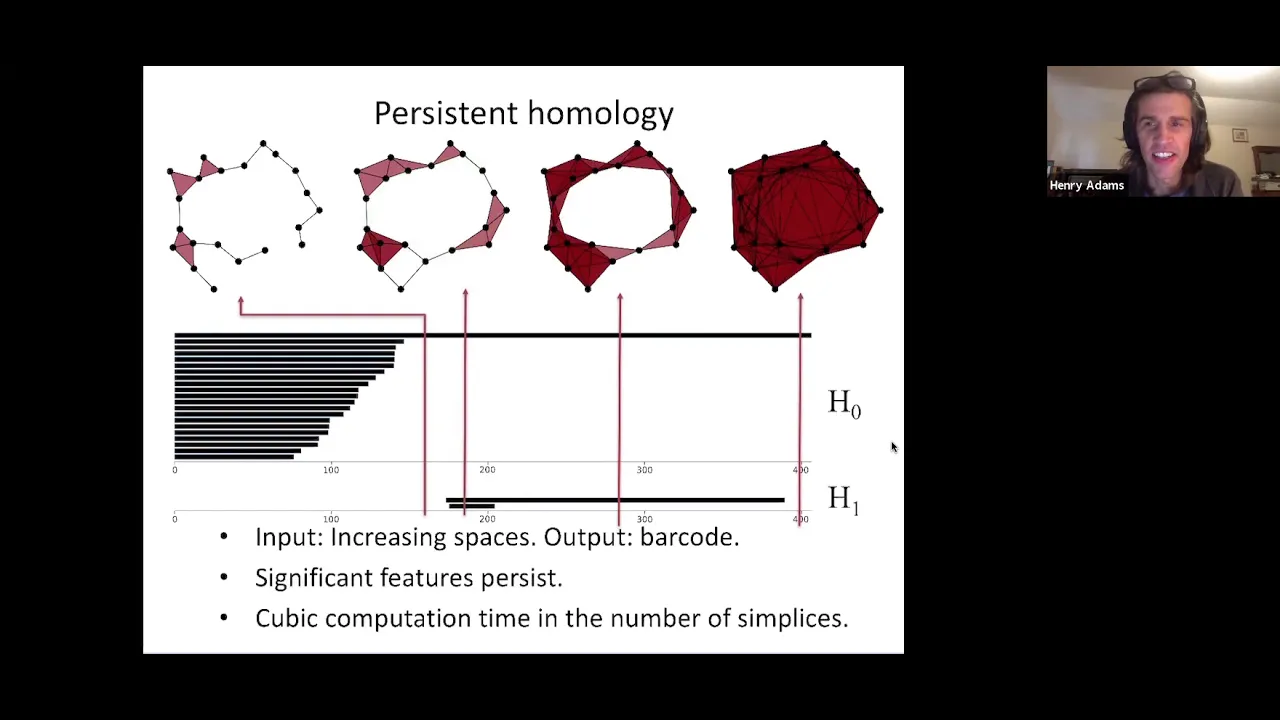
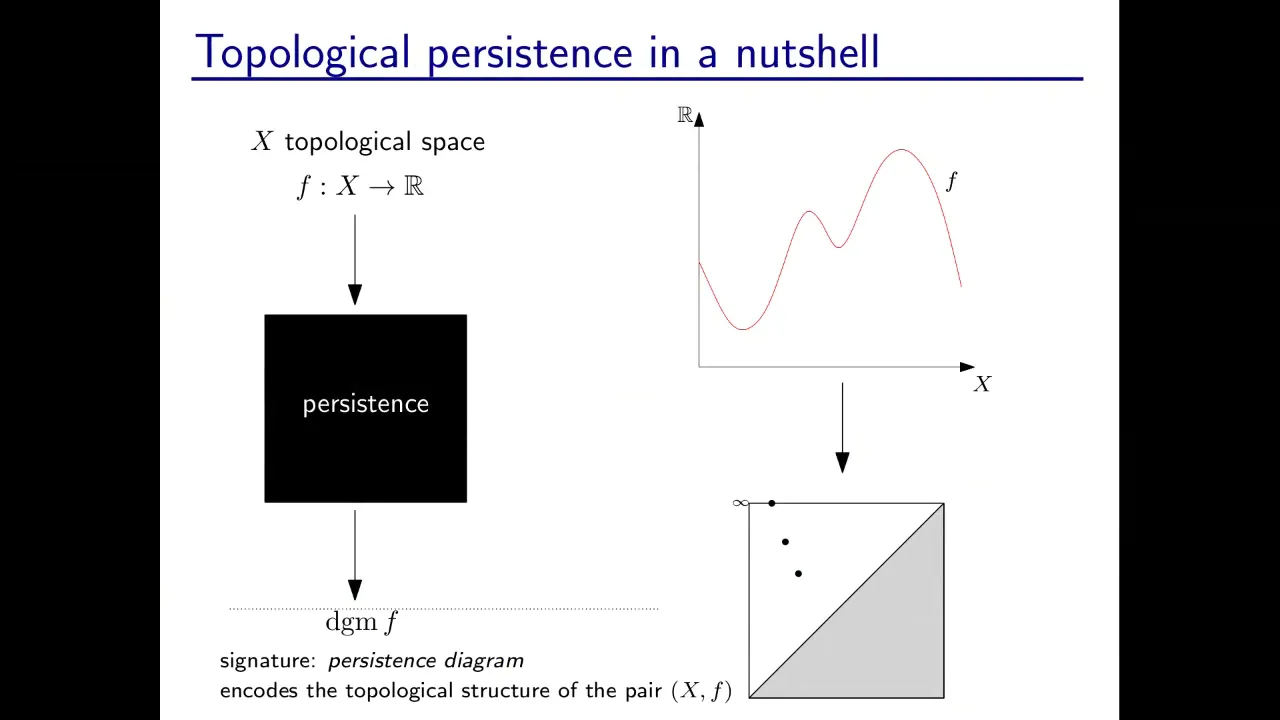
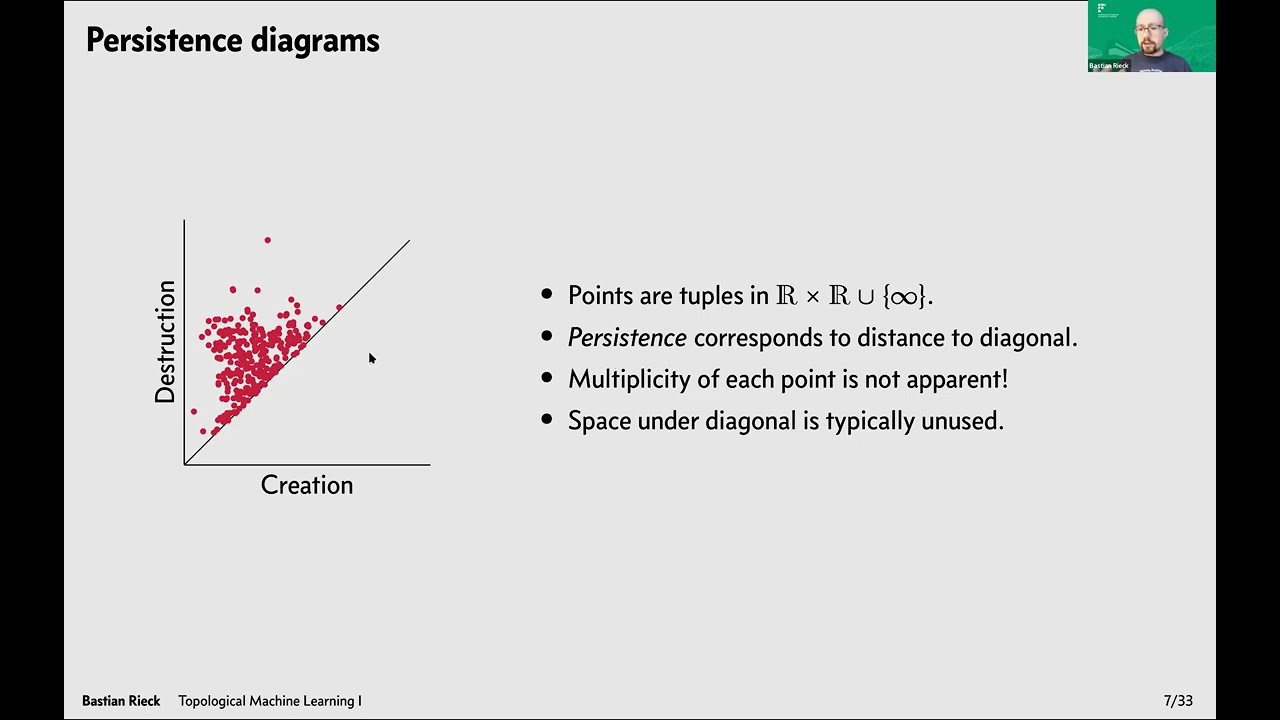
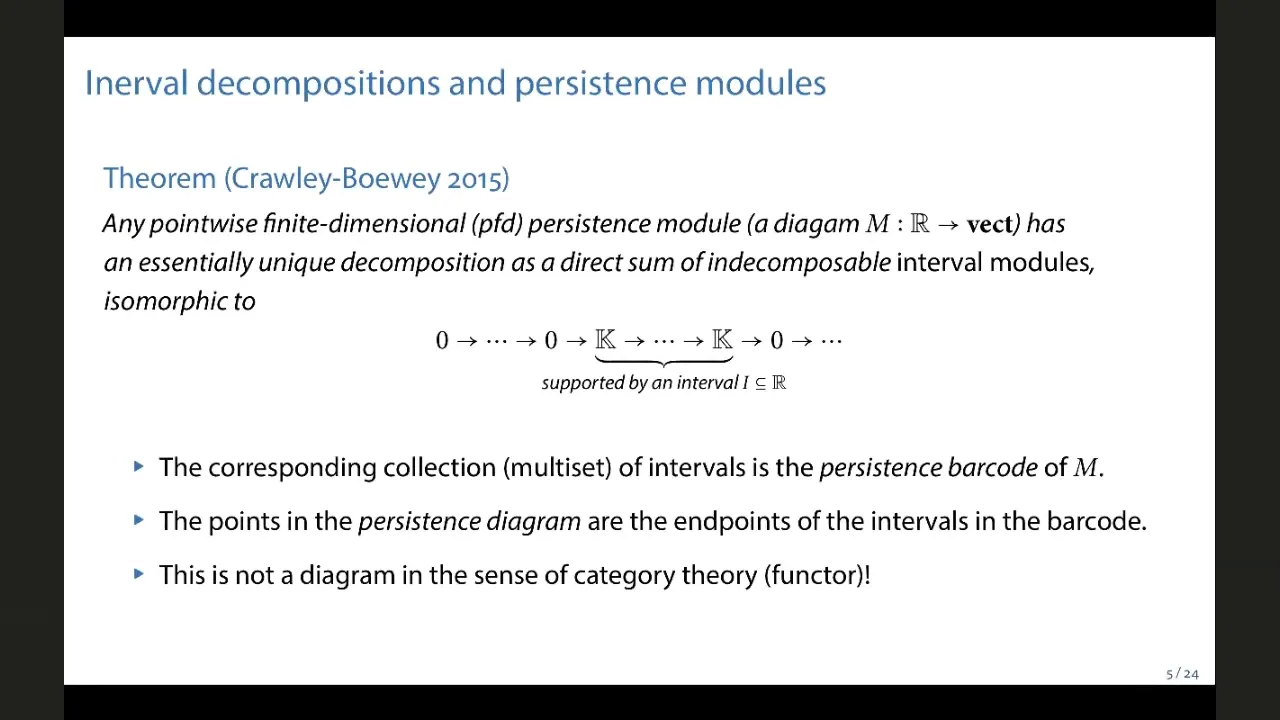
Persistence barcodes and persistence diagrams are two equivalent representations of persistent homology that encode identical topological information; to convert a barcode to a diagram, plot each bar as a point in the plane where the x-coordinate represents the birth scale and the y-coordinate represents the death scale, while the reverse conversion can also be performed by drawing bars corresponding to each point in the diagram.
Persistence Barcodes vs Diagrams Explained | TDA Tutorial
Added:The fundamental concepts of Algebraic Topology, specifically homology groups and Betti numbers (representing connected components, loops, and voids).
The mechanism of filtration in Persistent Homology, specifically how topological features are born and die across varying spatial scales.
An understanding of Simplicial Complexes (such as Vietoris-Rips or Čech complexes) which form the geometric basis for Topological Data Analysis (TDA).
Basic coordinate geometry, particularly the concept of mapping interval coordinates representing birth and death events.
Metrics for comparing persistence diagrams, such as Bottleneck distance and Wasserstein distance.
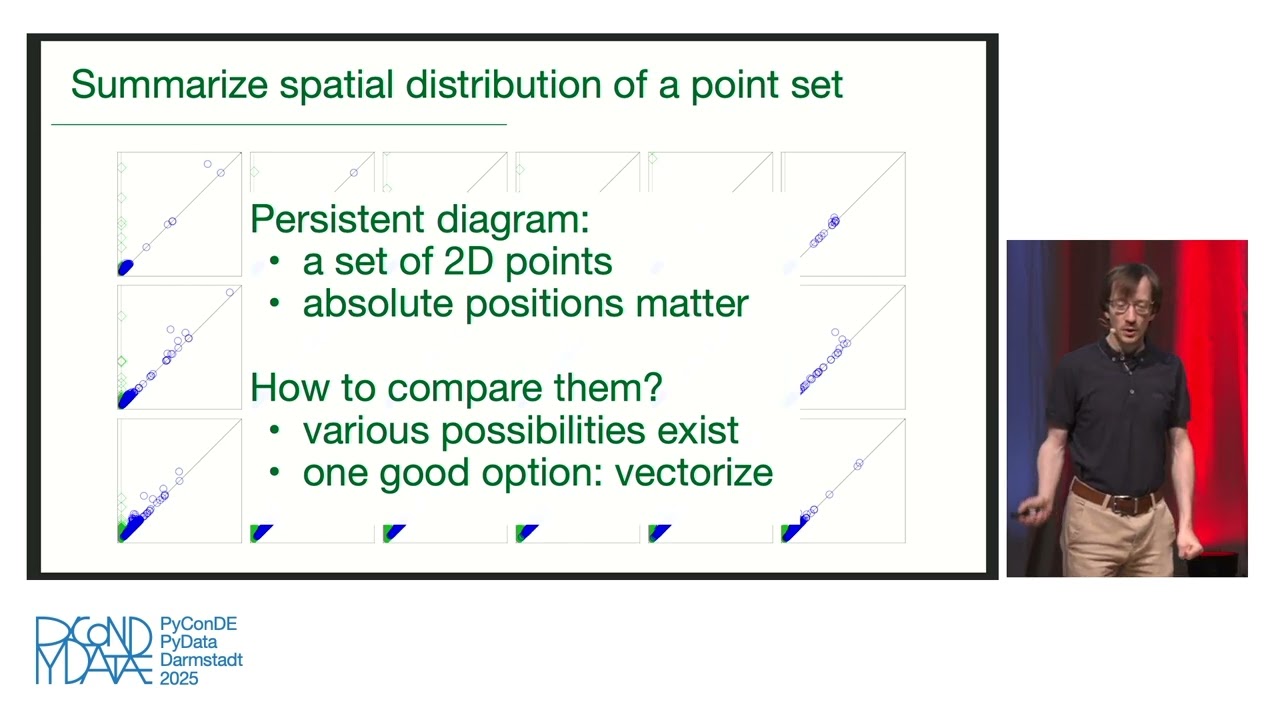
Vectorization techniques for machine learning, including Persistence Landscapes, Persistence Images, and Betti curves.
The Stability Theorems of persistence diagrams, which guarantee that small perturbations in data lead to only small changes in their topological representations.
Practical applications of TDA in fields like bioinformatics, material science, shape analysis, and high-dimensional data visualization.
4.9K views76likes5:04Original Release: 2021-02-18
all right welcome folks my name is henry i wanted to give a brief introduction for how you go from a persistence bar code uh to a persistence diagram and you can also go backwards so these are two representations of persistent homology that contain exactly the same information just they're presented in a different format all right so let's jump right in on the left i have drawn a barcode for you and on the right i have drawn a diagram roughly speaking these these both represent holes in a growing space so we might be checking one-dimensional holes or loops right and and on the left here this bar corresponds to a loop that was born at scale one and dies at scale nine whereas this bar represents a potentially a smaller loop that was born at scale five and dies at scale six so let me show you how to take this persistence barcode and turn it into a diagram so all you do is you take each bar and you turn that bar into a point in the plane so this red bar on top it was born at scale 1 and it dies at scale 9.
so i plot this point here in the plane with x-coordinate or first coordinate 1 and with y-coordinate or death coordinate nine and let's keep going so next we have this bar that's born at scale two and dies at scale seven so i put a point at two seven in the plane and then i have a bar born at scale 3 it dies at scale 11 so i plot the points 311 and then i have a bar born at scale five that dies at scale ten only two more bar born at scale five that dies at scale six and lastly a bar born at scale six that dies at scale eight all right so you can see how these two representations contain exactly the same information i've shown you how to go from the barcode to the diagram but vice versa you could try it out yourself if i gave you a diagram you could instead plot the bars corresponding to that diagram thanks very much i'll actually take any questions from the audience if there are any um when do you recommend uh taking the barcode and when the diagram are there certain situations where you would prefer one over the other i'll say that i mean many people will have different answers here you know in applied topology we often turn um you know turn persistent homology output into machine learning input these days and a lot of the ways for doing that such as persistence landscapes or persistence images are built on top of diagrams so that's one common reason to use diagrams also i think when you talk about the bottleneck distance or the waserstein distance between persistent homology people often use diagrams to describe that although you can often use you can't describe that using barcodes personally when i introduce homology persistent homology to a complete beginner i i start with barcodes but that's just my personal preference and other people take the opposite approach great question and and i think that's a great question to ask anybody in applied topology and see what their reaction is any other questions yeah i'd have a question is there any um any order that you want to give to the barcodes the like the vertical order so to say is that does it play a role great question and that really confuses people about the barcode representation the vertical axis in some sense has no meaning okay so if i if i swapped the order of two bars one on top of the other you're not changing the barcode so oftentimes bars are just ordered by birth time or death time you can see here they're ordered by first time okay but yeah that's one confusing aspect of the bar code the vertical axis in some sense has no meaning any last questions thanks so much you
Up Next

66:15
Python Tutorial on Topological Data Analysis | Elizabeth Munch
@AMSShortCourseonComplexSocialS
17K views•2021-02-16

4:43
Elliptic Curve Cryptography Explained: ECC, ECDSA, ECDH
@PracticalNetworking
28.5K views•2024-10-21
15:03
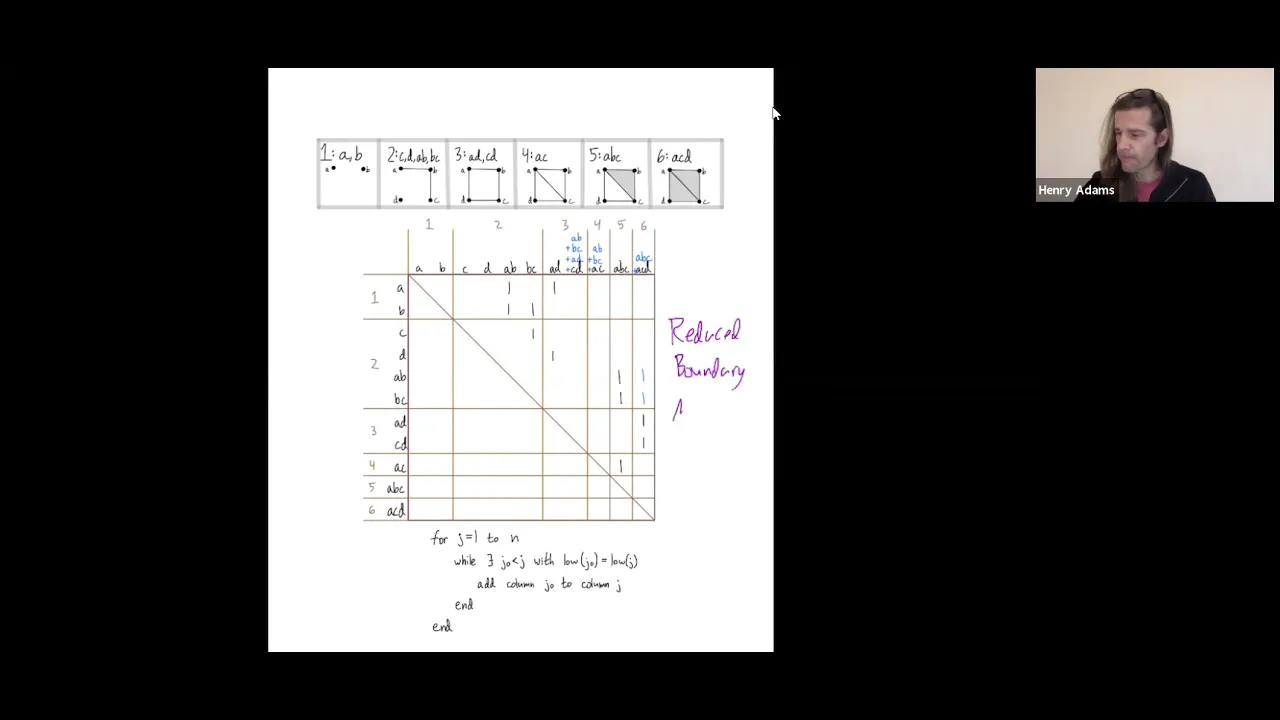
Persistent Homology Algorithm Explained with an Example
@aatrn1
3.5K views•2021-11-18

6:00
The Mathematical Impossibility of Accurate World Maps
@Vox
23.3M views•2016-12-02
Related Study Plans & Knowledge Roadmaps
Structured learning paths in Mathematics
mathematics
Tensor Calculus: Vectors to Riemann Curvature
01Mathematical Foundations: Linear Algebra & Calculus
02Covectors, Dual Spaces, and Tensor Basics
03The Metric Tensor and Index Gymnastics
+ 2 more learning modules
40h5 modules
Explore Roadmap
mathematics
Gödel's Incompleteness: Logic, Proofs & Limits
01Introduction to Formal Systems & Hilbert's Dream
02Set Theory, Cardinality, and Cantor's Diagonal Argument
03Arithmetization and Gödel Numbering
+ 2 more learning modules
14h5 modules
Explore Roadmap
mathematics
Galois Theory: Fields, Groups & Solvability
01Foundations of Abstract Algebra: Groups & Fields
02Polynomials & Field Extensions
03Splitting Fields & Symmetries
+ 2 more learning modules
24h5 modules
Explore Roadmap
mathematics
Non-Euclidean Geometry: Models & Geodesics
01Euclid's Fifth Postulate and the Birth of New Geometries
02Hyperbolic Space and the Poincaré Disk Model
03Geodesics: Defining Straight Lines in Curved Spaces
+ 2 more learning modules
15h5 modules
Explore Roadmap