






![[5] Imagerie Par Résonance Magnétique Nucléaire IRM /Bases Physiques de l'Imagerie Médicale](https://i.ytimg.com/vi/40Z_deNcS-Y/maxresdefault.jpg)



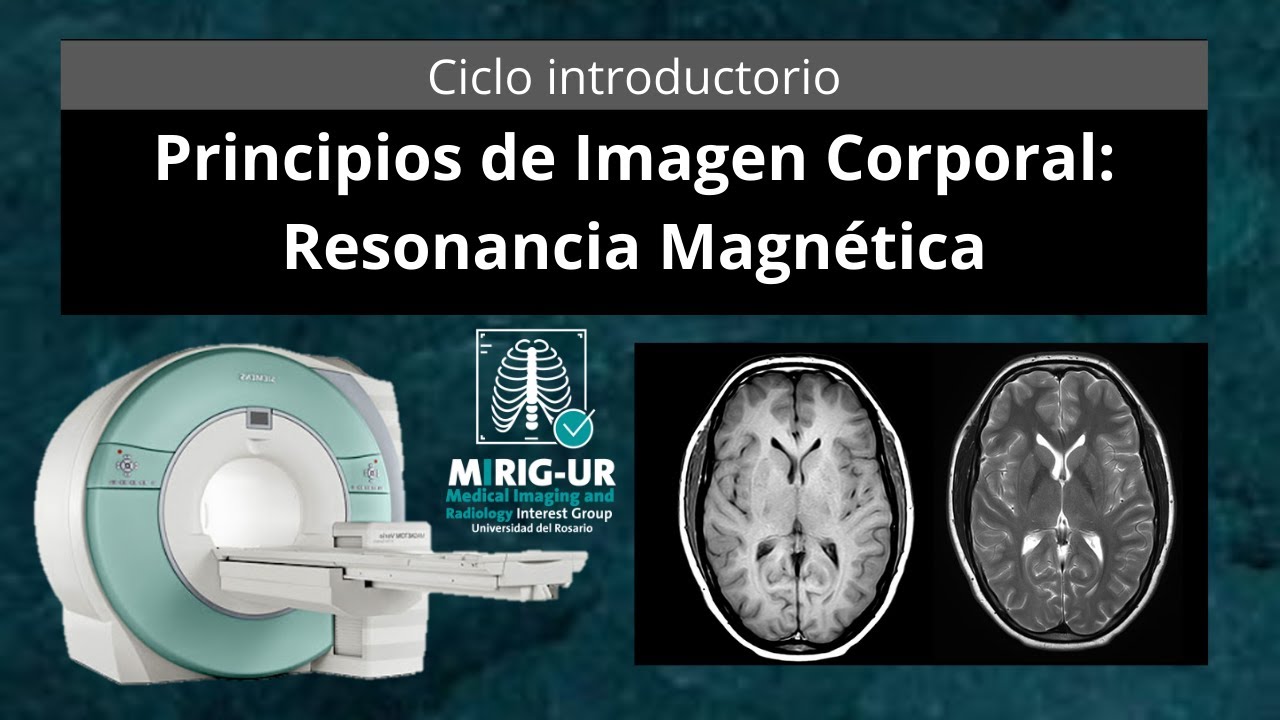




In MRI, tissues are differentiated based on their T1 and T2 relaxation times: T1 relaxation (longitudinal) measures how quickly net magnetization returns to the z-axis after an RF pulse, while T2 relaxation (transverse) measures how quickly transverse signal decays due to loss of phase coherence; since T2 relaxation always occurs faster than T1 relaxation, tissues with different molecular environments produce varying signal intensities, enabling differentiation—pure water appears bright on T2-weighted images and dark on T1-weighted images, while fat appears bright on T1-weighted images, and pathological tissues typically appear T1 dark and T2 bright due to increased water content.
MRI Basics: T1 vs T2 Relaxation and Tissue Contrast Explained
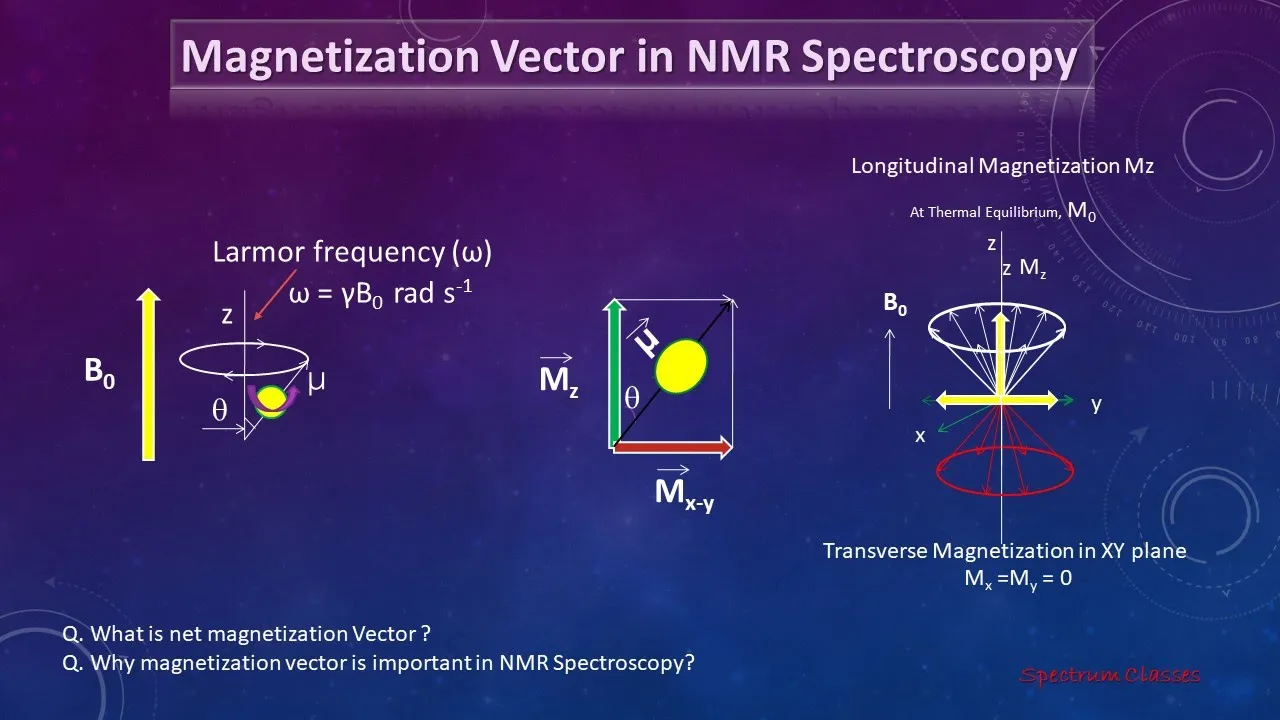
Added:The basic physics of Nuclear Magnetic Resonance (NMR), including proton spin and precession in an external magnetic field (Larmor frequency).
The concept of net magnetization, specifically distinguishing between longitudinal and transverse magnetization vectors.
The role of the Radiofrequency (RF) excitation pulse in tipping the net magnetization vector from the longitudinal to the transverse plane.
Basic biochemical composition of human tissues, particularly the difference in molecular environments of hydrogen protons in water versus fat.
Understanding how Repetition Time (TR) and Echo Time (TE) are manipulated in pulse sequences to produce T1-weighted, T2-weighted, and Proton Density (PD)-weighted images.
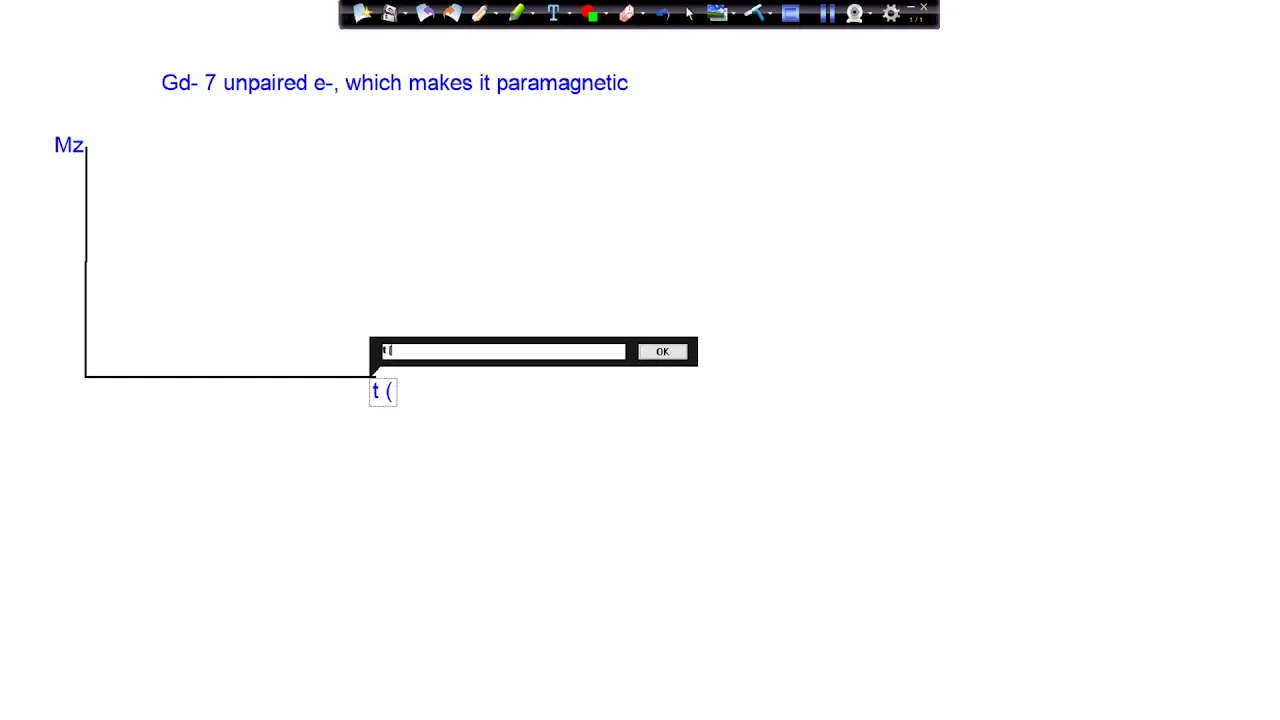
The mechanism and clinical utility of gadolinium-based contrast agents in shortening T1 relaxation times to highlight pathology.
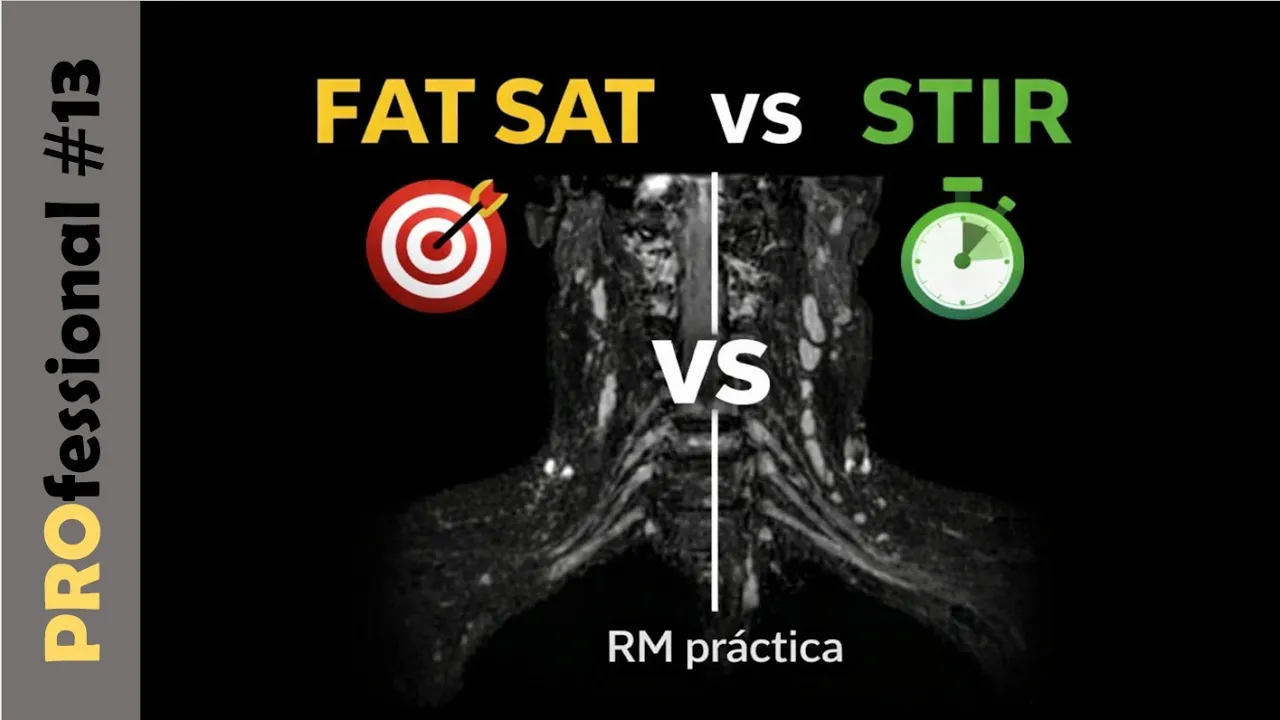
Advanced tissue suppression techniques such as FLAIR (Fluid-Attenuated Inversion Recovery) and STIR (Short Tau Inversion Recovery).
Clinical interpretation of MRI signals, focusing on how pathological processes (such as edema, ischemia, and tumors) present on T1 and T2 weighted sequences.
101.8K views2Klikes16:48Original Release: 2022-02-27
this is a video in a series it can be watched in isolation but if you're a beginner or certain terminology doesn't make sense i strongly recommend watching the videos in order by accessing the playlist in the top right of your screen in the last video we covered how we get mri signal this video will cover how we differentiate tissues on mri by introducing the concepts of t1 and t2 relaxation and what some commonly imaged tissues look like so again after the rf pulse we've tipped our net magnetization into the x y plane and as we showed earlier the nuclei are also precessing like a top at a particular frequency in sync in that plane this doesn't happen forever and over time you start to lose your signal over time through interactions with the surrounding environment the net magnetization vector will relax back to the said axis remember the z axis is the longitudinal axis so this process is called longitudinal relaxation also known as t one relaxation at any given point between the x y plane and the z axis there's going to be a net magnetization vector with a z axis component or a longitudinal component and a transverse component in the x y plane what matters here is that depending on the tissue environment the net magnetization will relax back into the z-axis at different rates so at any given time different tissues will have different amounts of detectable signal and can be differentiated based on this if the vector hasn't recovered all the way back into the z-axis it has a partial longitudinal component if we apply an another rf pulse when it has a partial component the resultant net magnetization in the transverse plane will be equal to the amount of the z-axis component just prior to the rf pulse this is important because as we mentioned we detect signal in the x y plane so in order to detect differences in t1 relaxation we need to allow them to relax at different rates in the z axis and then apply an rf pulse and listen in the x y plane a separate but related process is transverse relaxation or t2 relaxation remember we also mentioned that after an rf pulse not only do we tip the net magnetization to the xy plane but the hydrogen nuclei also start to precess in the x y plane in sync in order to maintain signal in the xy plane or in the transverse plane the precessing molecules have to one remain in sync as they precess and two stay in the xy plane so over time the transverse signal goes away which is called transverse relaxation or t2 relaxation in this diagram we have here we have the z-axis pointing upwards and that's again the magnetic field direction and over here we have the x-y plane that's flat and early on we have a single line here that represents all of the precessing molecules in sync and the red line here is the net magnetization vector that shows full signal at the beginning here over time so this yellow line here represents time over time the nuclei begin to lose their phase coherence and they precess slightly out of phase and eventually lose signal on the x-y plane in other words they relax in the transverse plane transverse relaxation or t2 relaxation this is based on interactions of the hydrogen nuclei with the molecular environment and it's also referred to as the true t2 effect a key point that might not be immediately apparent is that anything that causes t1 relaxation as we showed here it moves into the z-axis or moves the magnetization towards the z-axis is always going to result in a concomitant loss of transverse magnetization if all of the magnetization was in the z axis then the transverse component is going to be zero in other words any t1 relaxation is always going to cause or be accompanied by t2 relaxation but there are other additional interactions that can also result in more t2 relaxation as illustrated in this diagram down here where we lose phase in the xy plane remember the precession has to remain in phase to keep transverse signal so there is further loss of signal when they lose phase coherence knowing this we can see that the t2 relaxation is always less than the t1 relaxation in other words t2 relaxation happens more quickly because again anything that causes t1 relaxation also causes t2 relaxation plus loss of phase coherence causes t2 relaxation so t2 times are always lower than t1 times again don't lose sight of the main point here if none of that made sense the main point here is that different tissue environments result in different relaxation rates and therefore different tissues can give us different amounts of signal and they look different on imaging i should mention that t2 refers to true t2 effects due to energy transfers with the tissue environment again the mechanisms aren't important but what is important is the concept of t2 star t2 star refers to observed transverse relaxation which includes the effects of magnetic field in homogeneities remember earlier we mentioned that hydrogen nuclei precess at a particular frequency the larmor frequency that was directly proportional to the magnetic field strength any magnetic field in homogeneity will result in some protons that experience higher field strengths and others with lower field strengths so the ones that have higher field strengths precess faster than the other ones if that happens then of course you know that there will be a resultant loss in signal in the transverse plane very quickly because the transverse magnetization depends on procession remaining in sync local field in homogeneity can be caused by things like metal calcium hemosiderin all things that affect the magnetic field that hydrogen nuclei around these things experience as a result things around the metal for example will lose t2 signal very quickly and show up as very dark on these images t2 star is always going to be shorter than true t2 because t2 star is just the t2 effect plus the effect of the magnetic field in homogeneities before i go on if you have no mri background and are lost right now that's okay just stick it out we'll get to more clinically relevant things relatively shortly if you take one thing away from the last few slides it should be this any given tissue has a particular t1 relaxation time namely how fast it recovers magnetization of the z-axis and a t2 relaxation time how long it takes for transverse signal to decay and we can differentiate tissues based on this which is the whole point of imaging now in order to create mri images the mri goes through a complex set of precisely time manipulations rf pulses gradients etc called pulse sequences we're going to go over some pulse sequences commonly used in abdominal imaging in the next section but these pulse sequences are what are run to get you all of the images that you end up looking at on the workstation the pulse sequences can result in images that are t1 weighted or t2 weighted which describes which characteristics of the tissue we're trying to look at are we trying to differentiate tissues based on their t1 relaxation or their t2 relaxation no sequence is purely t1 or t2 weighted but a pulse sequence is designed to try to bring out the t1 or t2 characteristics of each of the tissues to differentiate them and we'll briefly talk about how that happens in the next section so let's start diving into what tissues are going to look like on these t1 and t2 weighted images that you're going to be look at looking at using the concepts that we've learned of relaxation remember in mri we're really only imaging hydrogen atoms in water and in fat mostly water so let's start by considering pure water and pure fat here we have water and fat hydrogen atoms yellow is fat and blue represents hydrogen and water and they are aligned with the external magnetic field in the longitudinal or z-axis we apply a 90 degree rf pulse and the net magnetization vector is knocked down to the xy plane and precesses in sync in the xy plane water has a very long t1 relaxation time so it likes to stay closer to the xy plane for a long period of time fat on the other hand has a short t1 relaxation time so it recovers towards the z axis pretty quickly fat now after some time has a much larger component than the water in the z-axis the fat has recovered quite a bit more in the z-axis so when we apply another rf pulse at this point again the fat is going to have a lot more signal than the water on pulse sequences that are t1 weighted fat is going to be very bright and water is going to look relatively dark similarly it takes a long time for the t2 signal of water to decay so you maintain your water signal on t2 images for a long time t2 on t2 weighted images water looks very bright fat is a little more complex we won't talk about fat on t2 for now what about all of the other tissues what are they going to look like on mri so again mri is looking at hydrogen molecules in water and in fat and we talked about pure water and pure fat on the last slide we've also displayed these in the first two rows so pure water and pure fat so water is going to be t1 relatively dark and t2 pretty bright or very bright fat is going to be bright on t1 weighted images it's more complex on t2 weighted images but for fast spin echo or fast t2 weighted images um fat is going to look relatively bright in other tissues in the body like the liver or the pancreas or other tissues we're not really dealing most of the time with pure water or pure fat instead the hydrogen molecules in water and in fat mostly water actually are in in an environment of other macromolecules these macromolecules are going to affect the t1 and t2 relaxation times of the hydrogen molecules in the water in those tissues so we're still imaging the water for example in the liver but the t1 and t2 relaxation times are severely affected by the macromolecules that are in the liver that's why in a normal liver the t1 signal is relatively bright and the t2 signal is relatively dark as an aside most lesions that you're looking for a lot of lesions that you're looking for in the liver are going to be t2 brighter than the t2 dark background liver so they're going to stand out in comparison similarly on t1 weighted images most lesions are going to be relatively t1 dark compared to a brighter liver but we'll talk about that more in the liver mri video most pathology in general is going to have a high water content so it's mostly going to be t1 darkish and t2 brighter it's worth knowing a few commonly seen things that do not follow those signal characteristics for example the signal of blood products depends on the age of the blood products but for now and especially in body imaging we're often looking for subacute blood and it's often going to show up as t1 hyperintense or t1 bright the t2 signal in blood is going to depend on when you're imaging it this is similar to proteinaceous material and mucin mucinous material more proteinaceous and mucinous materials can be t1 bright and t2 darker especially when the mucin becomes very dry or inspicated hemosiderin or chronic blood products are going to be dark on all sequences so dark on t1 and dark on t2 and very fibrotic tissues are also going to be dark on t1 and t28 images there's not much water in densely packed fibrosis lastly not on this diagram but air and metal are going to look completely black on all sequences because there are no water or fat hydrogen nuclei in either if this is confusing you don't worry after we get through this introductory stuff we're going to pull up some mris and review all of this stuff again for now look at this image this is a t2 weighted image through the upper liver you see the csf is bright here that's almost like pure water this is a t2 weighted image fat is bright here the fluid in the stomach is bright the liver is relatively dark and we have a focal lesion here that is relatively bright this happens to be a hemangioma but notice how good mri is at contrasting the background liver to the focal hepatic lesion if you've made it this far in the video i'm hoping you've learned something valuable if you have and want to support the channel and have access to some exclusive content including case-based resources join our patreon at patreon.com navigating that's patreon.com navigating in the next video we'll cover some basic pulse sequences like gradient and spin echo we'll introduce the parameters of tr and te and how they can be manipulated to make t1 weighted and t2 weighted images we'll illustrate these concepts using mrcp images as an example
Up Next

3:41
Introduction to Piezoelectric Effect: Generating Electricity from Crystals
@KeystoneScience
92.7K views•2016-12-21
6:05
Radiation Units Explained: Gray, Sievert, and More
@SciShow
342.1K views•2019-09-12

32:32
NMR Spin Physics I: Zeeman Effect, Resonance Condition & Larmor Frequency
@nptel-indianinstituteofsci8064
2.3K views•2024-01-17

27:14
Entropy and the Second Law of Thermodynamics Explained
@veritasium
27.5M views•2023-07-01
Related Study Plans & Knowledge Roadmaps
Structured learning paths in Physics
physics
Medical Physics: Imaging, MRI & Radiotherapy
01Foundations of Radiation and Matter Interaction
02X-Ray Imaging and Computed Tomography (CT)
03Magnetic Resonance Imaging (MRI) Physics
+ 3 more learning modules
15h6 modules
Explore Roadmap
physics
Nuclear Physics (Decay, Fission & Reactors)
01Atomic Structure and the Binding Force
02Radioactive Decay and Half-Life
03Nuclear Fission Mechanics and Chain Reactions
+ 2 more learning modules
12h5 modules
Explore Roadmap
physics
Soft Matter (Polymers, Colloids & Rheology)
01Foundations of Soft Matter & Thermal Forces
02Polymer Physics and Macromolecules
03Colloids, Surfactants, and Self-Assembly
+ 2 more learning modules
38h5 modules
Explore Roadmap
physics
Analytical Mechanics: Lagrangian & Hamiltonian
01Mathematical Foundations: Calculus of Variations
02From Newtonian Mechanics to Constraint Dynamics
03The Principle of Least Action & Lagrangian Mechanics
+ 3 more learning modules
28h6 modules
Explore Roadmap