
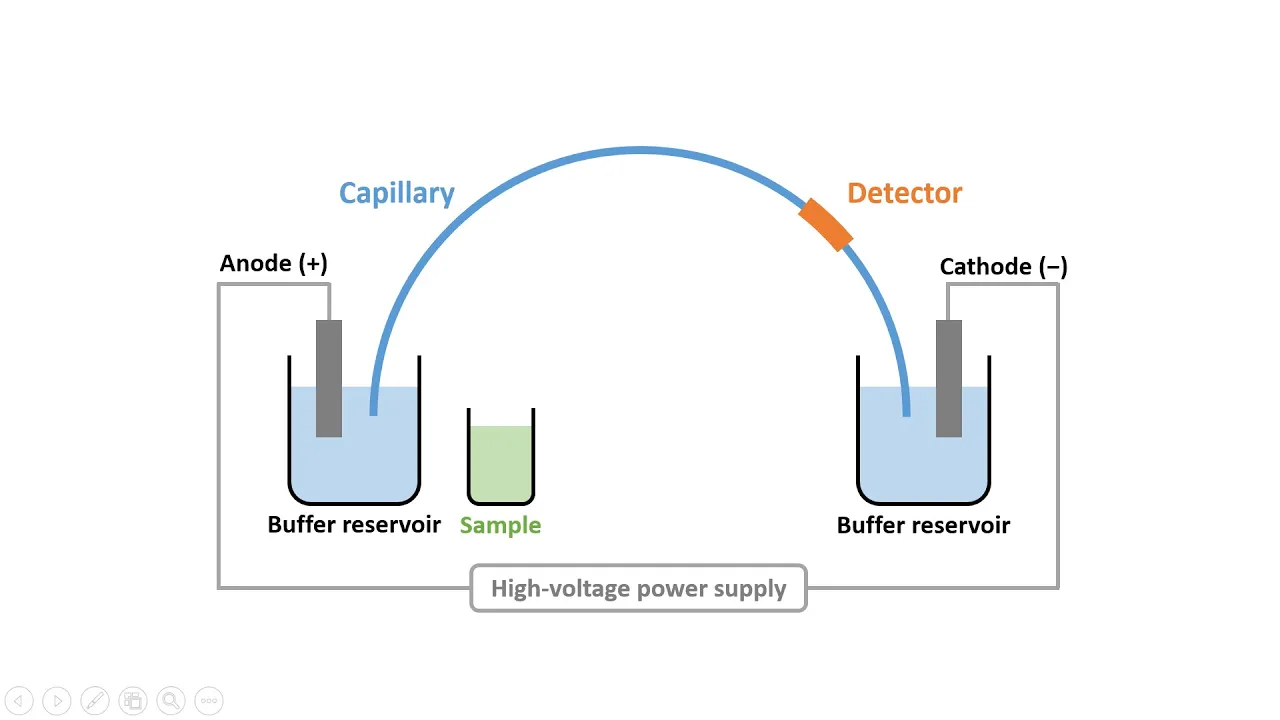
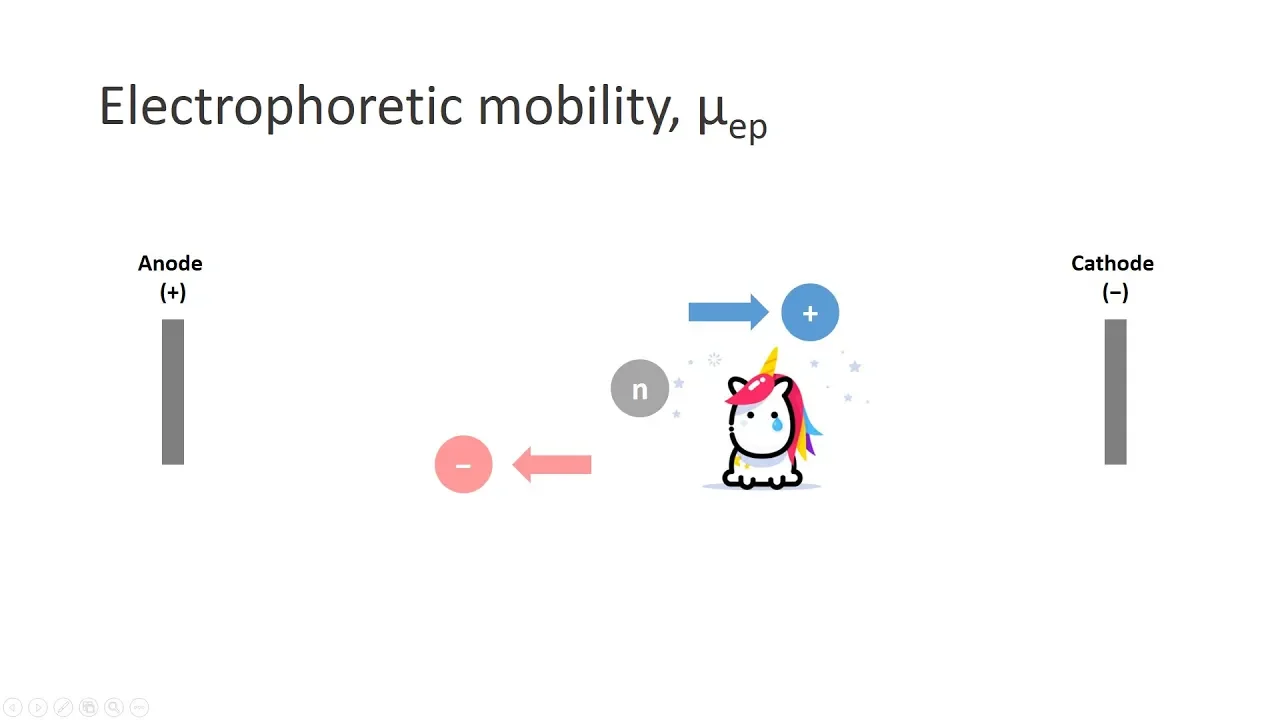




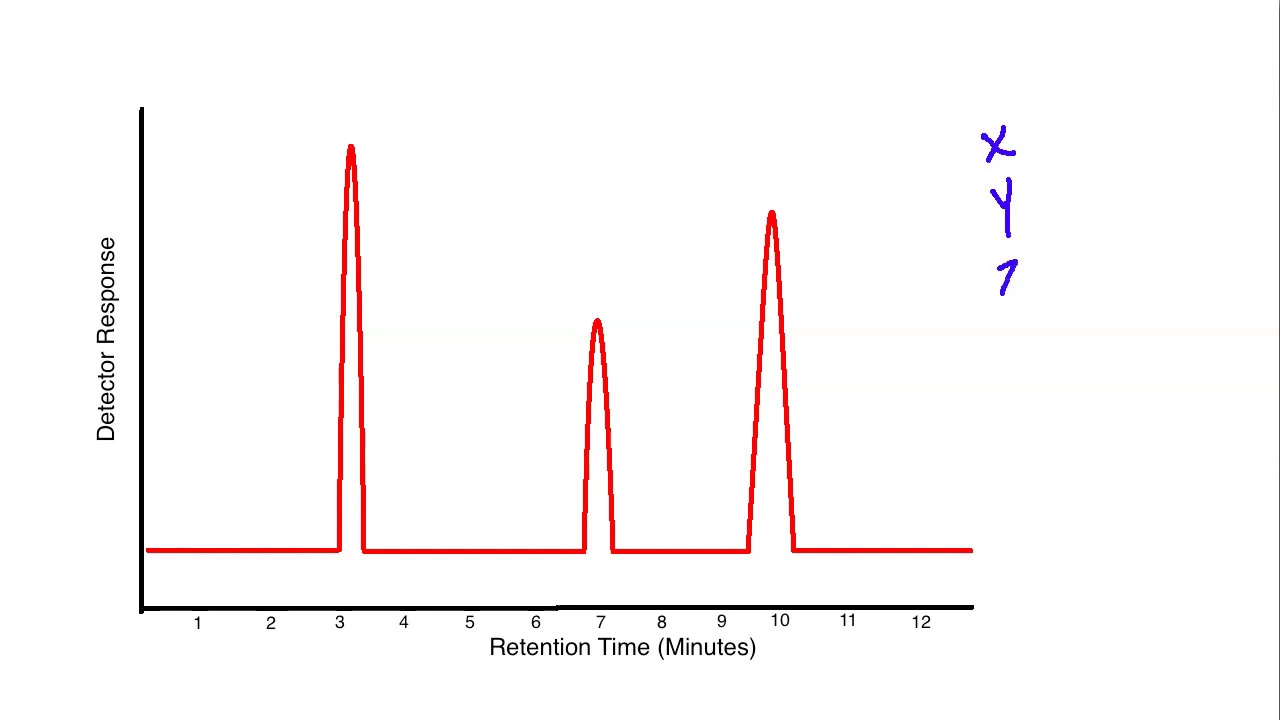









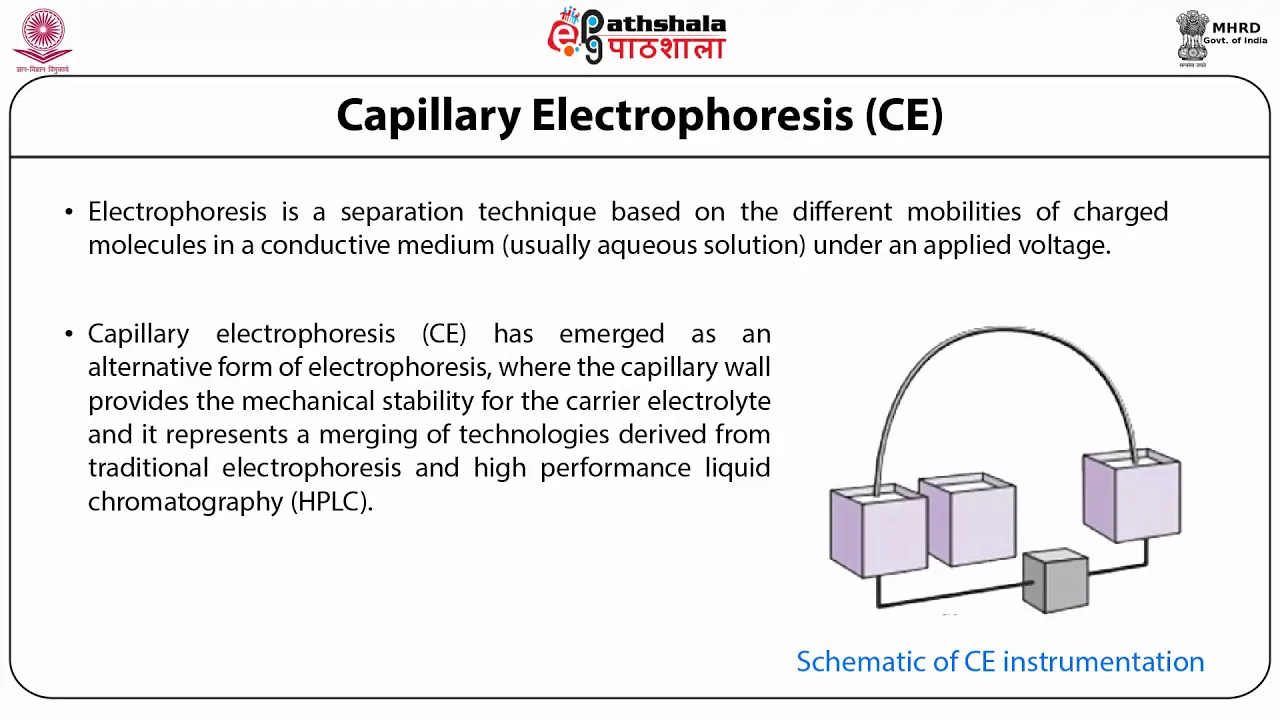











In capillary electrophoresis, migration time—the time for a solute to travel from injection to detector—is calculated as length to detector divided by migration rate, where migration rate equals (electro-osmotic mobility + electrophoretic mobility) × (voltage/capillary length); thus, migration time is directly proportional to capillary length and inversely proportional to applied voltage, while corrected peak area (accounting for varying migration velocities) provides concentration information for quantitative analysis.
Capillary Electrophoresis: Migration Time & Corrected Peak Area Explained
Added:Basic principles of Capillary Electrophoresis (CE), including electrophoretic mobility and electroosmotic flow (EOF).
Fundamentals of analytical separation sciences and how to read a standard chromatogram or electropherogram (identifying peaks, baseline, and retention time).
The basic relationship between detector response, peak area, and analyte concentration in quantitative chemical analysis.
The physical concepts of velocity and how charge-to-size ratio influences the movement of ions in an electric field.
Method validation and quantitative calibration strategies (such as internal and external standardization) utilizing corrected peak areas.
Advanced modes of Capillary Electrophoresis, such as Micellar Electrokinetic Chromatography (MEKC) and Capillary Gel Electrophoresis (CGE).
The impact of instrumental and experimental parameters (e.g., capillary temperature, applied voltage, and buffer pH) on migration time reproducibility.
Hyphenated analytical techniques, such as Capillary Electrophoresis-Mass Spectrometry (CE-MS), for high-resolution proteomic and metabolomic analyses.
Troubleshooting common electropherogram anomalies, such as peak tailing, fronting, and current fluctuations.
27.7K views354likes7:10Original Release: 2019-02-25
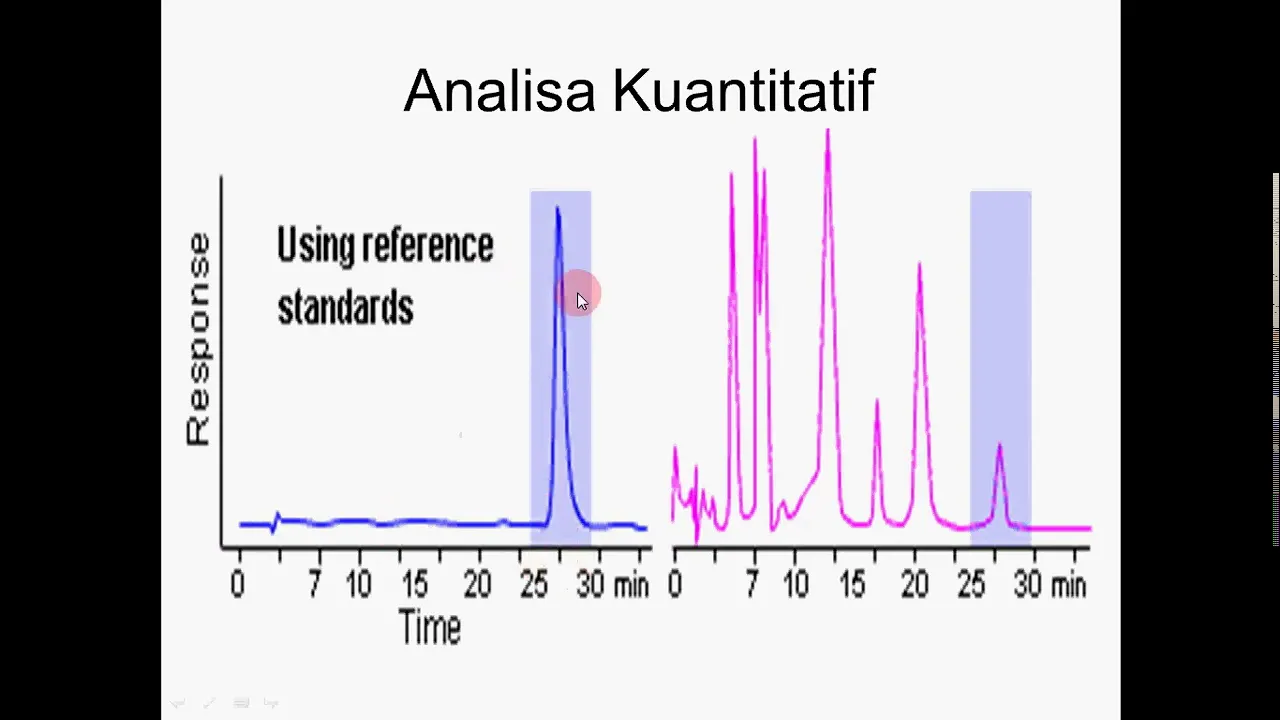
[Music] hey guys Francis here in this video we are going to take a closer look at the electron program of C II and we will be learning some detection methods used in C II by the end of this video we'll be able to read and extract informations of an electron program the actually important aspect of an electoral program the migration time which is the accesses the absorbance which is the y-axis and the peak area or more correctly the corrector peak area first of all let's take a look at the migration time the migration time is the time it takes for a solute to migrate from the point of introduction to the detector knowing the migration time in the line to the detector we can use this information to figure out the migration rate of a solid so recalling what we have learned from high school physics we know that the velocity of a solid is equal to the distance travel divided by the time span so using this simple relationship we can simply calculate the migration rate so the migration rate will be equal to the distant travel which is the length to the detector divided by the time span which is the migration time therefore we can calculate the migration rate using the length to the detector divided by the migration time however take note that the length to the detector is different from the length of the capillary since the detector is on the column this is the type of on column detection now let me know how to calculate the migration rate is any other factors that may affect the migration time that will allow us to make capillary electrophoresis even more efficient so let's pause this video for one minute take a pen and a piece of paper try listing now some possible factors that you think may affect the migration time of a solute in the capillary electrophoresis so two factors that may affect the migration time are the length of the capillary and the voltage of pi the shorter the capillary the shot of the migration time the greater the voltage apply the shot at the migration time so we know that the migration rate the B total is equal to the line to the detector divided by the migration time so we can just simply rearrange this equation then we will get the migration time UV equal to the length to the detector divided by the migration rate and from previous video we know that the total migration rate is equal to the electro-osmotic velocity plus the electro phoretic velocity in the electro-osmotic velocity is equal to the electro osmotic mobility multiplied by the electric field and similarly the electro phoretic velocity is equal to the electro phoretic mobility multiplied by the electric field so we can simplify this into this relationship here and the electric field is equal to the voltage applies over the length of the capillary so it's a reason we know that the total migration rate will be equal to the sum of the electro osmotic mobility and the electro phoretic mobility multiplied by the voltage applied over the length so if we were to sub this equation into the migration time equation we should be able to get this relationship here so the migration time will be equal to the length to the detector divided by the sum of the electro osmotic mobility plus the electrophoretic mobility multiplied by the length of the capillary over the voltage applied so we can see here the migration time is directly proportional to the length of the capillary and this is inversely proportional to the voltage apply therefore to make the electrophoresis more efficient we can simply shorten the length of the capillary and increase the voltage applied across the capillary now that we have learned about the migration time in factors affecting the migration time let's take a look at two other factors they are closely related to the detection method first we have the absorbance on the y axis of this electropherogram the detector we use in this experiment is reza miele to the UV this detector commonly used in HPLC in see a typical pic may have a maximum absorbance of two mini au while in HPLC a typical pic may have a maximum absorbance of about 200 mini au in addition we have the P area or more accurately speaking the correct area which is directly proportional to the concentration of individual Andalite so why do we need to use the correct of the area what is there to correct this is because the pics passing through a C detector do not all pass through at the same velocity the early alluding pigs move through the capillary more rapidly as compared to the later alluding pics the later alluding pigs which are moving more slowly usually appear to have a larger pic area relative to the earlier alluding pigs correct a pig area takes into account of unique migration time and therefore allows a more accurate comparison of the components in the mixture so that's all for today see you guys in the next video bye
Up Next

11:56
Chinese Chemical Element Naming: A Linguistic Analysis
@myaobyclepiej
551.8K views•2025-05-08

83:56
Biocatalysis and Catalysis in Islatravir Synthesis | Merck Webinar
@SCIwheresciencemeetsbusiness
675 views•2020-10-08
10:06
1H NMR: Determining Number of Peaks from Structure
@MSJChem
59.2K views•2017-04-06

17:31
Edible Water Bottles: A DIY Guide to Sodium Alginate Spherification
@ryan
10.5M views•2019-06-21
Related Study Plans & Knowledge Roadmaps
Structured learning paths in Chemistry
chemistry
Nuclear Chemistry: Decay, Meds & Fuel Cycle
01Introduction to Nuclear Structure and Radioactivity
02Decay Dynamics and Kinetics
03Radiation Interaction and Detection
+ 2 more learning modules
24h5 modules
Explore Roadmap
chemistry
Supramolecular Chemistry: Forces & Machines
01Foundations of Chemical Bonding and Intermolecular Forces
02Introduction to Host-Guest Chemistry
03Thermodynamics and Dynamics of Self-Assembly
+ 2 more learning modules
16h5 modules
Explore Roadmap
chemistry
Photochemistry: Excited States & Reactions
01Foundations of Light-Matter Interactions
02Molecular Orbitals and Electronic States
03Photophysical Processes and Jablonski Diagrams
+ 2 more learning modules
18h5 modules
Explore Roadmap
chemistry
Coordination Chemistry: Bonding & Properties
01Introduction to Transition Metals and Ligands
02Crystal Field Theory (CFT) and Geometry
03Magnetic Behavior and Spin States
+ 2 more learning modules
14h5 modules
Explore Roadmap