



















This video introduces a threat-based assessment framework for riparian ecosystems in sagebrush environments, developed by the SageShare Partnership (USDA ARS and Oregon State University Extension Service). The framework uses a simplified '60-mile-an-hour' approach focusing on two primary attributes: channel integrity (access to floodplain and adequate water table ≤30cm depth) and native stabilizing riparian vegetation (woody and herbaceous species). The assessment classifies riparian systems into five eco-states: functional, recovering functional, channel impaired, vegetation impaired, and degraded. This tiered approach is designed to help land managers efficiently assess and communicate riparian conditions across large spatial scales, serving as a communication tool rather than a replacement for detailed protocols.
Managing Flowing Waters in PNW Sagebrush Ecosystems
Added:Hi, I'm Chad Boyd with the USDA Agricultural Research Service, and thanks for tuning in.
Over the last several years, a collaboration of managers and scientists based throughout eastern Oregon known as the SageShare Partnership, developed a threat-based assessment model for riparian ecosystems. Riparian systems are complex, and to assess them thoroughly often requires a full team of specialists. The amount of resources and expertise required to use existing assessment methodologies can create a bottleneck in the management process because land managers simply don't have the capacity and or resources to perform these intensive assessments at large scales that management is often needed.
There has been a need amongst land managers for an assessment model for these mesic systems that is less resource intensive while still providing the necessary data to inform management decisions.
A Managers Guide for Understanding and Managing Flowing Waters in the Sagebrush Ecosystems of the Pacific Northwest was developed to address this need.
This video will give an overview of this management guide. I'll explain how we approach the development of this assessment method, who can benefit from it and where it applies.
After that, I'll send it over to my colleagues, Dustin Johnson and Vanessa Schroeder with Oregon State University Extension Service to discuss relevant ecology and common risk factors.
Lastly, we will introduce the five eco states that this assessment uses to classify riparian systems. Discuss visual indicators that help in the classification process and go over the concept of apparent trend. so let's dive right in.
This assessment model is meant to balance efficiency with detail and does this by taking what we call a 60 mile an hour approach to threat-based management to understand the concept of a 60 mile an hour approach. Imagine we're slowly walking along a stream.
What do you see? What are the types of things that we notice? Maybe some vibrant algae, sedges or rushes in flower, or maybe we see some tadpoles in a crawdad. Now let's hit the gas. What do we see? We see more and more coarse details as we get faster and faster.
for example, we might see the color shift from riparian obligate vegetation like sedges and rushes to the uplands and grasses and shrubs. We might see a creek that's confined alongside a road enter an open valley where it has space to meander. Our perspective broadens when we are assessing at highway speeds, and those landscape scale variations are the types of things that we can manage for at really large spatial scales. Now, how do we assess an ecosystem at 60 miles an hour Instead of focusing on all the small details of these complex systems, we focus on the primary system attributes that support ecological function.
We can then categorize systems by the presence and absence of threats to these attributes. This is why we call it a threat-based approach. For example, in this model for riparian systems, the key attributes that support ecological function are channel integrity and stabilizing native riparian vegetation. we'll go deeper into what we define as ecological function and the specifics of the five eco state classifications within this model later.
But what we end up with is a sequence of eco states that vary from functional, where neither attribute has threats being expressed to degraded, where threats are expressed to both attributes.
We recognize that threat based models don't explain all of the variability within any given system. But as Dustin Johnson likes to say, if you're only explaining 50% of the variability, but that 50% is 90% of what you can manage for at large spatial scales, then you're on to something. Now, this may sound confusing at first, but we are trying to simplify very complex systems. And the idea here is to kind of search for elegance. And when I say elegance, I mean the union of power and simplicity, for example, E equals M C squared, three letters, an equal sign and a superscript that explain the potential energy content of all matter in the known universe.
Now, I'm not going to say we hit that mark with this assessment protocol, but that's the direction that we're aiming in, This assessment model is not prescriptive and it does not replace other more in-depth protocols out there that are it is designed instead to be a communication and thinking tool to help diverse audiences get on the same page when trying to understand and communicate what they observe in riparian systems.
It is designed to be integrated with existing protocols wherever possible and to serve as an initial assessment that can help prioritize areas that require more investigation.
we put a lot of thought into who we wanted this guide to benefit and to do this, we divided potential audiences into three tiers that are based on knowledge of riparian systems.
Tier one consist of folks who are interested in riparian areas, or maybe they're concerned about riparian areas, but they really don't know where to start in terms of how to think about riparian ecology and management. Tier two folks know what's generally right and what's generally wrong with the plant community, and maybe you have some idea of where we need to go from a management standpoint to fix things that are wrong or to maintain things that are right.
Tier three folks are the experts. These people know how to do complex riparian prescriptions involving a lot of money, people and equipment. Although this guide can benefit communication between practitioners within all three tiers, it was specifically designed to help get Tier one folks solidly within Tier two. This assessment model was developed for perennial and intermittent stream systems with permanent or semi-permanent flows.
Perennial streams flow continuously throughout the year, though their water levels usually fluctuate in response to season, precipitation and drought. Intermittent streams flow only part of the year when they receive water from seasonal springs or from a surface water source such as melting snow. Perennial and intermittent streams typically have visible characteristics that reflect the permanent influence of water, such as well-defined channels with banks and floodplains, and/or the presence of riparian vegetation.
With that said, these characteristics may be less obvious or less developed in intermittent systems, and the riparian vegetation community will vary based on the consistency and quantity of water in the system. If intermittent streams are assessed during seasons when water is absent, users of this tool may need to rely on the land managers knowledge, while also looking for clues that water does in fact flow intermittently in the channel.
ultimately application of this assessment is more straightforward with perennial streams, while additional consideration and documentation may be required to interpret the condition and potential of intermittent streams, This model is most applicable to low and moderate gradient streams and rivers with streambeds composed mostly of gravel, sand and fine sediment, which represents many of the streams systems in the sagebrush ecosystems of the northern Great Basin. It's important to note that this framework is less applicable to steep high energy streams, with streambeds composed of large cobbles, boulders or bedrock in confined mountain settings. So, before we dig into the nuts and bolts of the assessment model, I think it can be helpful to discuss the attributes of a functional stream system. And here we're looking at a depiction of an idealized stream showing examples of key features such as beaver dams, riparian vegetation establishing on gently sloped point bars, natural erosion occurring on the outside bends of stream meanders, evidence of bank overflow as shown by flow debris captured on the upstream side of trees and shrubs and a water table throughout the floodplain that is 30 centimeters or less and therefore capable of sustaining native riparian vegetation.
Notice that the upland vegetation typically occurs outside of the floodplain and that the stream meanders through the entire width of the floodplain. Additional components of a functional stream system often include secondary channels, pools that are deeper than the rest of the channel and riffles, where more shallow water flows over the stream substrate.
We define ecological function as the degree to which a stream system can regularly access its floodplain. Has a water table that is adequate to support native riparian vegetation across much of its floodplain and has sufficient native stabilizing vegetation to resist channel degradation. As mentioned earlier, this assessment relies on two primary attributes that support ecological function.
The first involves looking at the channel integrity and determining if the stream has access to its floodplain and very importantly, if the adjacent floodplain has an adequate water table for sustaining native riparian vegetation. The second involves looking at the vegetation community and determining if it has sufficient native riparian vegetation to maintain stream bank stability and channel integrity. The presence of sufficient native stabilizing vegetation and an unimpaired channel are the backbone of the system's ability to dissipate stream energy, capture sediment and maintain good water quality.
These functional attributes affect nearly all management uses and values, including habitat for fish and wildlife species, forage production and reduced erosion during high flow events.
When a stream possesses these features, it is resilient to fluctuation in sediment and water supplied by the watershed. We consider these functions to be the basic ecological processes that in turn can support the species-specific habitat requirements.
The foster plant and wildlife biodiversity. Therefore, our assessment approach focuses on the threats to these primary attributes. So, since attribute one is channels integrity, the associated threat is channel impairment While attribute two is native stabilizing riparian vegetation and its associated threat is lack of native stabilizing vegetation.
These two threats are interrelated. If a stream lacks stabilizing vegetation, the stream banks are often left unprotected and exposed to excessive erosion, which usually leads to an impaired channel. Once the channel starts degrading, the floodplain is more difficult to access and the water table starts to lower. Without an adequate water table, the roots of riparian plants cannot access sufficient water. So we start to lose that crucial vegetation, which then leads back to erosion and the cycle continues.
In resilient systems without incision, the active floodplain is fully inundated regularly, typically, this occurs annually during peak runoff events, but may occur more frequently throughout the year, when flows are high. The floodplain may not be inundated during consecutive drought years. It is important to note that floodplain inundation may occur via over bank flows or through elevated water table saturation.
When a river has access to its floodplain, it's able to dissipate energy and reduce the impact of high velocity flows to channel integrity. When a river is confined within an incised channel, water has only one direction to go, which increases flow velocity.
High velocity flows have the potential to move larger material and a lot more water, which often leads to further incision. Beyond directly observing a stream system during a flood event, there are a variety of useful visual cues that can help when assessing whether a stream can regularly access its flood We will discuss those amongst other visual indicators later in this video. Headcuts are a major cause of channel degradation and contribute to the inability of a stream to access its floodplain.
A Headcut is the point at which a stream is transitioning between more deeply incised and less incised portions of a stream. Headcuts are the upstream migration of an incised channel with the head at the upstream side and the cut at the point of erosion or cutting.
Headcuts can result when the stream channel is incised by flood events, culvert failures, channelization, improper road drainage or from decreased vegetation cover.
Once a headcut develops, it will migrate upstream, eroding the stream vertically until it reaches a non-erodible surface, resulting in an incised channel downstream.
The net effect of channel incision resulting from a migrating headcut is a lowered water table.
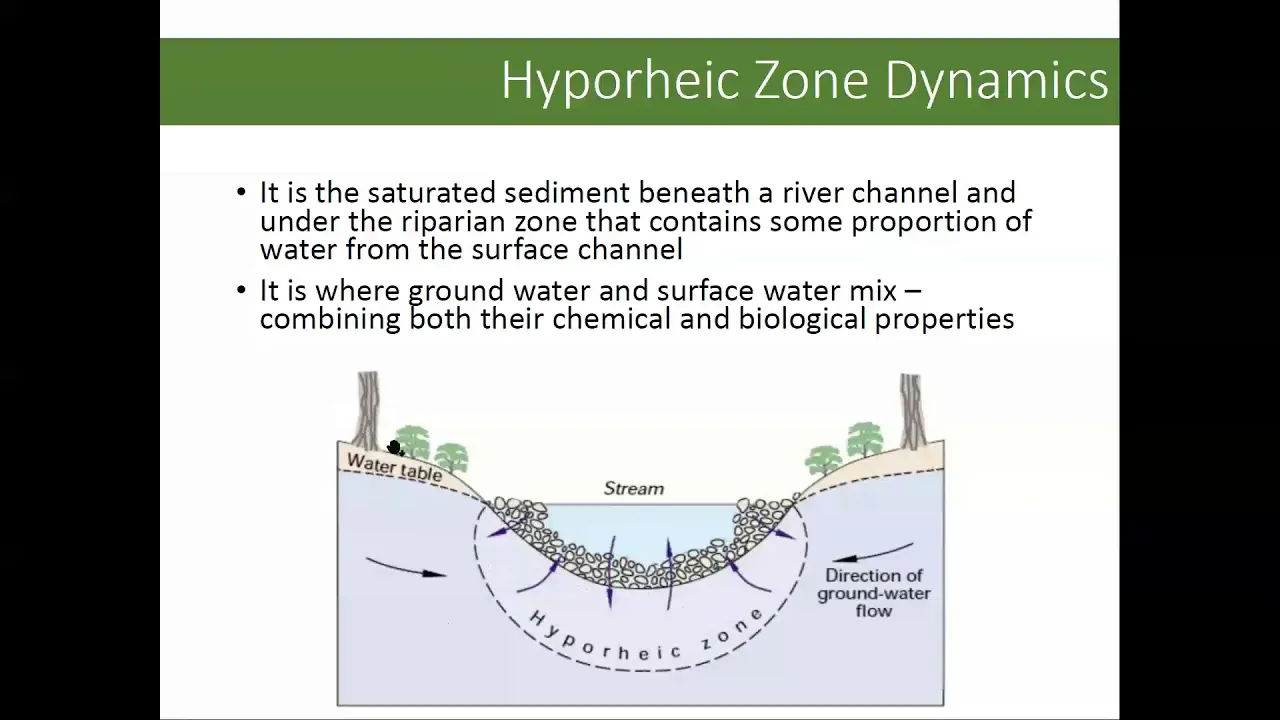
The water table is the boundary between the unsaturated zone and the saturated zone in the ground beneath our feet. Below the water table, groundwater completely fills any spaces between sediments and rocks. Though the depth to the water table may fluctuate throughout the year depending on season. A functioning perennial stream features a water table that is typically within 30 centimeters or about a foot of the soil surface during the growing season. This depth is crucial to sustaining key native riparian herbaceous plant species such as sedges and rushes.
Remember, this approach is geared to tier one folks becoming tier two. We are not training botanists with this guide and fortunately you don't need to be one to assess ecological function within this assessment model. This model's approach to assessing vegetation condition relies on having a basic understanding of how different plants function. Essentially, we want you to think about plants and broad brush strokes, and to do this, we ve broken down the various plants you may encounter and to plant functional groups based on how well they function in terms of holding stream banks together. Is it native woody riparian vegetation or is it native herbaceous riparian vegetation? Maybe it's upland vegetation, or is it what we refer to as pseudo riparian vegetation? Ultimately, we're most interested in vegetation community s ability to stabilize stream banks. The woody riparian functional group consists of native woody vegetation that need to keep their feet wet, although there are others willows, alders and cottonwoods are the most common within this group.
Not all stream systems have the capacity to support willows or other woody riparian vegetation. There are some sites that are functioning just fine without willows, because willows don't grow everywhere. They need oxygenated soil and do best with coarse substrates such as sand, gravel and cobble and certain areas where the substrate consists of fine silt and clays, and the stream gradient is low, soil tends to contain less oxygen and plants within this functional group are not expected to occur. A good indicator to use when deciding whether woody species should be present is to assess if you can hear the stream. Streams that you can hear usually can support woodies because they tend to have a higher gradient and coarser substrates, suggesting enough flow and oxygen to support woody species such as willows.
Our next functional group is native herbaceous riparian vegetation. This is essentially shorthand for sedges and rushes, but includes a variety of forbs, grasses, sedges and rushes. A botanist might rush and tell us that there are upland sedges, which is true, however, the vast majority of sedges and rushes can only grow within riparian systems. Species within this plant functional group can vary considerably in their tolerance of wet and dry conditions.
Some of the most important plant species to key in on within this group include those that are riparian obligates such as Nebraska sedge. Since it requires a year-round water table within approximately 30 centimeters of the soil surface. Therefore, the presence of Nebraska sedge is a solid, key indicator of an adequate water table. Conversely, Baltic Brush is a bit more facultative. It has a broader tolerance for dry conditions.
The manager's guide has an appendix detailing some of the most common herbaceous species along the riparian obligate to facultative spectrum, which can be helpful to determining depth to water table. I want to highlight why this is such an important functional group and take us underground for a minute. In this idealized, cartoony example, we can compare the root systems of upland and riparian vegetation. For the upland plants on the right there are wonderful deep root systems that can access water deep in the soil, but they're not intertwined, and we have a lot of background and space between plants.
On the left we see the root systems of native herbaceous riparian plant communities. These species are often rhizomatous and have really dense root mats which offer greater soil stabilizing properties. Deeper rooted species typically provide more stability than shallower rooted species, which demonstrates the importance of riparian woodies to bank stability.
It is important to not consider native riparian woody and herbaceous vegetation in isolation.
When present in sufficient abundance, both are critical for maintaining stream bank stability during high energy flows. A helpful metaphor is to think of the herbaceous riparian roots as cement, while the woody riparian roots serve as rebar that in combination can hold stream banks together during high energy flow events. The deep penetrating roots provide the extra structure needed to absorb and dissipate energy. When it comes to native riparian species woody and herbaceous are just better together. Pseudo riparian vegetation includes invaders of riparian systems such as Reed canary grass, Tamarisk and Russian olive. Despite the fact that these species commonly occur next to streams and do offer decent stream bank stabilizing properties, they are not riparian obligate species and possess a broad tolerance for dry conditions. As such, they can often mask a lowered water table, lack of floodplain access and channel impairment. The propensity to mask channel impairment is especially true for Reed canary grass, which is an aggressive introduced species of grass commonly found along streams in the northern Great Basin.
Reed canary grass begins growth early in the spring and then grows like crazy sometimes to heights of six feet or more and tends to form dense monocultures. Its tolerance of both dry and wet environments allow it to establish and persistent in conditions where many native riparian vegetation species can not. While Reed canary grass has a relatively high stream bank stability rating and can certainly function as stabilizing riparian vegetation, its persistence and propensity to form dense monocultures often constrains the stream to a less desired state by impeding restoration efforts and the normal stream recovery process. The final plant functional group to consider when assessing riparian systems includes species that are normally found in the uplands. Upland species growing where we would anticipate seeing riparian obligate plants means that the riparian area is essentially functioning as an upland. In other words, seeing upland species in what we would expect to be the streams floodplain is not a good sign, and indicates that the channel has been impaired to the point where the water table has significantly lowered and regular access to the floodplain no longer exists. So, what are risk factors and what's the difference between a risk factor and a threat? The difference is in the way that we define them.
A risk factor is an event, an action, or a natural phenomenon that may trigger a variety of different ecological processes that can potentially lead to the future expression of a threat.
The management guide has a more comprehensive list of risk factors and associated processes.
But to make this more tangible, I'm going to talk through several examples.
The first risk factor I'll talk about is channelization. This is the act of straightening, redirecting or otherwise confining a stream within an artificially modified reinforced or constructed channel. This is often done to protect roads. Think about riprap or berms for example. Channelization reduces stream complexity and natural friction points. When the stream is straightened, it flows faster, leading to more erosion and often producing head cuts upstream of the channelized areas. This increases channel depth and further restricts access to the floodplain. Reaches downstream from the channelized area, may also be impacted by the resulting high energy flows and excessive deposition of sediment.
These processes can lead to incision and a lowered water table. And finally, the expression of our threats a degraded channel and or a lack of native stabilizing vegetation.
When channelizing a stream, you're also just inherently replacing vegetation with riprap, which can exacerbate loss of floodplain connectivity. It's also important to note potential risk factors away from the stream as well, such as the condition of the uplands and the surrounding watershed. Degradation of native vegetation communities in the uplands can alter the soil moisture regimes and available water to the stream. This can occur from excessive juniper expansion, which leads to depleted under stories and increased bare ground, or from the conversion of native sagebrush bunch grass communities to invasive annual grasses.
Loss of the upland understory can reduce soil absorption and increase erosion. Overland flow and the flashiness of water and sediment moving into streams from the uplands.
This risk factor is a big concern because excessive runoff can lead to increased flow velocity and debris within a stream, which can also result in channel erosion, headcuts and the expression of an impaired channel, lowering the water table and reducing floodplain connectivity. Long periods of drought can cause mortality of stabilizing riparian vegetation as the water table decreases. Drought, when combined with dewatering from irrigation can compound the process. The threat expressed is a lack of native stabilizing riparian vegetation. The threats then perpetuate each other, and lack of vegetation can ultimately lead to increased erosion and channel impairment and decrease the floodplain connectivity.
Unmanaged or improperly managed grazing is a risk factor that can lead to the expression of one or both threats. Overgrazing or over browsing by either cattle or native ungulates can directly remove stabilizing riparian vegetation from stream banks. If a lot of cattle are left for too long in riparian pastures, channel integrity can be threatened by processes such as hoof shear.
The last risk factor we'll cover in this video is road development. Roads often function as extensions of the stream network, as roads can act like ephemeral channels that rapidly deliver water to the stream system. Roads are largely impermeable, so they capture and concentrate precipitation runoff, delivering it rapidly to a stream, often increasing erosion to stream channels and causing headcuts. Also, when roads are built, adjacent streams are often straightened to prevent the stream from meandering into the road. A straightened channel has a tougher time regulating flow velocity, and with increased flow velocity comes erosion, incision and ultimately an impaired channel. And at the cost of sounding like a broken record, the cycle continues, lowered water tables, decreased floodplain connectivity, and ultimately a loss of stabilizing vegetation. By this point, I'm sure you've heard enough about riparian ecology, threats and risk factors. So, let's dive into the assessment tool. The assessment tool that we're highlighting categorizes stream condition into five ecological states, including functional, recovering functional, channel impaired, vegetation impaired and degraded. The decision tree on the screen shows the basic inquiry process involved in the assessment. It asks a short series of yes/no questions about the presence of threats to our two primary ecological attributes, including stabilizing native riparian vegetation and channel integrity.
So first, is there sufficient stabilizing native riparian vegetation? Next, is there evidence of channel impairment? And to throw a wrench in the works, does the channel occur within an inset floodplain? This last question may look unfamiliar because we haven't gone over what an inset floodplain is at great lengths like we have with the other two questions. You will know how to answer this question soon enough. But it brings me to an important point. It's important to note that each ecological state within this assessment represents a point in time status of a stream across an infinite continuum of possible stream conditions. Streams will rarely fit perfectly into the eco states that we define here,because they are usually somewhere along the spectrum between different states. Also, streams change through time and a system which may have been heavily degraded at one point, may have recovered through conservation measures. These eco states are meant to serve as mental placeholders. We found that using these major categories for mental placeholders, for riparian conditions is helpful for improving the efficiency of assessments and because a lot of information about stream conditions is contained within each ecological state. We found that using these stream assessment categories also improves the efficiency and effectiveness of communication about riparian conditions. As Chad mentioned earlier, this assessment is designed to be a communication and thinking tool to help diverse audiences get on the same page when trying to understand and communicate what they observe in riparian systems. So, without further ado, let's take a closer look at the attributes of each ecological state.
A stream in the functional state has unrestricted access to the full extent of its floodplain from valley wall to valley wall. At base flow when the stream is sourced solely from stored groundwater.
The water table adequately supports native riparian vegetation beyond the stream banks.
There should be no headcuts present. The banks of a functional stream are dominated by native stabilizing riparian species and/or anchored rock. Multiple age classes of stabilizing native riparian vegetation are present for multiple species. If the site potential is appropriate, a functional stream would likely have multiple age classes of native woody riparian vegetation.
Upland species are not encroaching in the floodplain. In the functional state, the channel should have space to move freely, demonstrating animosity, unless a channel is narrow due to naturally restrictive features such as canyon walls. Lastly, a functional stream does not occur within an inset floodplain that is bounded by broad, flat upland terraces.
This is in contrast to the recovering functional state. This state is the new normal after historic degradation has occurred. The stream has access to a new inset floodplain that is different from and narrower than the historic floodplain that now presents as flat upland terraces bounding the stream system. There are sinuosity present, formation of point bars, no active down cutting and multiple age classes of native stabilizing riparian vegetation are present including native woody species if the system can support them. There should not be upland species presence in the new floodplain, but they will be present on the historic floodplain on the terraces. Through time and continued management this stream should continue to increase the size of its floodplain, though it is highly unlikely to reach the extent of its historic floodplain without major and intensive restoration efforts. The channel impaired state has obvious signs of channel impairment or we have vegetation clues that an observer can use to determine that the water table is not adequate. In this state active channel impairment is usually apparent through either direct evidence of incision, such as active headcuts, signs of excessive erosion, steep stream banks and/or more subtle clues provided by the vegetation. Vegetation Clues that could signal channel impairment and a lowered water table include signs of stress in native riparian vegetation or the confinement of riparian vegetation to a narrow strip directly adjacent to the channel's edge. Another solid vegetation indicator of channel impairment is encroachment of upland vegetation into the riparian zone. The vegetation impaired state reflects stream reaches that are not actively incising and have an adequate water table but lacks sufficient native stabilizing riparian plant species. Vegetation impaired streams may have native stabilizing riparian vegetation in low densities, but bare ground litter, upland vegetation or dry tolerant species are more prominent within the zone of riparian vegetation.
A vegetation impaired stream may also lack woody riparian vegetation despite having the potential in the system to support these species. In a third scenario, pseudo riparian species like Reed canary grass may dominate to the extent that native riparian vegetation is excluded.
Though these streams currently feature an unimpaired channel, if they lack stabilizing vegetation, they are at high risk of experiencing channel incision or excessive widening during a high flow event. Streams within the degraded state have impaired channels and lack sufficient native stabilizing riparian vegetation. They are deeply incised and have steep banks that preclude floodplain access. The water table at base flow is typically insufficient to sustain native riparian species and upland vegetation is encroaching into the floodplain. The stream is restricted from accessing the floodplain due to down cutting. Pseudo riparian vegetation may be present or prominent. There may be some mature native woody vegetation present, but seedlings and saplings are largely absent beyond the direct margins of the stream. There's likely evidence of active erosion, such as sloughing of banks and of past bank failures where vegetation did not prevent erosion.
Now that we ve provided an overview of each of the five states, we're going to walk you through the decision tree and discuss visual indicators that can help in the assessment process.
Up Next

Live Staking for Stream Bank Restoration: A How-To Guide
@psuextension
10.2K views•2016-08-24

Life in Biosphere 2: Sustainable Ecosystems & Human Survival
@TED
334.9K views•2009-06-16

Microplastics Everywhere: How Plastic Impacts Our Lives
@TEDx
100.9K views•2018-05-08
Ice Stupa Artificial Glaciers: Solving Ladakh's Water Crisis
@SonamWangchuk66
3.2M views•2015-05-03
Related Study Plans & Knowledge Roadmaps
Structured learning paths in Environmental Science