


























Growth charts are valuable tools for tracking children's development by comparing their measurements (weight, height, BMI) to population percentiles, but they should not be used as the sole basis for clinical decisions or labeling children; BMI numbers and categories for adults do not apply to children, and growth charts are best used to identify red flags that warrant further investigation rather than making definitive health judgments, as many factors beyond parental control—including genetics, medical conditions, and socioeconomic status—affect a child's weight and growth trajectory.
Understanding Child Growth Charts: BMI, Percentiles, and Health
Added:Basic definition and calculation of Body Mass Index (BMI) in adults.
Fundamental statistical concepts of percentiles, distribution curves, and population averages.
General patterns of human physical development and growth spurts from infancy through adolescence.
The difference between screening tools (identifying potential risks) and diagnostic tools (confirming a condition).
Clinical assessment of pediatric growth deviations, such as 'failure to thrive' or sudden percentile shifts.
The impact of genetics, dietary habits, and physical activity on a child's developmental trajectory.
Advanced pediatric body composition metrics, including skinfold measurements and waist-to-height ratios.
How to interpret pediatric growth charts longitudinally over time rather than relying on single static data points.
1.7K views19likes9:58Original Release: 2022-01-14
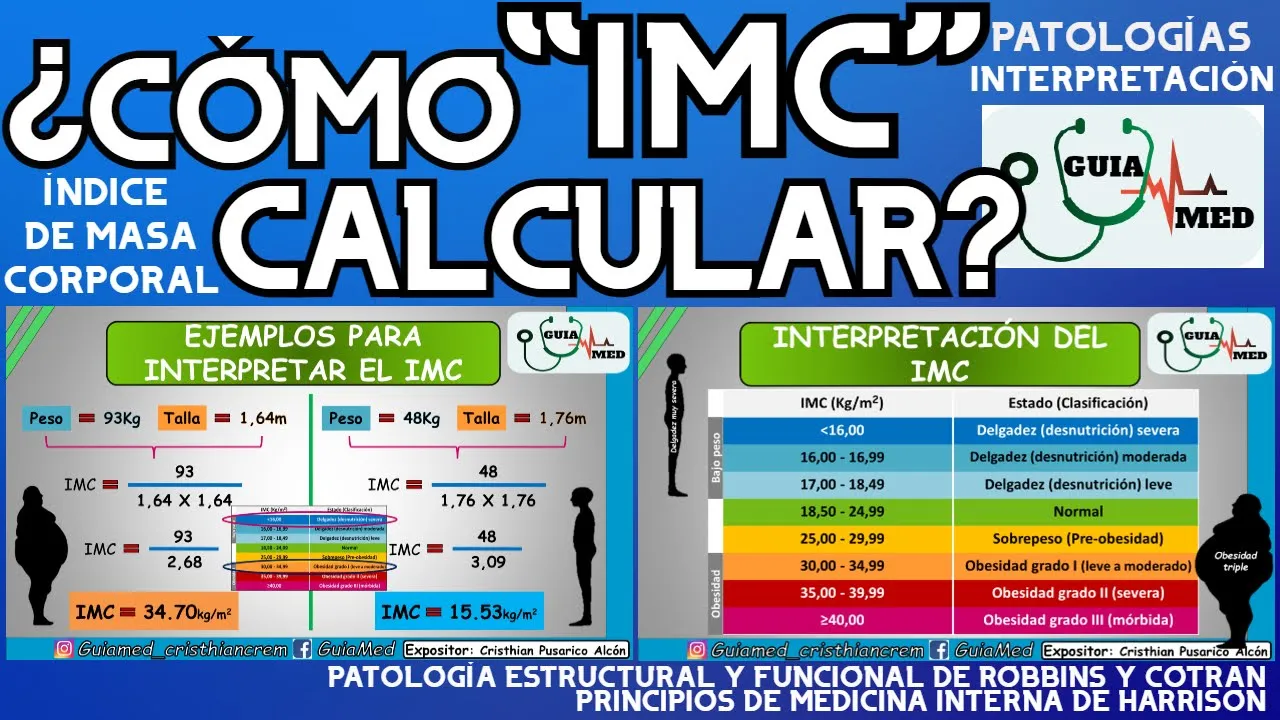
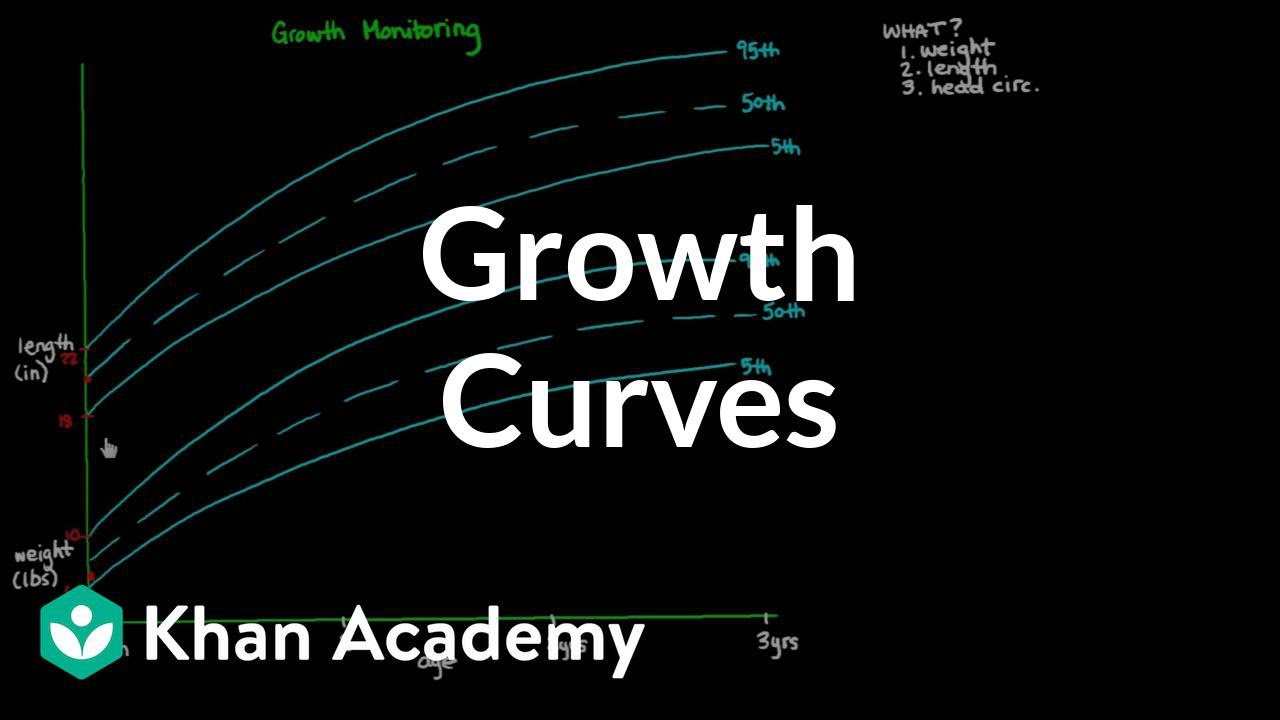
so in this video we are going to be chatting about growth charts we're going to talk about what is a growth chart how they were developed like the who versus the cdc growth charts how your providers use them in clinical practice and basically what they mean to you as a parent what is a growth chart well here's what they look like um we have different growth charts for different ages so we have one set of growth chart for zero to two years and then we have another set of growth charts for two to twenty years so growth charts look at your child's weight or their length or their height or their head circumference according to their age and they also look at your child's weight according to their height or their length and so there's a difference there so one we're comparing things to other kids their age which is like the wait for age height for age or head circumference for age and then the weight for length or the bmi for age for or bmi for age for any kids above two years old don't just look at how much they weigh for compared to other kids their age or how tall they are compared to other kids their age those ones look at the proportionality so how much do they weigh compared to how tall they are so if we're just looking at like weight for age or we're just looking at a child's weight on their growth chart it doesn't take into account how tall they are so it's really really important to not put too much clout into just like a weight growth chart because it doesn't really tell us a bunch in addition growth charts also don't tell us a bunch if it's just one point on the growth chart what your providers will use is a trend so a history we want to see how your child is changing over time and are there any red flags that might make us concerned for underlying medical conditions so that's how your providers should be using the growth charts um so the uh there's two sets of growth charts we have one from the world health organization and one from the cdc so we use the world health organization growth charts which are i'll show you them right here if i can get them so they are this is what they look like one for boys one for girls um and we use these for ages zero to two so providers should always be using the who or the world health organization growth charts for zero to two and we use this versus the cdc data for this age because the who data is more thorough it's from a larger data set and isn't as affected by confounding variables as the cdc data is for this age however cdc charts are used for after two years because we switch to standing for length so after your child is two we're gonna measure their height standing versus laying down on the length board or like an exam table and then after two years the quality of the world health organization data is really similar to the quality of the cdc data and the cdc data extends to 20 years whereas the world health organization only extends to five years so that's why we use the world health organization or the who grow charts for zero to two and we use the cbc growth chart which is what these are right here in my hand for two to twenty so these charts are the body mess index percentiles for age so we have one for boys and one for girls so what do the plots mean like let's say your provider plots your child on the growth chart so what they're going to do for example i'm holding the boys bmi for age growth chart so your provider is going to calculate your child's bmi and they are going to plot it along this line and then they're going to look at how old they are and they're going to find where those points intersect and that's going to tell us your child's bmi percentile so let's say your child is at the 40th percentile for bmi that means out of 100 children they're the 40th in line for bmi so there will be 39 with a lower bmi and there will be 60 with a higher bmi so they're right at the number 40 spot in line that's with the percentile means um so however we um there's a lot of things to consider you know growth charts aren't a bl end all they are just one data point in your child's health so let's talk about this bmi growth chart for a second bmi is in kids is really different from bmi for adults so bmi for adults is just like a simple equation and then we're categorized into categories that like public health professionals use to assess population health which we can make a whole critique on that that'll be in a different video but it is what it is that's what we use right now but numbers are different from kids versus adults what would be classified as like the overweight or obese category and um adults might not be that in kids and vice versa so we expect body fat and muscle to change with age and this is really really normal so that's why we don't just look at the number the bmi number we have to plot it for their age because as you can see bmi changes over time and what is considered in the like average range will change over time as your child grows however bmi or a growth chart is not the number one indicator of health for a child when we look at a growth chart like as a dietitian i always plot my patients on the growth here almost always but that isn't something that i use to make like immediate clinical decisions what that tells me is are there red flags that we need to be looking out for so for example if your child is at a higher bmi and starts to drop over time i might be concerned about like an underlying medical condition or food insecurity or another reason why your child is consuming like less food than they were before or maybe they're still consuming the same amount of food but they're having malabsorption issues and so again that's a that's a red flag for a medical condition so the bmi is a tool to help us discover more about your child it's not like something that we should be using to label a child and we also know that there are other things that are much more indicative of health in a child than just bmi alone like we should really be paying attention to eating behaviors for example those are so important so if you ever go to an appointment with your provider and you talk about bmi but you don't talk about eating behaviors like that's a red flag to me because if a provider is concerned about a high or a low bmi we should be talking about eating behaviors and digging more into that versus just you know like giving a lecture on bmi alum so bmi is a tool we use it in the clinical setting but it's just that it's just a tool it's not a label for your child in addition this is really kind of a rybium i was originally developed as a population level surveillance tool not as a individual clinical decision making tool so kind of keep that in mind however go charts are really important for children because we do want to see them growing along their curve over time so children can be healthy at the high percentiles they can be healthy at the low percentiles they can have medical conditions and be really struggling at the high percentiles they can have medical decision conditions and be really struggling at the low percentiles someone has to be at both ends just because your child is in the third percentile doesn't mean they're unhealthy just because your child is in the 97th percentile doesn't mean they're unhealthy there's lots of things that contribute to weight and bmi in children including nutrition physical activity genetics medical conditions socioeconomic status food accessibility so again grow charts are a single tool there's so much more to your child's health than just their growth chart so i'm going to kind of summarize here so if a child is 85th percentile for height or weight or bmi this means that they're taller or um way more or have a larger small larger bmi than 84 out of 100 children their same age out of a random sample in the u.s population bmi numbers and categories for adults do not apply to kids grow charts can tell dietitians and doctors where to look for more information but they are not a label for your child they're a tool or a flag that tells us where we need to look for or where we need to dig a little bit there's lots of factors that include that in fact impact weight several of which you as a parent have no control over and while growth charts are a useful tool they're only one piece of the puzzle so keep that in mind so that's it for the growth chart video [Music] you
Up Next

111:44
Pediatric vs Adult Anatomical & Physiological Differences | Anesthesia PG Class
@ISANHQ
5.8K views•2024-10-30

48:47
Graphic Medicine: Comics for Collaborative Healthcare Communication
@nationalpatientadvocate
189 views•2023-12-04

10:28
Neuroanatomy: Central and Peripheral Nervous System Divisions Explained
@AKLECTURES
136.2K views•2014-09-20

3:05
Stages of Labor and Vaginal Birth | Childbirth Animation
@nucleusmedicalmedia
52.1M views•2017-08-18
Related Study Plans & Knowledge Roadmaps
Structured learning paths in Medicine
medicine
Abnormal LFTs: Diagnostic Workup & Pathology
01Liver Anatomy and Basic Physiology
02Introduction to Liver Function Tests (LFTs)
03Hepatocellular vs. Cholestatic Patterns
+ 3 more learning modules
12h6 modules
Explore Roadmap
medicine
Analyzing Blood Smears: RBC, WBC & Platelets
01Introduction to Blood Components & Smear Preparation
02Normal Morphology of Blood Cells
03Erythrocyte Pathologies & Morphological Variants
+ 2 more learning modules
12h5 modules
Explore Roadmap
medicine
Mechanical Ventilation: Waveforms & Alarms
01Anatomy and Physiology of Breathing
02Introduction to Mechanical Ventilation & Core Modes
03Ventilator Settings and Waveform Interpretation
+ 2 more learning modules
12h5 modules
Explore Roadmap
medicine
Neuro Exam: Localization & Stroke Syndromes
01Foundations of Neuroanatomy and Vascular Supply
02The Neurological Examination: Step-by-Step
03Principles of Neurological Localization
+ 3 more learning modules
18h6 modules
Explore Roadmap