






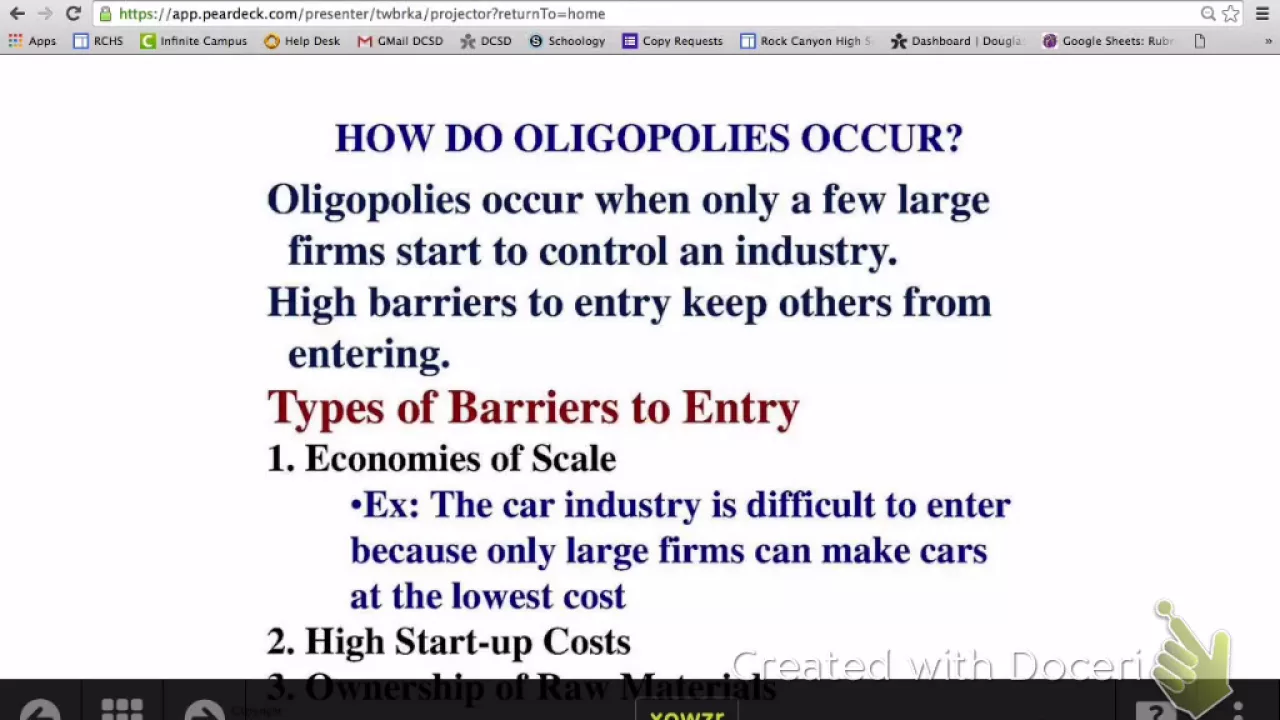
























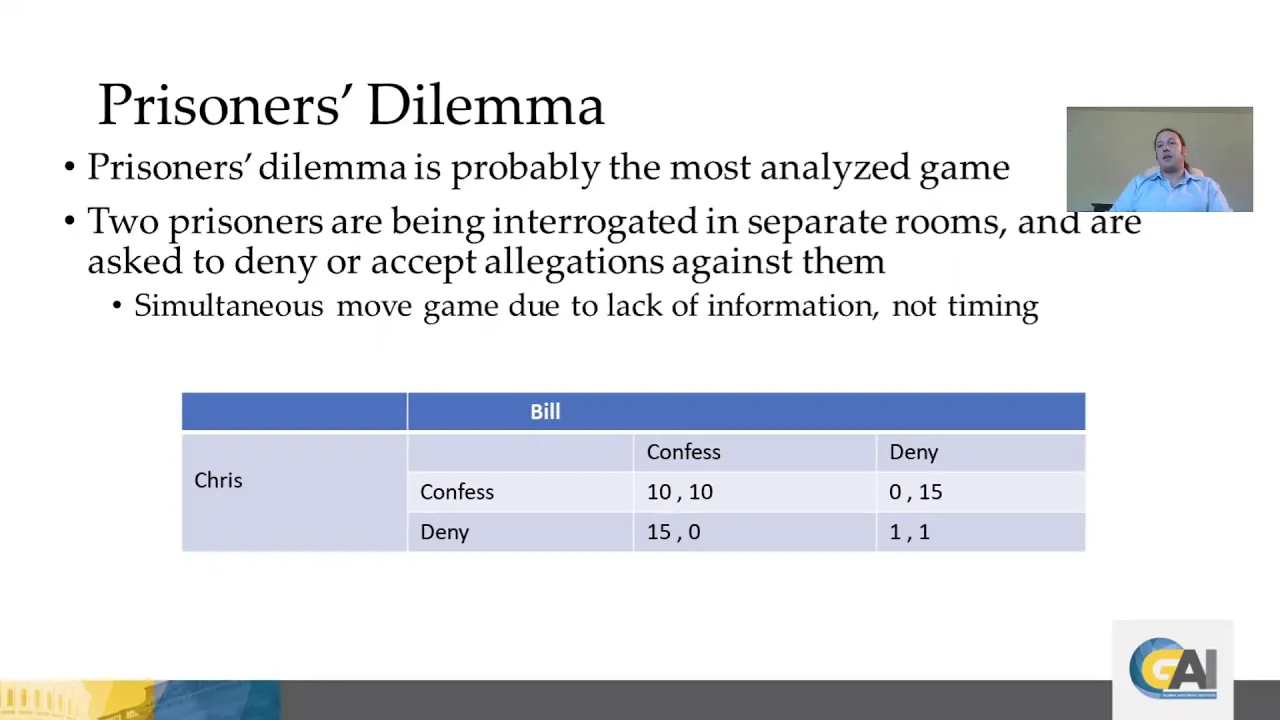

A payoff matrix is a tool used in game theory to analyze strategic interactions between interdependent firms, where each cell displays the profits for each firm based on their strategy choices; the horizontal axis represents the first number (profit of the horizontal firm) and the vertical axis represents the second number (profit of the vertical firm), allowing analysts to evaluate different strategy combinations and determine concepts like dominant strategies, Nash equilibrium, and the prisoner's dilemma.
Game Theory Payoff Matrix Intro | AP Microeconomics
Added:Understanding of Oligopoly and Duopoly market structures, where a small number of firms dominate the market.
The concept of mutual interdependence, meaning one firm's actions directly impact the profit and decisions of rival firms.
Basic profit maximization principles for firms, including total revenue and total cost calculations.
The distinction between cooperative behavior (collusion) and non-cooperative competition in market structures.
Identifying dominant strategies for each player within a payoff matrix.
Locating and defining the Nash Equilibrium, where neither player has an incentive to unilaterally change their strategy.
Analyzing the Prisoner's Dilemma to understand why individual rational choices can lead to cooperative market failures.
Exploring real-world policy applications of game theory, such as antitrust laws, collusive behavior, and strategic advertising.
83.3K views517likes3:35Original Release: 2017-11-15
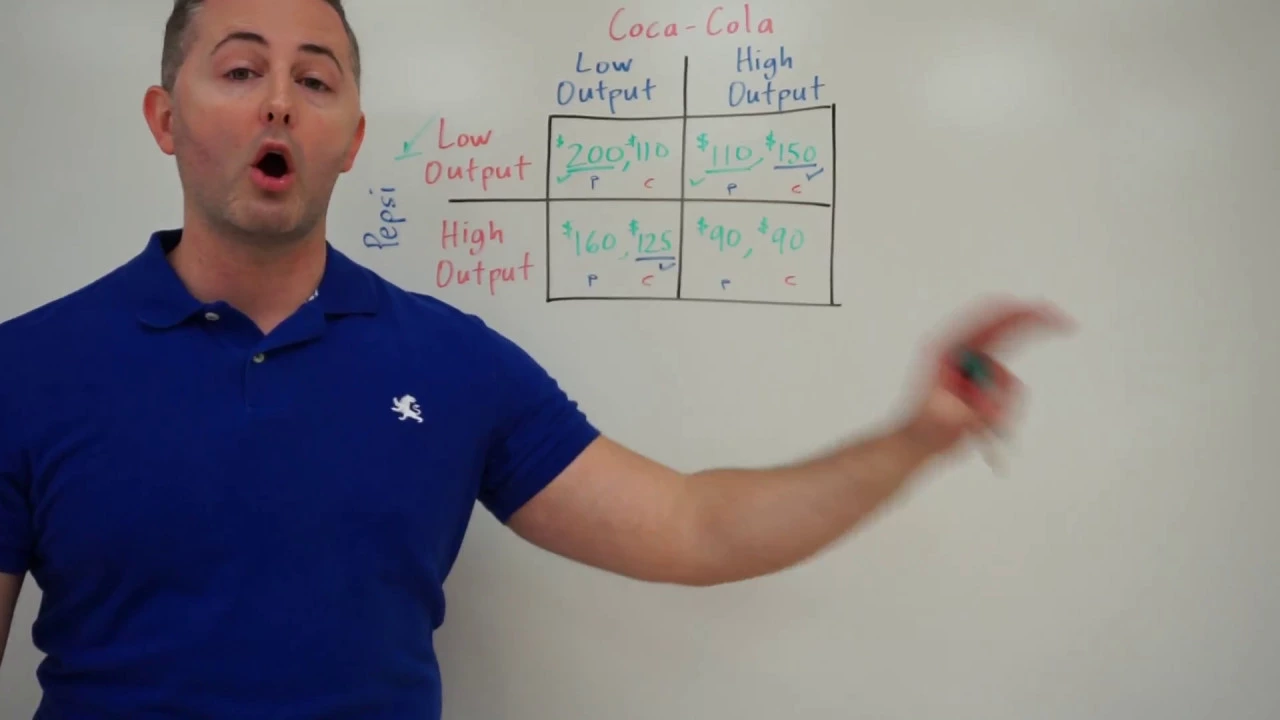
alright guys welcome back this video is an introduction to game theory so you're not really gonna solve this problem just kind of gonna look at exactly what we see here how to read this sorry so first of all this is called a payoff matrix all right now the idea of this payoff matrix is that we have making the assumption this is a duopoly so there's only two companies so in this case we have coca-cola and Pepsi that was going to be our two companies and the idea is that they're competing remember that they are interdependent meaning that the production level so we're talking about they have two options of either producing a low output or a high output and whatever they choose is going to influence the profits of the other so in other words that interdependence showing that their actions affect the other so they're not in this in an isolated way so how do we read these because we have eight numbers here we have four boxes so what exactly are we looking at because again in this video we're not gonna solve this the next video we will done so we're looking here is relatively simple might look a little intimidating but it's not that bad so first of all we see that each of them has the same few options right coke can either have low output or high output Pepsi either low output or high output so what do these numbers represent these represent the profits that each of these firms would make if they choose these two combinations so this quadrant reflects what happens if they both choose a low level of output now the important question is which is which okay so to help us out here I'm gonna put the letter P or the letter C letter P represents a VESA Pepsi that's gonna be our horizontal axis up the letter C for Coca Cola that's our vertical alright so this will apply in every payoff matrix that you do all right this number $200 that is the amount of Pepsi would earn that would be Pepsi's profit if they both choose to do a low level of output so the first number the one on the left that's always going to be the number of the horizontal axis so if that means if we drop down into this box with high output that would be Pepsi with the 160 all right if we move over to the right side perhaps you'd be the first again they're always on the left that's the 110 and Pepsi is the first 90 over here so our horizontal axis is always the first number left to right in the box okay Coca Cola since that's our vertical axis that's always going to be this second number here so again it's pretty simply walk through it we have our coke on the right coke on the right coke on the right and coke you guessed it on the right hand side so this is telling us now we can look looking a pair alright if they both do low outputs Pepsi will earn 200 dollars whereas coke will only earn 110 if Pepsi does high-output and Coke does low this will be the combination perhaps you'll earn 160 Coco are in 125 etc we can do it for all four combinations so we're gonna use this information to then make certain determinations of whether or not these firms have a dominant strategy to find a Nash equilibrium if one exists and also to determine whether or not these companies find themselves in which is known as a prisoner's dilemma okay but that's the basics that's how you're gonna read these always left to right the horizontal axis that's gonna be the one on the left hand side the one on the right hand side is the vertical okay and I think that's about it I can't really think of anything else to say for that so till next time this has been all the money production
Up Next

69:14
Nash Equilibrium: Coordination Games and Bank Runs
@YaleCourses
155.7K views•2008-11-21

5:07
Impact of Yuan in Indo-Russian Trade Amid Sanctions
@WION
261.9K views•2022-07-01
10:33
Behavioral Economics Explained: Rationality, Nudges, and Risk
@crashcourse
1.1M views•2016-03-12

113:18
The Age of Easy Money: Fed & Inflation | Full Documentary
@frontline
21.2M views•2023-03-15
Related Study Plans & Knowledge Roadmaps
Structured learning paths in Economics
economics
Sovereign Debt: Defaults, IMF & Restructuring
01Introduction to Sovereign Debt & Government Bonds
02Debt Sustainability & Credit Ratings
03Anatomy and History of Debt Crises
+ 2 more learning modules
12h5 modules
Explore Roadmap
economics
Market Design: Matching Theory & Gale-Shapley
01Introduction to Market Design and Price-Free Markets
02Two-Sided Matching & The Gale-Shapley Algorithm
03School Choice Systems and Mechanism Design
+ 2 more learning modules
10h5 modules
Explore Roadmap
economics
Impossible Trinity: Forex, Capital & Policy
01Introduction to Monetary Policy and Central Banking
02Exchange Rates and International Capital Flows
03The Mundell-Fleming Model
+ 2 more learning modules
8h5 modules
Explore Roadmap
economics
Healthcare Economics: Market Failures & Systems
01Introduction to Healthcare Markets and Market Failure
02Asymmetric Information and Adverse Selection
03Moral Hazard and Insurance Design
+ 2 more learning modules
12h5 modules
Explore Roadmap