


![🎨Diseño de Sonido - #2: Amplitud [CURSO COMPLETO] - Tutorial Sound Design](https://i.ytimg.com/vi_webp/8i9BWDYOYZI/maxresdefault.webp)





![Alex Harker: Meaningless Numbers? Using Audio Descriptors in a Musical Manner [30.10.2018]](https://i.ytimg.com/vi_webp/Sh7LvH39dsY/maxresdefault.webp)
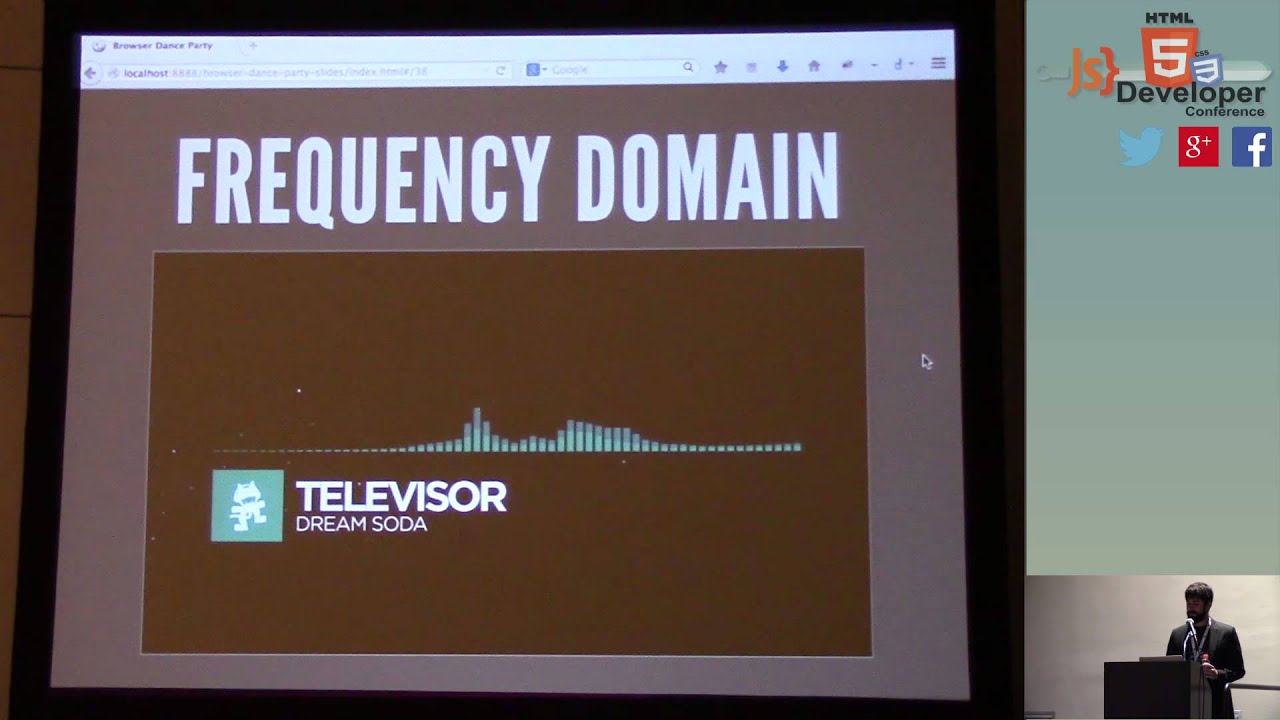






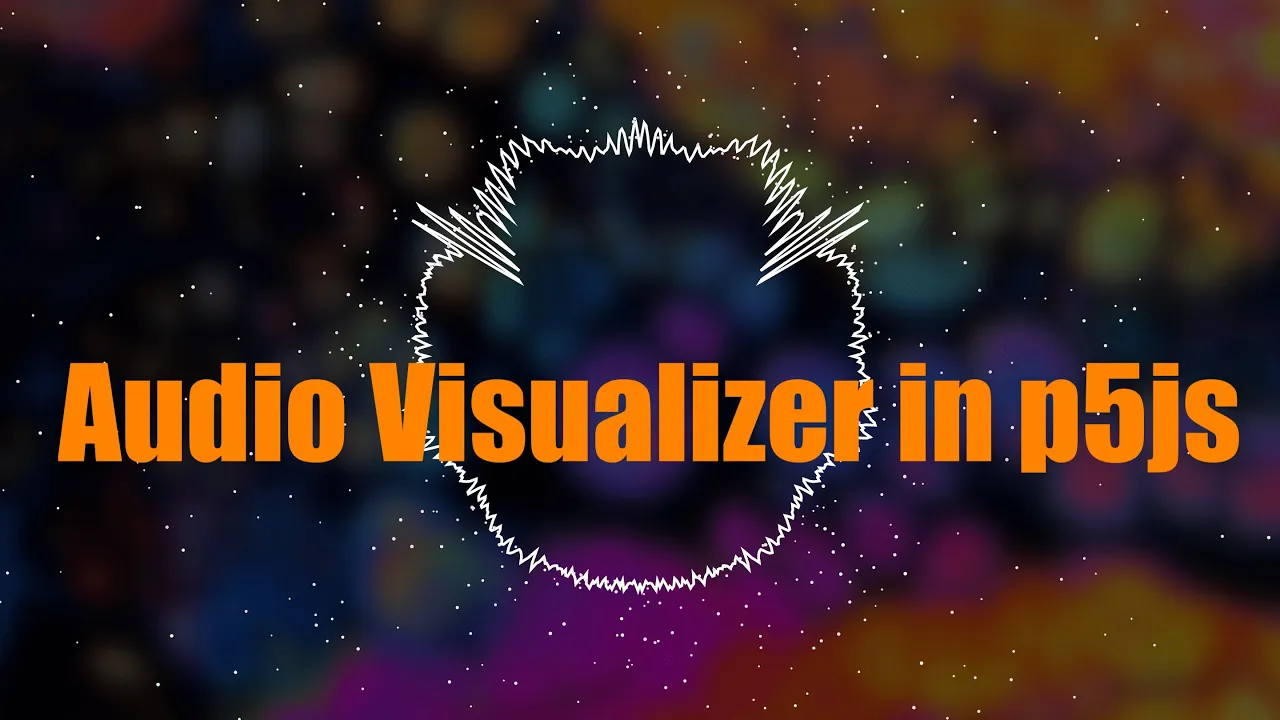
The p5.FFT object in p5.js performs Fast Fourier Transform (FFT) analysis on sound files, converting raw audio data into a spectrum array where each element represents the amplitude at a specific frequency level; this enables visualization of sound frequencies through graphic equalizers or circular displays, with the ability to adjust parameters like smoothing and bin count to control the resolution and appearance of the frequency analysis.
FFT Sound Visualization with p5.js: Graphic Equalizer Tutorial
Added:Basic JavaScript and p5.js concepts, including the setup and draw loops, variables, arrays, and basic shape rendering functions.
Fundamentals of digital audio, particularly the distinction between amplitude (volume/time domain) and frequency (pitch/frequency domain).
Conceptual understanding of the Fast Fourier Transform (FFT) and how it decomposes an audio signal into its individual frequency components.
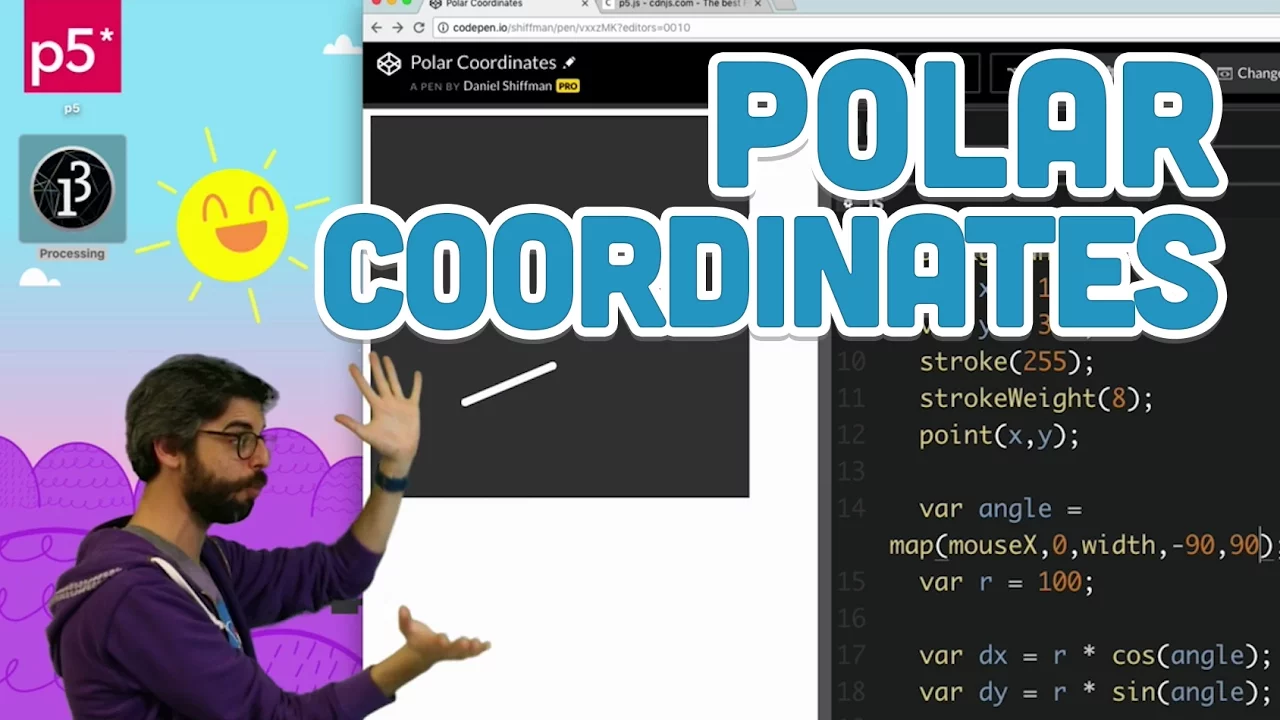
Mathematical coordinates and basic trigonometry in programming, specifically converting polar coordinates (radius, angle) to Cartesian coordinates (X, Y) for circular drawings.
Implementing advanced audio analysis techniques, such as beat detection, spectral centroid tracking, and frequency-specific energy isolation.
Integrating 3D graphics using WebGL in p5.js or libraries like Three.js to construct three-dimensional reactive audio landscapes.
Exploring the native Web Audio API to create custom audio nodes, synthesis engines, and real-time audio manipulation tools.
Writing custom GLSL shaders to leverage GPU acceleration for rendering highly complex, real-time particle systems driven by audio frequencies.
287.9K views4.8Klikes17:47Original Release: 2016-10-19
hello in this video I'm going to take what I did previously which is uh drawing a kind of graph of the volume of song um and instead of drawing the volume of the song the amplitude of the song across all frequencies I'm going to use an object in P5 called the fft object to analyze the sound in a way that I can get the amplitude for low frequency sounds for high frequency sounds and in that sense I might see a different graph based on a different graph if it were somebody whistling and there were high pitch sounds versus somebody speaking in a very deep voice or something like that so we'll see what happens once I start to use that let me pause the music for a second now so in P5 the object that I'm interested is this P5 fft object so we used P5 do amplitude to get the current volume of a sound P5 fft analyzes the sound Returns the results from the frequency spectrum or time domain he what are those things the frequency spectrum the time domain anyway so the the the the issue is here there's raw data coming in from an MP3 file a microphone whatever and that raw data has to be processed and analyzed through an algorithm to pull things that we care about out of it one methodology for doing this is called fft so if I go to the Wikipedia page you can read a lot more about it fast for your trans transform I'm not going to write this algorithm from scratch or create the engine that does the fft analysis luckily for us P5 sound made by Jason seagull which is built on top of the web audio API has this built into it and so the idea is that what it does is it takes the sound and chops it up um well that's not really right but let me let me come over here for a second to see if we can think about this so if this is me analyzing the sound the amplitude amplitude object gives me a single value volume and I might be able to get I probably with the amplitude object I could get sort of like left and right channel like if it was stereo sound what's the amplitude of the left uh versus the right channel so maybe I could get two but with fft what I can actually get is something that looks we can and we'll make this like a graphic equalizer in other words what is the amplitude at different frequency levels and I can request the fft algorithm to give me the amount frequencies at various resolutions so to speak so I can ask for 256 bands so frequencies with a with a a level of detail of 256 or 512 or whatever generally the sort of standard here are these um um powers of two so to speak but um uh I encourage you to I'll try to put some resources in the in this video's description with more about fft stuff and how it works but for right now let's actually just try to make it work so what one thing I want to do is I want to change this amplitude object to be an fft object and then I want to say instead of making a new P5 amplitude object I want to make a new P P5 fft object let's go to the reference and click on fft and let's look at what's what the functions are so I can waveform we'll look at waveform later but analyze computes the amplitude values along the frequency domain the array indic it gives me an array and those indices correspond to specific frequencies lowest to highest okay so let's just say we can look here actually one of the things that I think I need to do or maybe it does it by default let's just see okay so I'm going to say uh analyze so what I'm going to do here in draw now let's let's uh let's get rid of the circular stuff maybe we can come back to that in a second going to simplify a lot here I I want to instead of asking an amplitude object to give me a level I'm going to call this variable spectrum and I'm going to say amplitude uh analyze and sorry fft analyze and now I'm just going to say console.log um Spectrum so let's take a look at what we're getting in the browser oh can not read property analyze of undefined so I've got an issue here uh VAR fft uh oops fftt equals new P5 fft and now analyze okay let's try that again so we can see here that what I'm getting is this array now how big is that array that array is Spectrum oops let's look at the length of that array it is 102 4 so by default I get 1024 frequency bands I believe if I give it an argument like 512 no smoothing bins ah so a smoothing is so it takes two arguments the length this first argument these are optional is a smoothing amount so we'll play with that later um I guess let's try doing it oh and I could do set input analyze get energy let's see get centroids smooth smooth fft analysis by averaging with the last analysis frame wow that's so wonderful that it does that for you so let's try saying um zero smoothing and 512 bands uh and let's go here great so now you can see I'm getting 512 the reason why I wanted to do that is because let's get 256 you know I just want to kind of I'm going to make my canvas 256 by 256 now so what I want want is to have uh one pixel per band which is going to be a quick way of kind of drawing the result here um so what I'm going to do now let me pause that music is I'm going to Loop through that array I goes from zero to the length of the array and a given amplitude at any given time is Spectrum uh index I and now uh uh the Y value I want to map that which goes between zero and one from uh height to zero so I can now say once again I can draw a line from the bottom of the window oh I comma height to I comma Y and now what we have here and if I say stroke 255 right I want to draw a line for each one of these bands and we should see now ooh so I didn't do something very well here so what are ah interesting let's look at what are the values what is the so I'm wrong about the range the range is not between zero and one clearly let's look at that Spectrum array again so it looks like the range that it's actually giving me back is maybe between 0 and 255 that's just kind of a guess it's probably in the documentation so let me fix that range and we can say 256 kind of as the top there we go so now what we're seeing here is this kind of frequency analysis and you can see the lower frequency sounds are much higher than the high frequency sounds let's change the song to uh this Dot and we can see if there's like a pretty different quality as always I always forget the this dot this dot this dot yeah you can see there's many more with the with the percussion in the background and you could start to see how you could do more sophisticated analysis because if you can measure the amplitude of say a certain high frequency sound you might be able to do some beat detection to kind of determine when are those kind of high frequency drum beats happening and in that sense the the noise from my voice or whatever is singing or something else affect that okay so this is the basics of graphing fft analysis let's just make it um let's reduce the number of let's make it look a little more like a graphic equalizer give it some rainbow colors and kind of reduce the number of bands okay so what I'm going to do here is I'm going to change it to um give it uh 64 and so I also want to have a variable now which I'm going to call a w which is what's the width of each band and that that W whoops that W would be equal to the width of the window divided by the total number of bands or 64 and I could probably make that in a variable so now what I want to do is have I in oh I want to draw the bands at so now if I do this right as always I always for there's only that many bands only 64 now so what I want to do is draw it at I * W and you can see now these lines areed out and I could also now uh make this a rectangle instead so the rectangle starts at uh I * Wy and I * W and it and its its height is whatever height minus y then I would think as always I always forget the this dot this dot oops it width is W sorry kind of an interesting effect so you can see I'm drawing them as rectangular bands and now certainly I could give them uh a Phil and I could say Phil you know I 255 255 and I could make uh the color mode uh HSB and now you can see as always I always you know and I could obviously expand and map the colors differently but you can see the idea here now I could I could make W uh you know minus two whoops I could have W equal that you know minus 2 or something so there's a little spacing in between them as always I always forget this do dot dot the W should remain the same but when I actually go to draw the rectangle it's width should be a little bit less and maybe what I want to say is no stroke but I should never get into like visually doing anything because I have no visual Talent whatsoever so you get the idea oh let's add smoothing so let's see what happens if we add the smoothing um so remember that you can do this thing you can give you can actually smooth these values let's give it 0.
five see what that looks like as always I always forget this do I can't tell what's going on here let's make that one as always I always forget this 0.9 as always I always forget yeah okay so you can see this smoothing now what what it's doing is it's taking frequency and averaging it with the value before so you get this quality of um of sort of smoother values as a as an amplitude gets higher instead of jumping directly to that value it's kind of interpolating to that value and we could program this oursel using say the lurp function what's interesting about this is another idea I have going back and find I've got this like pearing noise terrain video What If you were to take fft values and map those to the sort of terrain and sort of threedimensional of some type of landscape that could be an interesting thing to try Okay um people in the chat are requesting the circle so why not right let's do the circle you can stop watching this video if you don't want to see it anymore so what I'm going to do is first of all will it let me just ask for 360 bands uh let's make the canvas 360 as always I always yeah so one thing it will not the value provided is not a power of two so this is going to make doing the um this is going to make the circular thing a little bit trickier but not really that much not that tricky so let's let's make this happen uh let's um so let's uh first I always forget okay so the first thing I need to do here is uh translate to the center we saw this translate to the center Cent now I want to have a radius r equal to map that amplitude which goes from 0 to 256 to something like 0 to or let's let's give it a minute 40 to 200 okay so then I'm going to use a line here I'm going to say uh let's actually use begin shape and end shape the same way we did that before I could there's going to be there's some things I could do that'll be let's let's get it working the way I had before and I'll show you some other things you could do to do do in a slightly different way so what I'm going to do now is say varx = R * cosine of that angle VAR yal R * s of that angle being I at this point um let's oh angle mode is already set to degrees um and then I'm going to say uh vertex uh X comma y so let's see what we get uh now uh line 58 unexpected token so I think I have somehow I have an astray bracket there we can get rid of this stuff is unnecessary now and I'm going to run it again whoa I did something crazy well this is an interesting effect so let's go look what's wrong here oh let's I don't need this W thing anymore what am I missing here I don't need volume history so much extra stuff go okay I don't know what I had wrong so you can see ah so I just don't have the full 360° yet so how do I deal with that so if I'm getting say um 256 bands but there's 360° what I actually want this angle to be angle equals map I which goes from 0o to spectrum. length from 0 to 360 pretty easy enough and then instead of I I can use angle here and uh now we can do this again as always I always forget dot angle as always forget oh yeah so there's just not a lot of high frequency sounds and the low frequency sound is really loud so my mapping is a little bit off there now you can sort of see what's going on here um and we can uh we can kind of mess with this a little bit remember I had that fill in there why not just add that here let's see if it if I fill per vertex uh I should be able to fill it per vertex I don't have a stroke um but anyway I'll let you guys kind of mess around with that you know I could rotate lines around it let's let me make it different colors um also say every height has a certain color and you can map the song two dimensionally so I I really should stop this but I can't help myself so one thing I want to do is actually what I want to do is draw a line I'm going to instead of saying begin shape end shape I could use rotate but since I've already done the calculation I'm going to draw a line from the center to that XY and uh uh what I'll do is I'll say uh stroke I 255 255 and now as always I it's really much slower so you can see um it's slow because that's a lot of lines to draw I am getting a nice um so I guess what I probably want to do is reduce the number of bands as you can see it's running more smoothly now anyway I could play with the color in a different way um I could use rotate and have these be rectangles um I could think about the mappings I have it spin I could connect it there's all sorts of possibilities here but I'm kind of showing you a range so hopefully you enjoyed this and got something out of it you know obviously I would hope that you watching this could come up with sort of more cre I want say more creative ideas or your own take on what it means to visualize the fft uh Spectrum array from uh sound file okay and I'll see you in a future video I'm going to do a few more videos that'll be next in this playlist and I don't know what it's going to be in them yet but yeah if you're watching this now and the video is already there then you know you know before I do although because you're in the future or I'm in the present past something like that [Music] goodbye
Up Next

13:37
Forensic Linguistic Profiling: What Your Language Reveals About You
@TEDx
80.7K views•2017-01-27

12:54
Triumph of Orthodoxy Icon: Byzantine Art & History Explained
@BenCallan
2.1K views•2024-08-06

9:49
FastAPI vs Flask vs Django: Choosing the Right Python Web Framework
@TechWithTim
302.5K views•2024-05-26

1:42
Game of Thrones Opening Credits: A Cinematic Analysis
@gameofthrones
46.3M views•2011-04-18
Related Study Plans & Knowledge Roadmaps
Structured learning paths in General & Interdisciplinary Studies
general-studies
Elevator Engineering: History, Physics & Cities
01From Hoists to Safety Brakes: The Dawn of Vertical Lift
02Hydraulic vs. Traction: The Engineering Physics of Elevators
03Modern Speed, Safety, and Algorithms
+ 2 more learning modules
12h5 modules
Explore Roadmap
general-studies
Rubber: Material Science, History & Geopolitics
01Origins of Natural Rubber & Mesoamerican History
02The Chemistry of Natural Rubber & Vulcanization
03The Geopolitics of the Rubber Boom & Colonization
+ 2 more learning modules
12h5 modules
Explore Roadmap
general-studies
Containerization: Evolution, Logistics & Trade
01Ancient Trade & Bulk Cargo: Amphorae to Barrels
02The Industrial Revolution & Cardboard Packaging
03The Containerization Revolution: Malcom McLean
+ 2 more learning modules
12h5 modules
Explore Roadmap
general-studies
Textile Tech: Evolution, Labor & Global Impact
01Pre-Industrial Textiles: Handloom & Cottage Industry
02Mechanization: The Spinning Jenny to the Power Loom
03The Factory System & Global Labor Transformation
+ 2 more learning modules
10h5 modules
Explore Roadmap