Lift is the actual force that keeps an airplane airborne, while the coefficient of lift is a dimensionless value derived from experimental testing that quantifies how effectively a wing generates lift at different angles of attack; unlike lift which depends on multiple factors including air density, velocity, and wing area, the coefficient of lift specifically captures the wing's aerodynamic efficiency and is determined through wind tunnel testing where measurements of lift, air density, velocity, and surface area are used to calculate this characteristic value for each unique wing design.
Lift vs Coefficient of Lift: Key Differences Explained
Added:Deep Dive
Basic understanding of the four forces of flight, particularly how aerodynamic lift acts on an aircraft.

04 Four Forces of Flight
6.1K
Four fundamental forces act on an airplane: lift (upward force from air flow over wings), weight (downward force from gravity), thrust (forward force from powerplant), and drag (retarding force opposing thrust). In straight and level unaccelerated flight, lift equals weight and thrust equals drag. Lift is generated through Bernoulli's principle (faster air over wing top creates lower pressure) and Newton's third law (downwash creates equal and opposite upward reaction). Key airfoil terminology includes chord line, camber, angle of attack, and coefficient of lift (CL). Each airfoil has a CL max point where maximum lift occurs before airflow separation causes stall.
Click to watch →

Introduction To Multi Engine Aerodynamics
72.9K
The four fundamental forces acting on an aircraft are thrust, drag, lift, and weight. Thrust is the forward force produced by the propeller that opposes drag. Drag is the rearward force caused by disrupted airflow over the wing that opposes thrust. Lift is the dynamic effect of air acting on an airfoil, which acts perpendicular to the airplane's flight path through the center of lift. During level flight, lift acts opposite to weight. Weight is the total load of the aircraft acting downward due to gravity, and it acts opposite to lift through the center of gravity.
Click to watch →

Aerodinámica Basica para Pilotos (IVAO Colombia)
126.7K
The four fundamental aerodynamic forces acting on an aircraft in flight are weight (gravity's pull on the aircraft), thrust (forward force generated by the propulsion system), lift (upward force generated by the wings and fuselage through pressure differences and action-reaction principles), and drag (resistance opposing forward motion, including parasitic drag from surface friction and induced drag from lift generation). Lift is generated through two mechanisms: Newton's third law (air deflected downward creates upward reaction force) and Bernoulli's principle (pressure difference between upper and lower wing surfaces). The angle of attack controls lift magnitude, with higher angles producing more lift until reaching the critical angle where airflow separation causes a stall. Winglets reduce induced drag by preventing wingtip vortices, improving fuel efficiency.
Click to watch →

How Does Lift Work? | Student Pilot Podcast: Aerodynamics
32.7K
Four forces act on aircraft: Lift (upward), Weight/Gravity (downward), Thrust (forward from engines), and Drag (backward). In unaccelerated straight-and-level flight, these forces balance—thrust equals drag, lift equals weight. Lift is generated through two principles: Bernoulli's principle (faster airflow over curved upper surfaces creates lower pressure) and Newton's third law (air deflected downward by the wing pushes the wing upward). Understanding these relationships helps pilots predict aircraft behavior under various conditions.
Click to watch →

From the FAA Archives: How Airplanes Fly (1968)
7.9K
Four major aerodynamic forces act on an aircraft: lift, weight, thrust, and drag. Lift holds the airplane aloft by overcoming weight; it is generated by pressure differentials over the wing. Thrust propels the aircraft forward and creates relative wind - generated by engines through propeller blade lift or jet exhaust reactions. Drag opposes forward motion as air resistance and inertia. In straight and level flight without acceleration, these forces are in balance: thrust equals drag, and lift equals weight. When power increases, thrust exceeds drag, causing acceleration until drag increases with speed to restore equilibrium. Higher speeds also increase lift capability because more air flows over the airfoil.
Click to watch →
Deep Dive
The concept of dynamic pressure, including the roles of fluid density and flow velocity.

TEP4100 20022025 A
385
Dynamic pressure (½ρU²) represents the pressure increase due to fluid motion. It is the difference between stagnation pressure and static pressure. Dynamic pressure is always positive and depends on both fluid density and velocity. This concept is essential for understanding pressure distributions around bodies in external flow and for calculating forces on structures exposed to fluid streams.
Click to watch →

** Flüssigkeiten und Gase Teil 11, Bernoulli 1
18.3K
Dynamic pressure is the pressure associated with the motion of a fluid and represents its kinetic energy per unit volume. It is calculated as ½ρv², where ρ is the fluid density and v is the flow velocity. Unlike static pressure, which exists regardless of fluid motion, dynamic pressure only appears when the fluid is moving. When fluid is accelerated, dynamic pressure increases while static pressure decreases, and vice versa when fluid is decelerated. This concept explains how moving fluids can exert additional pressure forces beyond their static weight.
Click to watch →

CGA - QUESTÕES SELEÇÃO AZUL por Cmte Luis mendes
1.4K
Dynamic pressure is the pressure derived from fluid movement, calculated as q = ½ρv², where ρ is fluid density and v is velocity. It differs from static pressure, which exists in stationary fluids. The formula shows that dynamic pressure depends on fluid density and flow velocity, not on fluid weight or impact area. This concept is fundamental to understanding aerodynamic forces on aircraft surfaces.
Click to watch →
Lec #06 || Bernoulli's Equation || 1st Year || Physics || Fluid Dynamics
9.8K
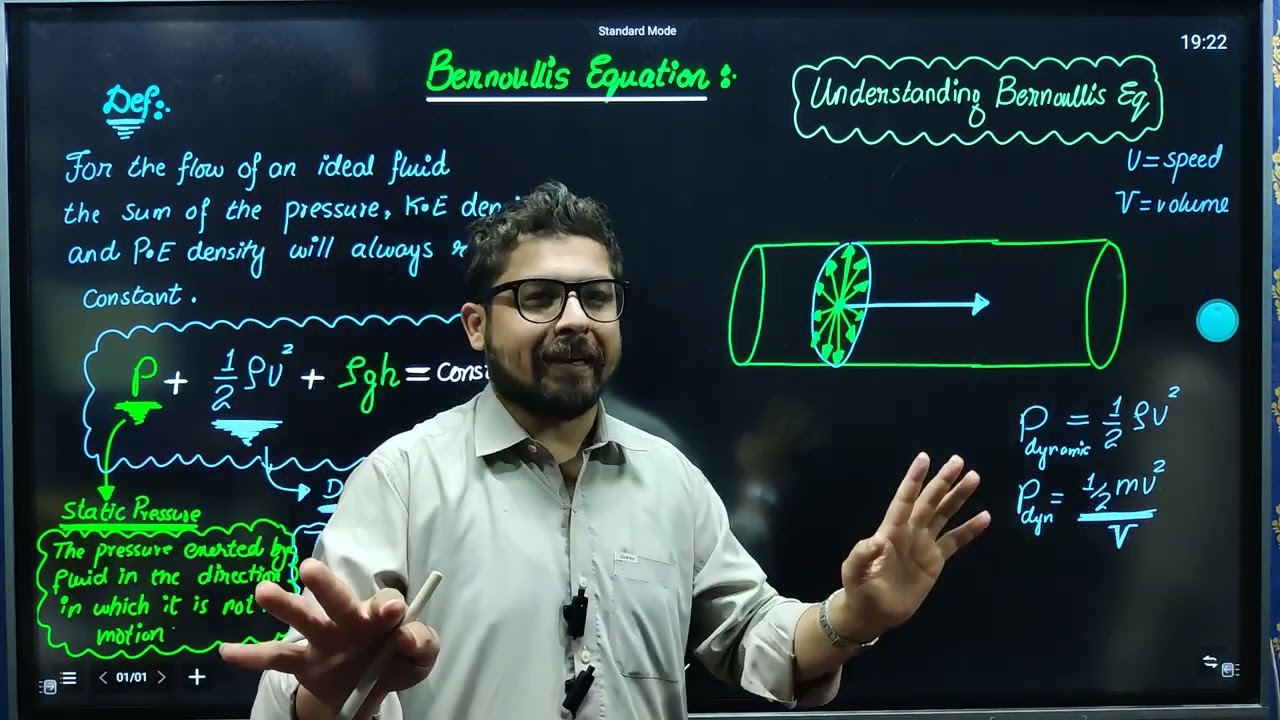
Dynamic pressure is the pressure exerted by a fluid in the direction of its motion. It is calculated as ½ρv², where ρ is fluid density and v is velocity. This pressure represents the force per unit area applied by the moving fluid along the flow direction. The term 'dynamic' indicates this pressure arises specifically from the fluid's motion. Understanding dynamic pressure is essential for analyzing how moving fluids exert forces on surfaces and each other.
Click to watch →

ATPL -POF Class 1 . Basics , Laws and Definitions
127
Dynamic pressure (Q) equals one-half of the fluid density (ρ) multiplied by the velocity squared (Q = ½ρV²). This formula shows that dynamic pressure increases with both fluid density and the square of velocity. In a Venturi tube, as velocity increases in the throat, dynamic pressure increases while static pressure decreases.
Click to watch →
Deep Dive
Fundamentals of airfoil geometry, specifically camber, chord line, and the angle of attack.

Types of Aerofoils and uses
133
The chord line connects the leading and trailing edges of an airfoil. The camber line is the curve equidistant from the upper and lower surfaces. The angle of attack is the angle between the chord line and relative airflow. Positive camber (curved upper surface) generates lift at zero angle of attack. Negative camber (curved lower surface) is rarely used. Symmetric airfoils have identical upper and lower surfaces.
Click to watch →
Chord Line | Camber | Angle Of Attack | Basic Aerodynamics| #aviation #aircraft #ame
3.3K
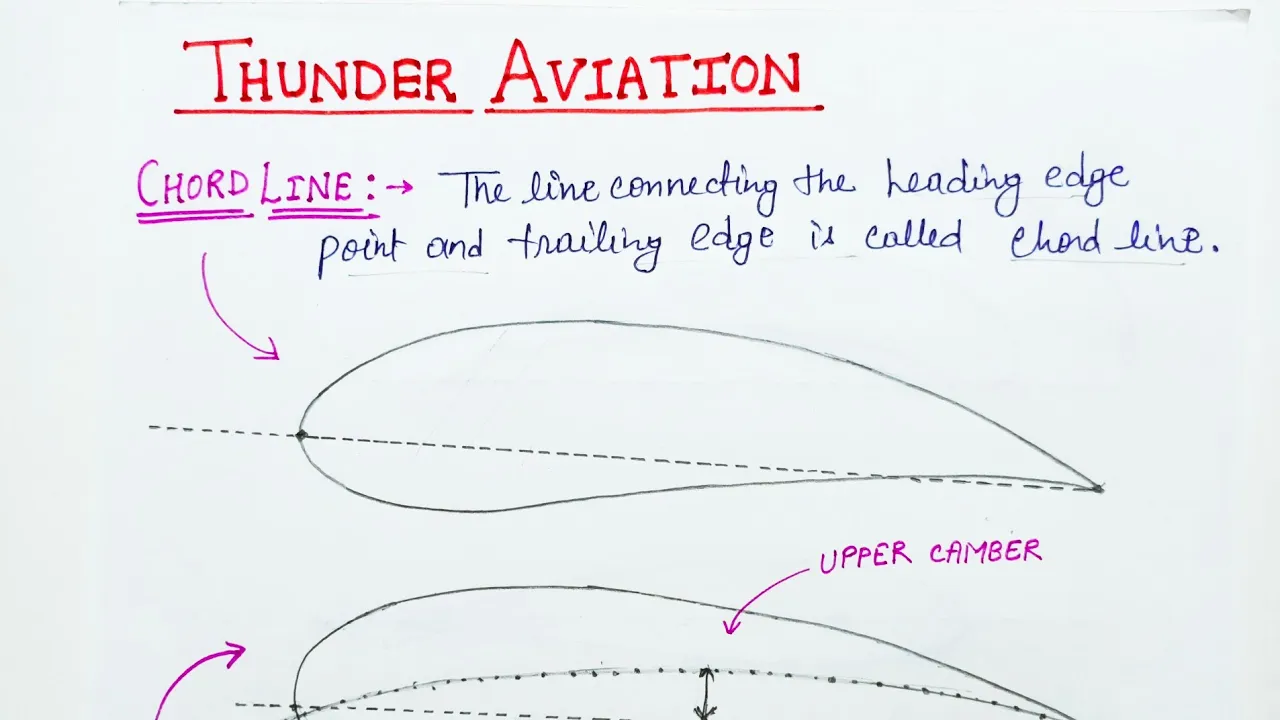
In basic aerodynamics, the chord line connects the leading edge and trailing edge of an airfoil, the mean camber line is equidistant from both upper and lower surfaces, camber is the distance between the mean camber line and chord line, and the angle of attack is the angle between the chord line and the relative wind direction.
Click to watch →

Subsonic Airflow - Principles of Flight #2 | Technical General DGCA CPL Exam Ground Classes Online
29K
This section covers the basic geometry of aerofoils including the camber line (straight line joining leading and trailing edges), chord line, and their relationship. The angle of attack is defined as the angle between relative airflow and the chord line. Key concepts include the stagnation point where fluid velocity becomes zero, and the distinction between relative and effective airflow. These geometric relationships form the foundation for understanding aerodynamic force generation.
Click to watch →

Airfoil Nomenclature - NACA series || Aerodynamics || Ms. Aishwarya Dhara
13.7K
An airfoil is the cross-sectional shape of a wing that generates aerodynamic forces when moving through air. Key geometric components include the leading edge (front with maximum curvature), trailing edge (rear with maximum curvature), chord line (imaginary straight line connecting leading and trailing edges), camber line (locus of midpoints between upper and lower surfaces), and thickness (measured perpendicular to camber line). Airfoils are classified as symmetric (identical upper and lower surfaces, zero lift at zero angle of attack) or cambered (asymmetric surfaces, positive lift at zero angle of attack). Both types experience stall beyond 15-22 degrees angle of attack.
Click to watch →

Conhecimentos básicos sobre aeronaves de asa fixa e aeronaves de asa rotativa - Básico
299
Airfoil geometry includes extrados (upper surface), intrados (lower surface), chord line (imaginary reference line), leading edge (front, rounded for smooth airflow), and trailing edge (rear, sharp where flows reunite). The mean camber line determines airfoil type: above chord means positive camber (asymmetric), coinciding means symmetric. Angle of attack is the acute angle between wing chord and relative wind - the most critical concept for pilots. The pilot controls angle of attack through the control stick, increasing lift coefficient until reaching critical limit where stall occurs. Angle of attack differs from aircraft attitude (nose position relative to horizon).
Click to watch →
Deep Dive
Basic algebraic skills and dimensional analysis to comprehend how dimensionless coefficients are derived.

NEET DAY 01 , Units and Dimensions NEET in 90 days crash course in tamil with tips and tricks
106K
This segment covers dimensionless quantities and dimensional analysis techniques. Strain is dimensionless [M^0 L^0 T^0], as it's ΔL/L. Efficiency is dimensionless, as it's output/input. The coefficient of friction is dimensionless, as it's f/N. Specific gravity is dimensionless, as it's density/density. The gravitational constant G has value 6.67×10^-11 N·m²/kg². Dimensional analysis involves ensuring all terms in an equation have the same dimensions, as demonstrated with v = a + bx - ct.
Click to watch →

Physics OneShot - 1 | 32 marks in 30 mins | RE NEET 2026
3.9K
Dimensionless quantities: angles, strain, stress. For dimensional analysis: write dimensions for each quantity, apply algebraic rules. Example: G = GM/r² → [M⁻¹L³T⁻²]. For a/b: find dimensions of a and b separately, then divide. Alternatively, rearrange formula to isolate unknown and substitute dimensions.
Click to watch →

ANÁLISIS DIMENSIONAL- TEORÍA
250
Dimensional formulas show relationships between derived and fundamental magnitudes. Dimensional equations are algebraic equations where unknowns can be magnitudes or dimensions. Key rules: (1) Angles, trigonometric functions, and pure numbers are dimensionless (dimension = 1), (2) Addition/subtraction rules differ from algebra—L + L = L, not 2L, (3) Principle of dimensional homogeneity requires all terms in a correct physical equation to be dimensionally equal, (4) Exponents are always dimensionless (dimension = 1).
Click to watch →

UNITS AND MEASUREMENT CLASS-11th| ONE SHOT | PHYSICS | CHAPTER -1| NCERT
1.8K
Dimensional analysis can determine unknown coefficients in equations. Given x = 4bt - 7at², dimension of b/a = [T]. Given v = at² + bt, dimension of a = [L T^-3], dimension of b = [L T^-2]. Given p = a - t²/bx, dimension of a/b = [M^2 L^-2 T^-4]. Dimensional analysis can also derive formulas when the relationship between quantities is known but the exact formula is not. For a simple pendulum, assuming T ∝ l^a m^b g^c and solving gives T = k√(l/g), where k is a dimensionless constant (experimentally found to be 2π).
Click to watch →

Analiza wymiarowa - narzędzie tak potężne że aż wydaje się być oszustwem?
420
When dimensional analysis encounters multiple variables with the same units, it cannot distinguish between them, producing dimensionless coefficients. The actual formula could be any function of that coefficient. Scaling arguments use dimensional analysis to predict how systems change when parameters are scaled. For the radioactive decay problem, if distance decreases by factor 10, the half-life must also decrease by factor 10 to maintain the same velocity. This principle applies to many physical systems, including hydrodynamics where dimensionless numbers like Reynolds number determine system behavior. When scaling a system (e.g., doubling tunnel diameter), all dimensionless numbers must remain constant to maintain similar behavior.
Click to watch →
Prerequisite Knowledge
- Concept 01Basic understanding of the four forces of flight, particularly how aerodynamic lift acts on an aircraft.
- Concept 02The concept of dynamic pressure, including the roles of fluid density and flow velocity.
- Concept 03Fundamentals of airfoil geometry, specifically camber, chord line, and the angle of attack.
- Concept 04Basic algebraic skills and dimensional analysis to comprehend how dimensionless coefficients are derived.
Subsequent Learning
- Step 01Analyzing the Lift Coefficient vs. Angle of Attack curve (Cl-alpha curve) and identifying the stall point.
- Step 02Exploring other aerodynamic coefficients, such as the drag coefficient (Cd) and the lift-to-drag ratio (L/D) for overall aerodynamic efficiency.
- Step 03Understanding scaling laws in wind tunnel testing, specifically the roles of Reynolds number and Mach number.
- Step 04Investigating how high-lift devices (like flaps and slats) physically alter the lift coefficient during takeoff and landing.
Lift vs Coeff
Testing Process
Lift vs Coeff
0:07Playing Section
- 1
Explains lift formula factors and dynamic pressure roles.
- 2
Coefficient combines wing shape and angle of attack.
Limitations of Quasi-Static Lift Coefficients in Unsteady Aerodynamics
While the traditional distinction between lift and the coefficient of lift (Cl) is foundational in steady-state aerodynamics, this classical framework has significant limitations in unsteady flight regimes, such as flapping-wing flight (insects and micro-air vehicles) or dynamic stall. The standard lift equation assumes Cl is a quasi-static function primarily dependent on the angle of attack. However, in highly unsteady flows, transient phenomena like leading-edge vortex generation, wake capture, and added mass forces dominate. Under these conditions, the static coefficient of lift fails to accurately predict lift because the flow state is highly time-dependent and history-dependent. Consequently, modern aerodynamics must often move beyond classical Cl representations to unsteady aerodynamic models that account for dynamic vortex shedding, showing that the standard lift coefficient model is a simplification that breaks down in complex, time-varying flight environments.
Deep Dive
Analyzing the Lift Coefficient vs. Angle of Attack curve (Cl-alpha curve) and identifying the stall point.
Lift, Coefficient of Lift
55.3K
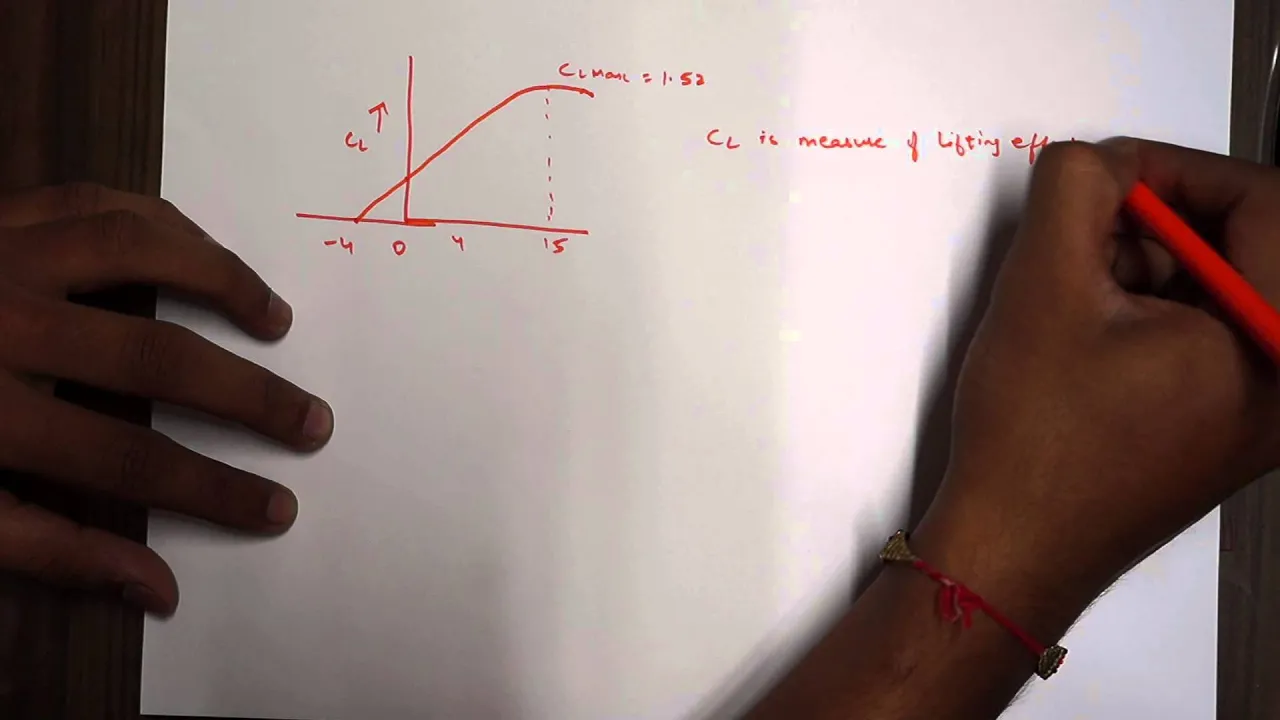
The CL versus angle of attack graph reveals critical flight characteristics: from -4° to 12-15°, CL increases steadily; beyond 15°, CL increases at a lower rate; beyond the critical angle of attack (stall point), CL rapidly decreases due to airflow separation. CL max (typically 1.5-1.6) represents maximum lifting effectiveness. Greater CL allows maintaining constant lift at lower speeds. Lift transducers, fitted at wing leading edges, measure lift or angle of attack using electrical sensors and serve as stall warning systems. Symmetric aerofoils show similar CL behavior but generate no lift at zero angle of attack.
Click to watch →
Exclusive: Joint Airbus & Boeing flight test lecture
13.8K
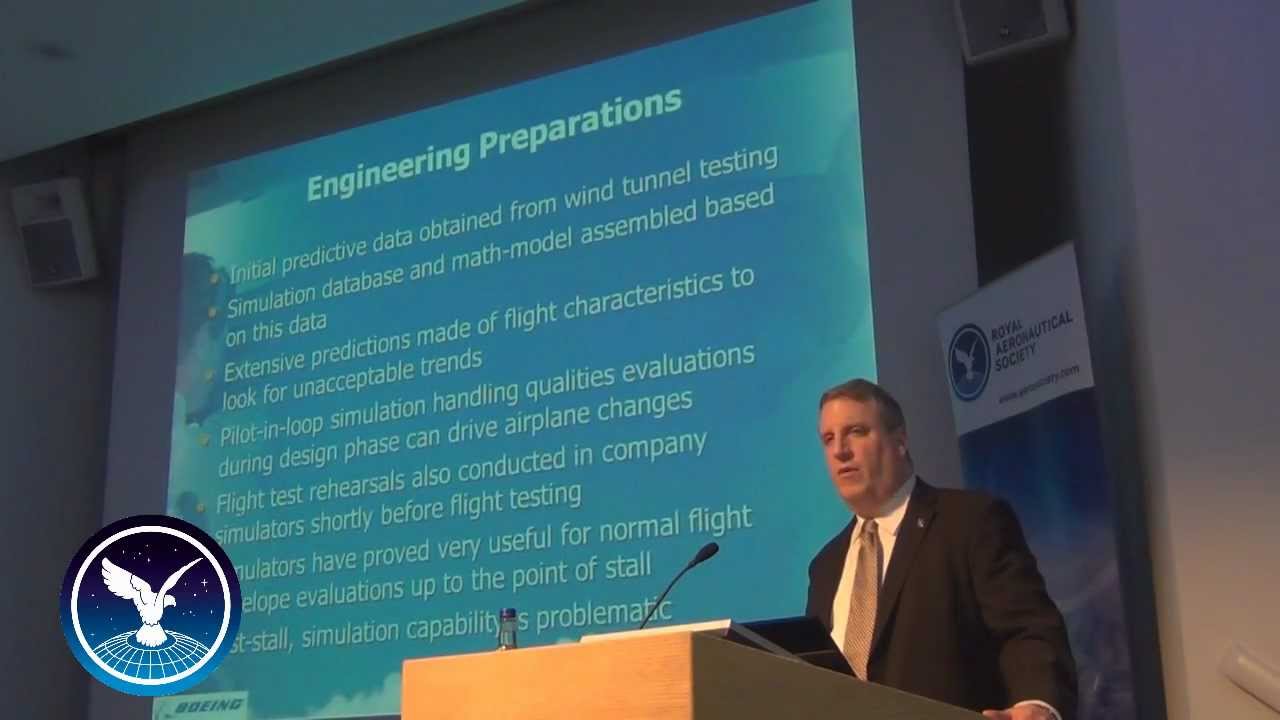
A stall occurs when maximum aerodynamic lift (CL Max) is achieved, beyond which further angle-of-attack increase causes automatic lift reduction. CL-alpha curves show CL Max and corresponding stall angle. Leading edge devices (slats) significantly increase stall angle, while flaps primarily increase CL Max. The G-break phenomenon detects stall through sudden lift reduction. Some configurations produce flat CL-alpha curves where G-break detection fails, requiring alternative identification methods.
Click to watch →

Sesión 5- XFLR5 Introducción
106
When plotting lift coefficient versus angle of attack, cambered airfoils generate positive lift at negative angles of attack, while symmetric airfoils only generate positive lift at positive angles. The curve reaches a maximum at the stall angle (approximately 15 degrees for most airfoils), after which lift decreases due to flow separation. Stall occurs when the flow transitions from laminar to turbulent and separates from the airfoil surface, causing decreased lift and increased drag.
Click to watch →
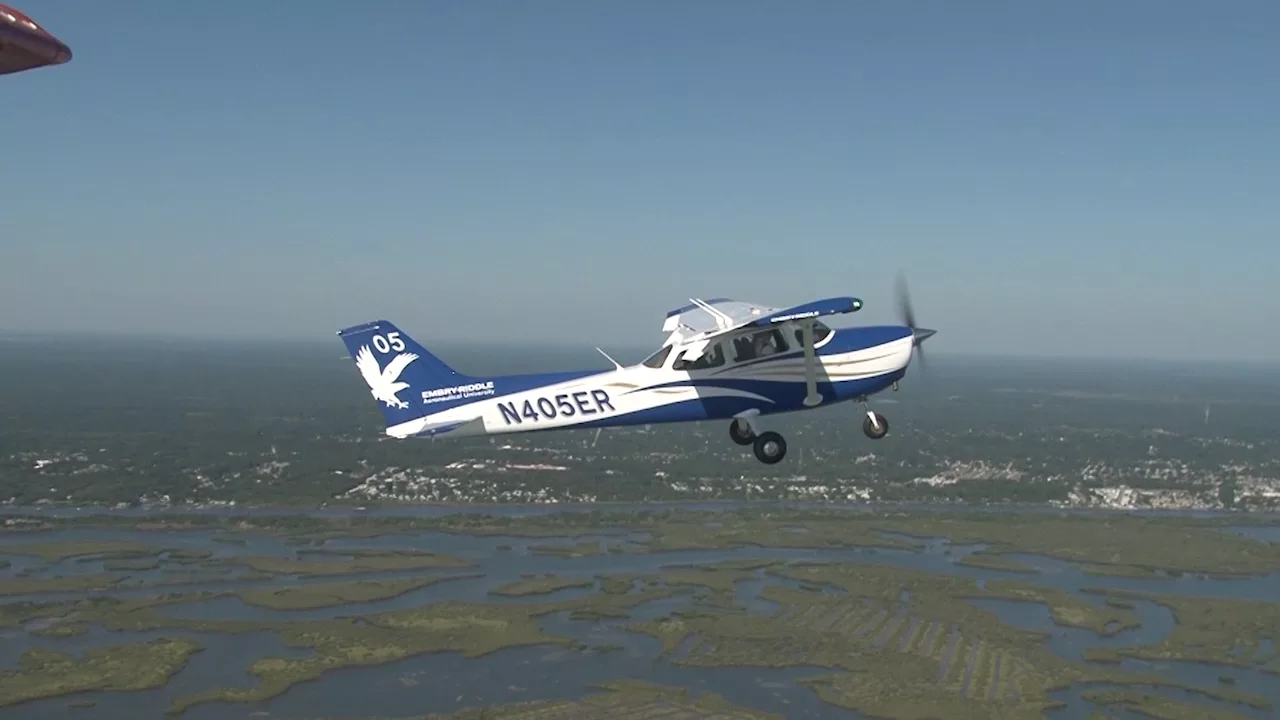
Principles of Flight: Aerodynamics Explained for Pilots
784.5K
As angle of attack increases, lift coefficient increases until reaching the critical angle of attack. Beyond this point, lift decreases dramatically despite further angle of attack increase - this phenomenon is called a stall. The coefficient of lift depends on airfoil shape and angle of attack.
Click to watch →

Wind Tunnel Data Analysis and Testing Considerations
6.5K
The coefficient of lift (Cl) versus angle of attack (alpha) plot shows a characteristic curve where lift increases linearly with alpha until reaching a critical point called alpha stall. At low angles of attack, the plot typically starts near the origin for symmetric airfoils, but may start above zero for cambered airfoils or when considering the entire aircraft configuration. The slope of this linear region, known as Cl_alpha, is approximately 2π radians⁻¹ for two-dimensional airflow, though it varies for three-dimensional wings. This slope represents a stability derivative that is crucial for stability and control analysis.
Click to watch →
Deep Dive
Exploring other aerodynamic coefficients, such as the drag coefficient (Cd) and the lift-to-drag ratio (L/D) for overall aerodynamic efficiency.

Drag, Coefficient of Drag, L/D ratio
46.3K
Drag is an aerodynamic force opposing flight, calculated as the product of dynamic pressure, coefficient of drag (Cd), and surface area; the coefficient of drag represents drag per unit wing area divided by dynamic pressure, and it increases steadily at low angles of attack but rises rapidly beyond approximately 16°; the lift-to-drag ratio (L/D ratio) measures aerodynamic efficiency, with higher values indicating better performance, and it peaks at around 4° angle of attack (called L/Dmax), making this the optimal angle for maximum range and minimum drag; typical L/D ratios range from 10-15 for propeller trainers to 25-60 for high-performance sailplanes.
Click to watch →
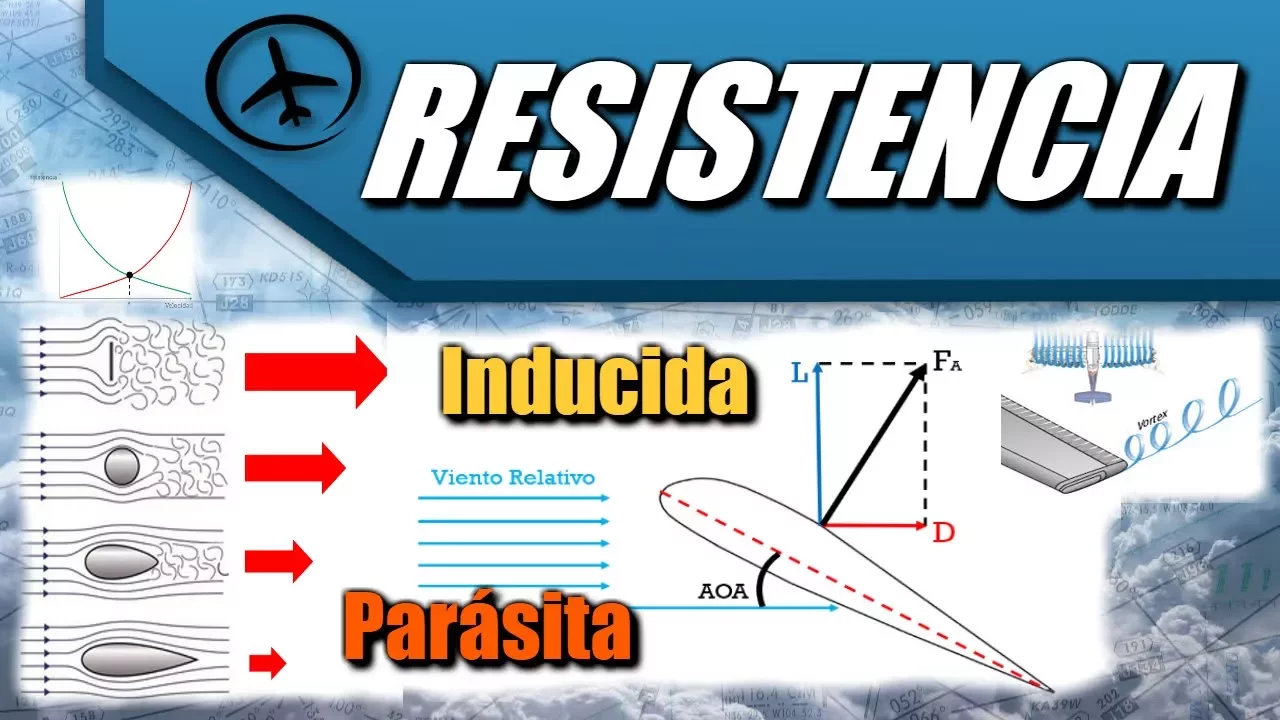
Resistencia - Aerodinámica
173.9K
Total drag equals parasite drag plus induced drag. When graphed against velocity, these opposing trends intersect at minimum total drag point, representing minimum power required and maximum fuel efficiency. The lift-to-drag ratio (L/D) measures aerodynamic efficiency as lift divided by drag, simplifying to the ratio of lift coefficient to drag coefficient. Maximum L/D (L/D max) occurs at best glide speed, where the aircraft achieves maximum horizontal distance per unit altitude lost. For example, L/D max of 12.5:1 means descending 1,000 feet yields approximately 12,500 feet of horizontal travel. This principle is critical for calculating emergency gliding distance after engine failure and optimizing aircraft range and endurance performance.
Click to watch →

Hypersonics and Intro to Propulsion
117
The lift coefficient (CL) is defined as lift force divided by dynamic pressure (q∞ = ½ρ∞V∞²) times reference area (S). The drag coefficient (CD) is defined as drag force divided by the same dynamic pressure and reference area. Total drag consists of parasitic drag (CDP) from viscous effects and lift-induced drag (CDI) from the geometry of the airfoil. The lift-induced drag coefficient is given by CDI = CL²/(πAR), where AR is the aspect ratio and E is the span efficiency factor.
Click to watch →
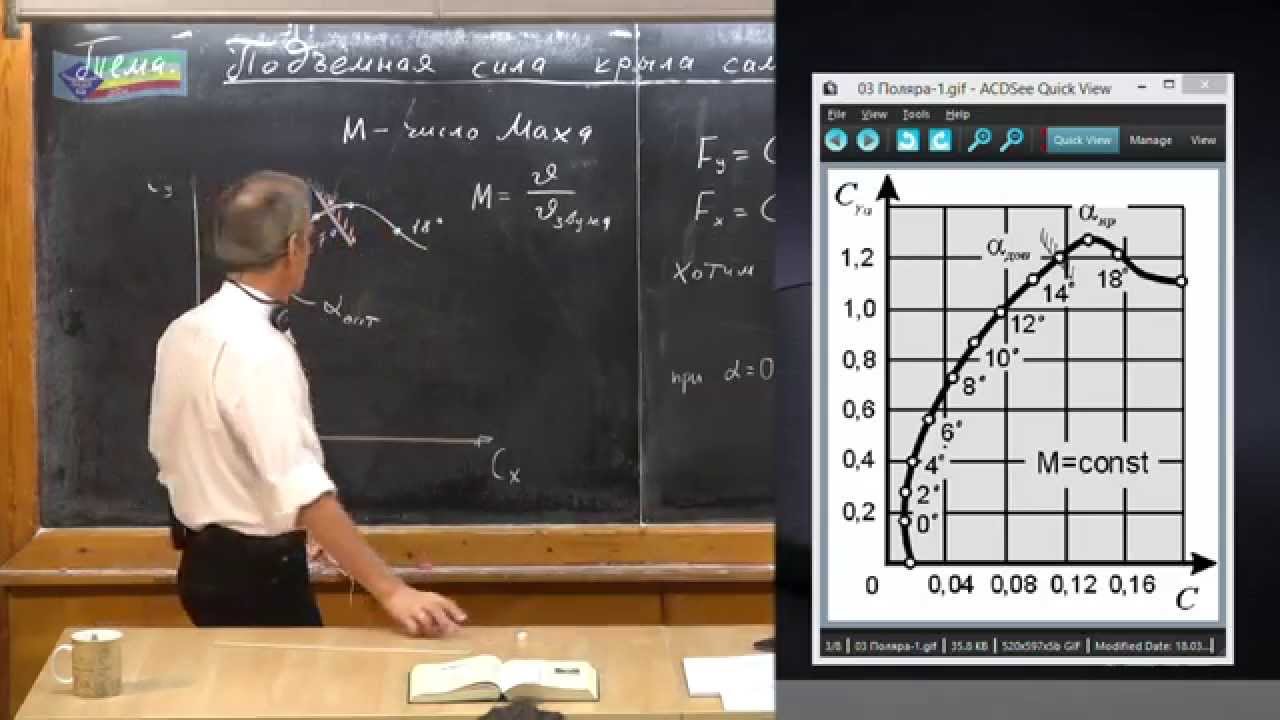
Урок 136. Подъемная сила крыла самолета (часть 2)
114.3K
The aerodynamic quality (or efficiency) of a wing is characterized by the ratio Cy/Cx, which represents how much lift is generated per unit of drag. A higher ratio means the wing is more efficient - it can generate more lift while producing less drag, allowing the aircraft to fly longer distances on less fuel. This ratio depends on the angle of attack and wing shape. When the angle of attack is zero, both coefficients are zero according to the kite effect model, meaning no lift is generated. However, in reality, lift can still be generated at zero angle of attack due to the circulatory effect.
Click to watch →
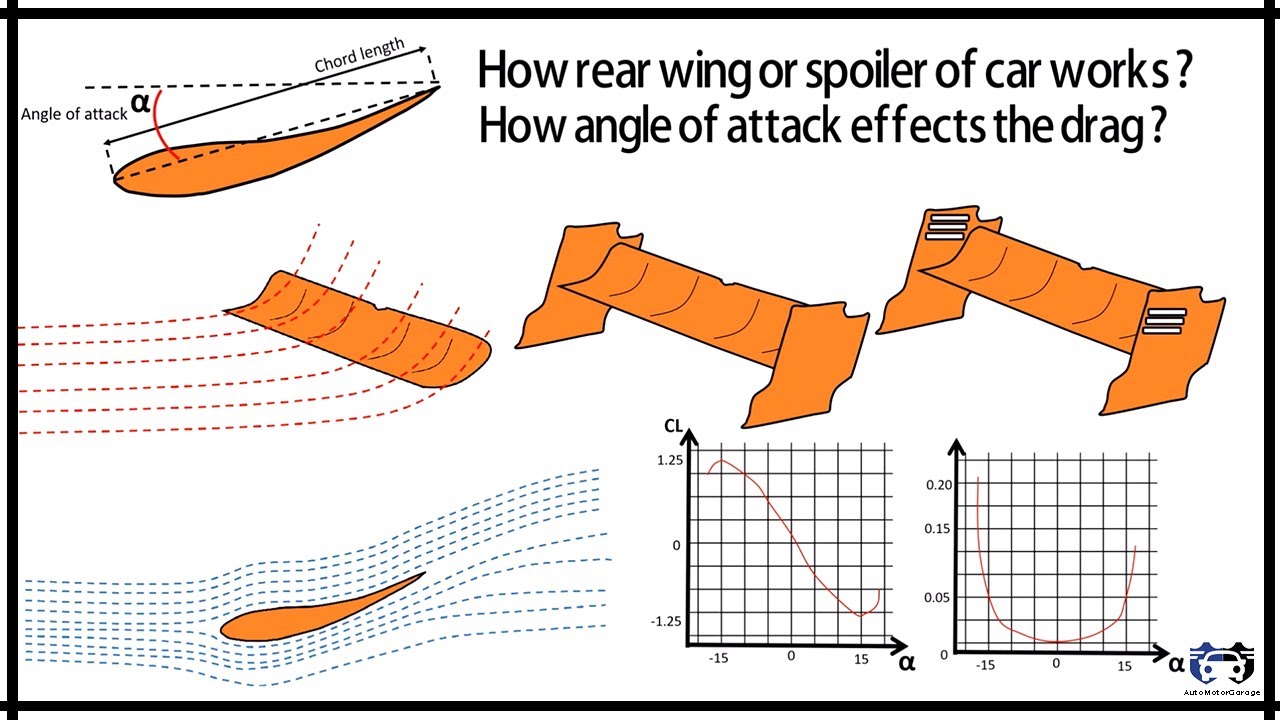
How rear wing or spoiler of car works ? | How angle of attack effects the drag ? - F1 Aerodynamics
70.4K
The coefficient of lift (CL) is a dimensionless quantity given by CL = Lift Force / (Dynamic Pressure × Frontal Area). Similarly, the drag coefficient (CD) is CD = Drag Force / (Dynamic Pressure × Frontal Area). Both coefficients describe aerodynamic performance relative to dynamic pressure and frontal area, allowing comparison of different wing designs regardless of size.
Click to watch →
Deep Dive
Understanding scaling laws in wind tunnel testing, specifically the roles of Reynolds number and Mach number.
![[Fluid Dynamics: Physical Modelling] Reynolds Similitude, P2: wind tunnel tests and examples (2/2)](https://i.ytimg.com/vi_webp/-9NvoAIhMq0/maxresdefault.webp)
[Fluid Dynamics: Physical Modelling] Reynolds Similitude, P2: wind tunnel tests and examples (2/2)
869
In wind tunnel testing, achieving both Reynolds number similitude (which requires higher airspeed for scaled models) and Mach number similitude (which requires same airspeed regardless of scale) cannot be satisfied simultaneously due to conflicting requirements; solutions include using pressurized or cryogenic wind tunnels to increase Reynolds number by manipulating fluid density and viscosity, or accepting trade-offs between the two similarity criteria depending on the specific flow regime being studied.
Click to watch →
![Nondimensional numbers and Similarity [Aerodynamics #4]](https://i.ytimg.com/vi_webp/29a9e_xI9Jg/maxresdefault.webp)
Nondimensional numbers and Similarity [Aerodynamics #4]
20.9K
The Mach number (Ma = V/a) compares inertial forces to compressive forces, defining flow regimes: subsonic (Ma < 0.8), transonic (near Mach 1), supersonic (Ma > 1.2 with shock waves), and hypersonic (Ma ≥ 5 with chemical breakdown). Preserving Mach number ensures the same sonic flow regime and compressibility effects between scaled and actual configurations. However, matching both Reynolds and Mach numbers simultaneously is often difficult in practice. Achieving flight Reynolds numbers (10^7) for scaled aircraft models requires very high velocities (200 m/s) which may push the flow into compressible regimes. Solutions include using larger facilities, changing fluids, or accepting some discrepancy while assessing its impact on results.
Click to watch →

2008Quiz3Q2
1.6K
For aerodynamic testing, the Mach number must be below 0.3 to ensure incompressible flow. A 1mm steel ball at 100 m/s meets this criterion. To replicate flow behavior in wind tunnel testing, the Reynolds number for the model must equal that of the prototype. Since both are in atmospheric air, kinematic viscosity remains constant, leading to the velocity scaling relationship: V_model = (L_prototype / L_model) × V_prototype. Given V_prototype = 100 m/s and V_model ≤ 20 m/s, the model must be at least 5 times larger than the prototype (L_model ≥ 5 × L_prototype). For a 1mm prototype, the model must be at least 5mm in diameter.
Click to watch →

Reynolds Number Explained: Laminar vs. Turbulent Flow
63.1K
Engineers use wind tunnel testing with scaled-down models to predict the flight properties of full-sized aircraft. By matching both Mach number and Reynolds number between the model and actual aircraft, researchers ensure that the aerodynamic behavior observed in the wind tunnel accurately represents the real-world performance. This similarity principle allows engineers to conduct expensive flight tests on small models rather than building and testing full-scale prototypes, significantly reducing development costs while maintaining predictive accuracy.
Click to watch →
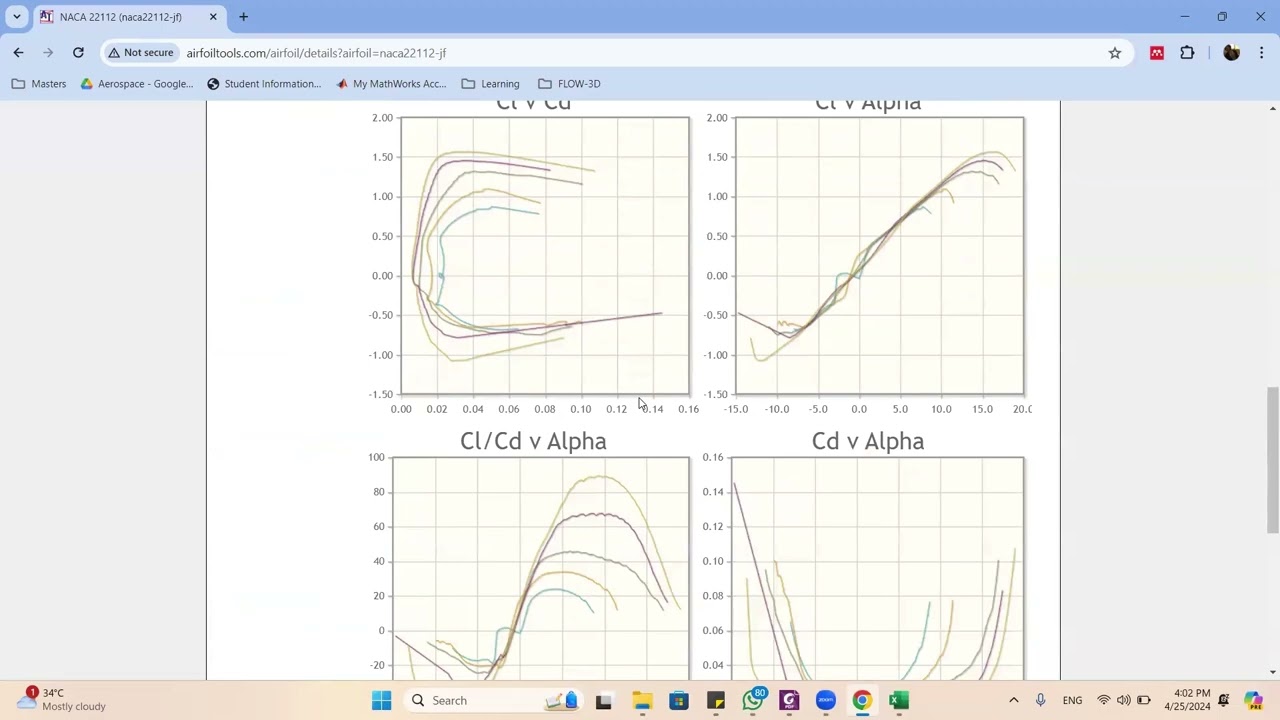
Airfoil Characterstics Tutorial AERS121 شرح بالعربي
532
Dynamic similarity requires matching Reynolds number (viscous effects) and Mach number (compressibility effects). Mach number = V/a (velocity/speed of sound). For geometric similarity, all linear dimensions scale by factor n. For dynamic similarity, velocity scales by n and density scales by n². This ensures model and full-scale exhibit similar aerodynamic behavior.
Click to watch →
Deep Dive
Investigating how high-lift devices (like flaps and slats) physically alter the lift coefficient during takeoff and landing.
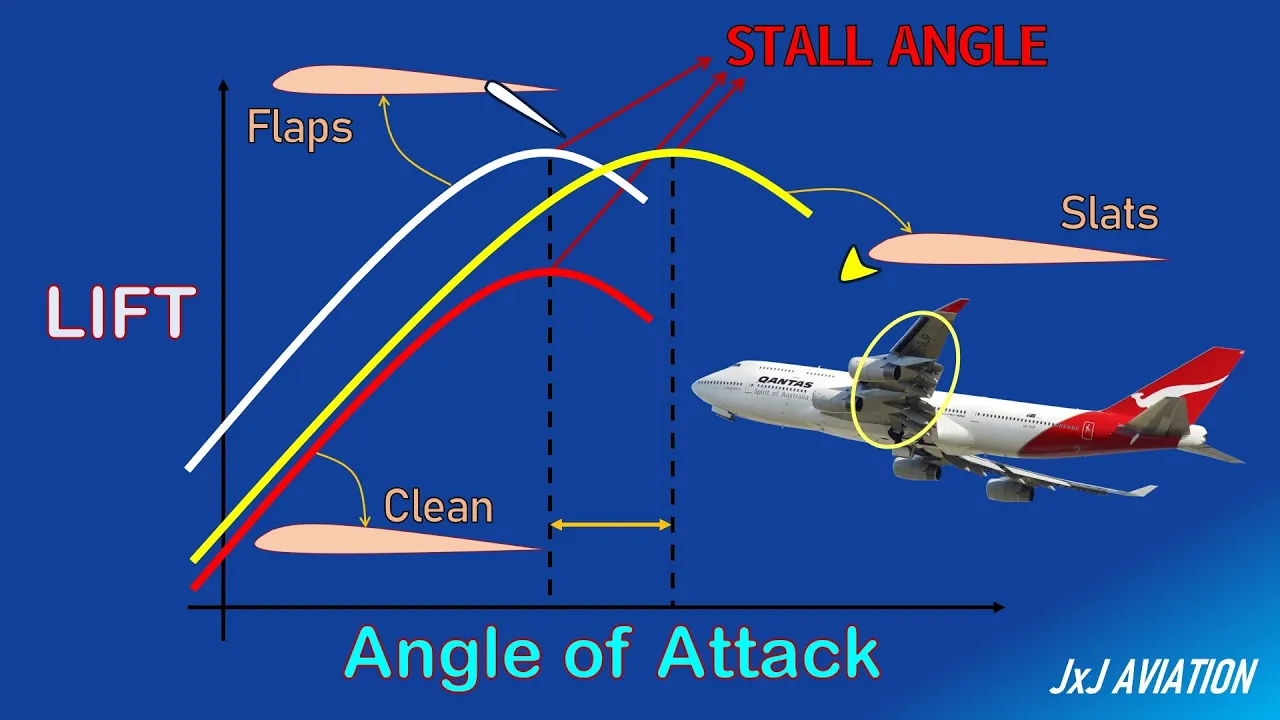
What are High Lift Devices? | Impact of High Lift Devices on an Aircraft Operation | Flaps & Slats
40.9K
High lift devices (flaps and slats) are wing-mounted surfaces that increase lift at low speeds during takeoff and landing; flaps extend from the trailing edge to increase surface area and camber, while slats extend from the leading edge to create slots that delay airflow separation; flaps primarily increase lift without changing the stall angle, whereas slats increase both lift and the maximum achievable angle of attack before stall, allowing safe low-speed flight operations.
Click to watch →
Principles of Flight: Aerodynamics Explained for Pilots
784.5K
High-lift devices such as trailing edge flaps allow pilots to manipulate wing shape and increase lift and drag at low airspeeds. Flaps are particularly important during approach and landing phases. They enable steep descent angles without gaining airspeed and slower touchdown speeds. Initially, extending flaps increases lift significantly with minimal drag increase, but beyond approximately halfway extension, lift increases only slightly while drag increases rapidly.
Click to watch →
![Cosa sono flap e spoiler [Lez.10]](https://i.ytimg.com/vi_webp/l-Q9roRJIps/maxresdefault.webp)
Cosa sono flap e spoiler [Lez.10]
54.5K
Flaps and slats are high-lift devices that increase wing surface area and camber to generate more lift at lower speeds. Flaps are located on the trailing edge and extend downward, while slats are on the leading edge and extend forward. Both devices increase the angle of attack relative to the relative wind, lowering stall speed. However, they also significantly increase drag, which is why they are only used during takeoff and landing phases. The increased drag results in higher fuel consumption, making these devices unsuitable for cruise flight.
Click to watch →

The Only KSP Plane Tutorial You'll Ever Need
61.8K
Flaps are high-lift devices located on the trailing edge of wings that increase lift during slower flight phases (takeoff and landing). They work by dynamically changing the wing's shape to generate more lift. According to Newton's third law, generating lift creates equal and opposite drag on the flaps. While drag is generally undesirable, it helps bleed off excess speed during landing. During approach, pilots gradually increase flap settings, with each setting adding more deflection, lift, and drag. For takeoff, smaller flap settings are used to avoid excessive drag while still generating enough lift for liftoff.
Click to watch →

A Fateful Takeoff: The Tragic Saga of Northwest Airlines Flight #255 | Mayday: Air Disaster
1.3M
Investigators discovered that the MD-80's flaps and slats were never extended for takeoff, representing an astonishing blunder. Physical evidence from the left wing showed cables severed by the light pole impact, confirming the slats were fully retracted. The flight data recorder confirmed this configuration error. Flaps and slats are wing extensions that increase lift by expanding the wing surface area; they must be extended to specific positions (typically 11 degrees) for takeoff. Without them, the aircraft lacked sufficient lift to become airborne. This fundamental configuration error, combined with other factors, caused the crash.
Click to watch →
Lift vs Coeff
Testing Process
Lift vs Coeff
0:07- 1
Explains lift formula factors and dynamic pressure roles.
- 2
Coefficient combines wing shape and angle of attack.
Limitations of Quasi-Static Lift Coefficients in Unsteady Aerodynamics
While the traditional distinction between lift and the coefficient of lift (Cl) is foundational in steady-state aerodynamics, this classical framework has significant limitations in unsteady flight regimes, such as flapping-wing flight (insects and micro-air vehicles) or dynamic stall. The standard lift equation assumes Cl is a quasi-static function primarily dependent on the angle of attack. However, in highly unsteady flows, transient phenomena like leading-edge vortex generation, wake capture, and added mass forces dominate. Under these conditions, the static coefficient of lift fails to accurately predict lift because the flow state is highly time-dependent and history-dependent. Consequently, modern aerodynamics must often move beyond classical Cl representations to unsteady aerodynamic models that account for dynamic vortex shedding, showing that the standard lift coefficient model is a simplification that breaks down in complex, time-varying flight environments.
Basic understanding of the four forces of flight, particularly how aerodynamic lift acts on an aircraft.
The concept of dynamic pressure, including the roles of fluid density and flow velocity.
Fundamentals of airfoil geometry, specifically camber, chord line, and the angle of attack.
Basic algebraic skills and dimensional analysis to comprehend how dimensionless coefficients are derived.
Analyzing the Lift Coefficient vs. Angle of Attack curve (Cl-alpha curve) and identifying the stall point.
Exploring other aerodynamic coefficients, such as the drag coefficient (Cd) and the lift-to-drag ratio (L/D) for overall aerodynamic efficiency.
Understanding scaling laws in wind tunnel testing, specifically the roles of Reynolds number and Mach number.
Investigating how high-lift devices (like flaps and slats) physically alter the lift coefficient during takeoff and landing.
64.3K views2.2Klikes3:28@flightclubonlineOriginal Release: 2021-08-04
lift and the coefficient of lift are not the same thing in fact coefficient of lift is an element of the formula that determines lift so if lift is a force that opposes weight and holds the airplane in the air then what is the coefficient of lift by running experiments on wings it's been shown that lift depends on several factors these factors are wing shape angle of attack air density free stream velocity and the wing surface area so how do these factors fit inside the lift formula air density and the free stream velocity combined together form the expression for dynamic pressure this is like kinetic energy of the relative airflow and it fits perfectly here wing surface area goes here now we are left with wing shape and angle of attack it just happens that wing shape and angle of attack are the two factors that form the coefficient of lift let's assume that the wing shape is fixed if we lock a certain value for wing shape this means that any change in the coefficient of lift can only be due to the change in the angle of attack let's rearrange the lift formula to determine the coefficient of lift now let's take a slice of a wing shape and run a wind tunnel experiment on it in the wind tunnel this is what we can measure we can measure lift we can measure air density and the free stream velocity we can also measure the wing's surface area all these measurements plugged into the formula can reveal a value for the coefficient of lift by taking the measurements at each angle of attack we can plot a graph that looks something like this unlike lift the coefficient of lift is a dimensionless quantity that has no units like pounds or newtons coefficient of lift is a value that allows us to compare the wing's lifting ability at a given angle of attack for example at 16 degrees angle of attack the lifting ability of this wing is at maximum just before it stalls this is how the coefficient of lift is determined it's part of the design and testing process and it's specific to every wing design you
Up Next
7:10
Poiseuille's Equation Explained: Blood Flow & Viscosity
@AKLECTURES
152.9K views•2013-09-25

12:53
21cm Hyperfine Transition in Neutral Hydrogen: Radio Astronomy Basics
@AaronRobertParsons
12.4K views•2011-10-13

1:52
Critical Mach Number Explained: Key Concepts for Aviation Enthusiasts
@flightclubonline
90.6K views•2021-09-15

27:14
Entropy and the Second Law of Thermodynamics Explained
@veritasium
27.5M views•2023-07-01
Related Study Plans & Knowledge Roadmaps
Structured learning paths in Physics
physics
Nuclear Physics (Decay, Fission & Reactors)
01Atomic Structure and the Binding Force
02Radioactive Decay and Half-Life
03Nuclear Fission Mechanics and Chain Reactions
+ 2 more learning modules
12h5 modules
Explore Roadmap
physics
Soft Matter (Polymers, Colloids & Rheology)
01Foundations of Soft Matter & Thermal Forces
02Polymer Physics and Macromolecules
03Colloids, Surfactants, and Self-Assembly
+ 2 more learning modules
38h5 modules
Explore Roadmap
physics
Analytical Mechanics: Lagrangian & Hamiltonian
01Mathematical Foundations: Calculus of Variations
02From Newtonian Mechanics to Constraint Dynamics
03The Principle of Least Action & Lagrangian Mechanics
+ 3 more learning modules
28h6 modules
Explore Roadmap
physics
General Relativity (Spacetime & Cosmology)
01Foundations of Relativity: Special Relativity
02The Geometry of Spacetime: Equivalence Principle & Curvature
03Einstein's Field Equations: The Mathematics of Gravity
+ 2 more learning modules
55h5 modules
Explore Roadmap