


















This video demonstrates how to interpret pulmonary function tests (PFTs) by analyzing flow-volume loops and spirometry data to diagnose respiratory conditions. Key diagnostic patterns include: obstructive disease characterized by a low FEV1/FVC ratio, air trapping (elevated residual volume), and concave flow-volume curves; restrictive disease showing normal or elevated FEV1/FVC ratio with reduced vital capacity and total lung capacity; combined obstructive-restrictive patterns seen in conditions like COPD with obesity; and intrinsic restrictive lung disease distinguished by disproportionately low diffusion capacity. The instructor guides viewers through 12 practice problems, explaining how to recognize these patterns and select appropriate diagnoses based on clinical findings.
PFT Interpretation Part 4: 12 Practice Cases with Answers
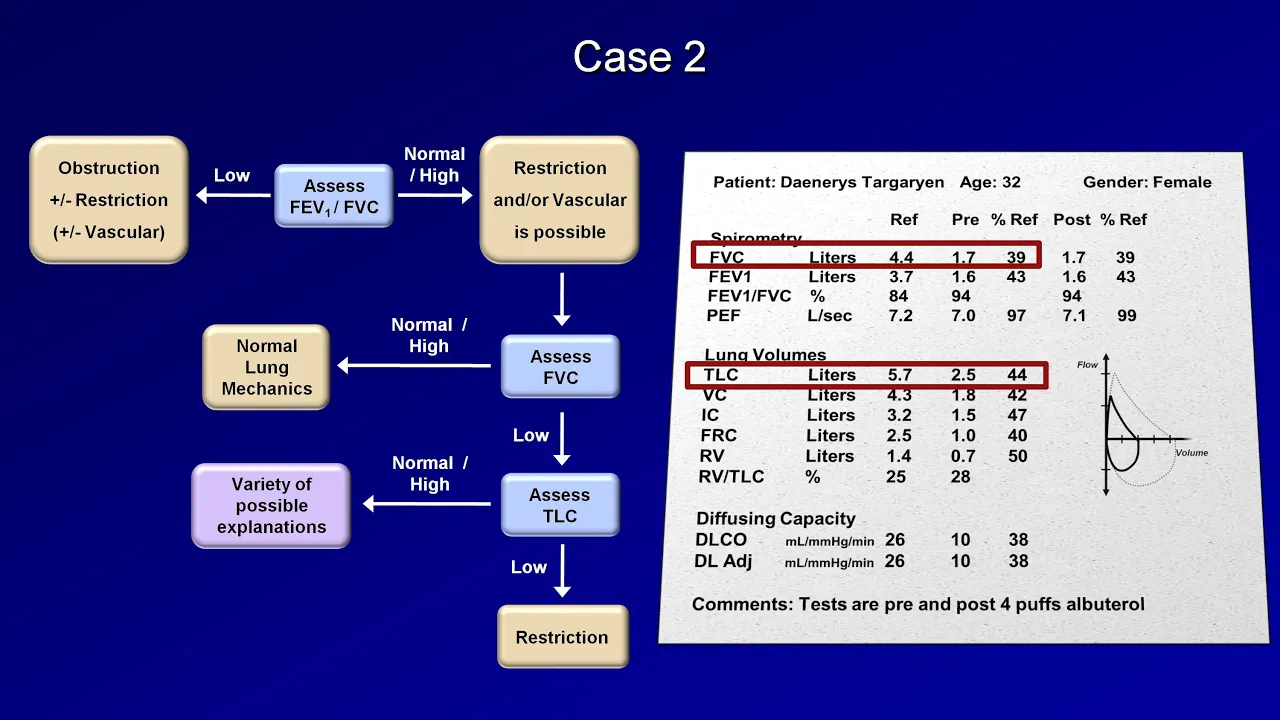
Added:this is Pete Sloan presenting part four and the last part of my four-part series on basic interpretation of pulmonary function tests in this part I'd like to go over 12 practice questions followed by explanation of the answers and at the end of this section there is an answer key now I divided this section into two areas or two parts the first part I'll simply show you the questions in case you wanted to try these on your own I plan to stop for only about 5 Seconds between each slide because I really don't know how long you're going to be looking at each slide but feel free to pause the playback to solve the question so the first question is listed here there are spirograms on the upper left flow volume curves a table of their PFT data and a choice of 12 answers choose the best answer that fits the pattern of the spirometry flow volume curve and the table don't forget you can pause if you'd like to look a little bit longer second question third question fourth question question five question six question seven question 8 question nine question 10 question 11 and the final question I assume it took you a whole lot longer to review these questions and think of the best answer than I just click through and I'm really hoping you tried to answer these on your own you really should have enough information from my talk to um answer the questions without cheating and looking ahead so if you sort of cheated and looked ahead I encourage you to go back go through these one on your own take your time pause the recording and write down your best answers each of the 12 questions corresponds to one of the 12 best answers now for the exciting part the answers so I'd like to explain the answers to these practice questions question one in this example we have a good quality curve they seem to get to the end of the maneuver I didn't put the time scale 6 seconds there is no plateau of flow and the early 1 second volume is a small fraction of the total volume the flow volume curve has severe in coving consistent with obstruction so it's an obstructive disease the fev1 ratio is low showing its obstruction fe1 is critically low at 25% showing its severe obstruction residual volume is quite High showing there is severe air trapping and an elevated TLC so this is an a severe obstructive lung disease with air trapping a normal diffusion capacity matches B severe asthma the best severe COPD would have a low diffusion capacity question two this is a curve that is a normal shaped curve no in coving doesn't look obstruct but it's small consistent with restriction the spirogram plateaus early but lower than the vle capacity so this looks like a restriction problem we look at the values the ratio is normal or elevated even suggesting no obstruction a low vle capacity in the absence of obstruction is suggestive of restriction restriction is confirmed by the critically low total lung capacity at 52% % the diffusion capacity is also low at 133% so there is restrictive disease that proportionately drops the diffusion capacity and the TLC together in the same proportion the diffusion corrected to for the total lung capacity is normal indicating healthy lungs squeezed into small quarters Erv is high suggesting that this is likely not obesity related so we're looking for healthy lungs squeezed into small quarters in the absence of obesity and the best answer is e severe kyphoscoliosis the curvature of the spine is re extrinsically restricting the lungs practice question three in this example no values are shown just the flow volume Loop and the spirogram the normal value or the normal curves are shown in white the expiratory phase is completely normal and on inspiration there seems to be a flow cut off where there's a sort of Maximum flow and a squaring of the inspiratory flow on the on the spirogram the flow seems to reach a maximum Peak or negative flow and then it stays constant with a straight line of volume versus time so the flow is constant when this line is straight As signified by an unchanging flow in this range of volumes an illness that causes inspiratory cut off of flow is consistent with upper Airway obstruction and the best answer in this example is vocal cord paralysis question number four in this case there seems to be a pattern of very small lungs with very slight in coving this very small amount of in coving does not seem to go along with severe uh obstruction and Mild obstruction would generally not make the lungs so small when we look at the numbers we see what's going on better the low F1 ratio sign signifies some obstruction but the very low V total lung capacity indicates restriction so in this example it's combin of obstruction and restriction the best example in the list that has both obstruction and restriction is a COPD patient with morbid obesity D question number five shows a patient who has normal looking flow volume Loop except the curve is too small indicating restriction from a spirometry point of view the patient quickly gets up to their vital capacity but their vital capacity falls short of the normal vital capacity there does not seem to be any obstruction we look at the numbers F1 ratio is above normal showing absolutely no obstruction however the vle capacity is low in the absence of obstruction indicating probable restriction restriction is confirmed by a low total L capacity the diffusion capacity is proportionately low also at about 50% just like TLC such that the diffusion capacity when accounting for the TLC is back to normal indicating not enough lung but healthy lung in this Example The expiratory Reserve volume is critically low so we're looking for an extrinsic restricted patient with a low Erv and strong muscles that is most consistent with severe obesity in severe obesity the expiratory reserve volume is particularly low compared to other values and the neuromuscular strength is preserved question six in this question the patient we just I'm only showing the spirogram and the flow volume curve let's look at the spirogram the patient has a constant flow it's not increasing it's sort of a straight line and then suddenly the flow increases the flow goes down to zero it increases again and it goes down the erratic flow behavior is seen better in the flow volume curve where the flow goes up and down and then it goes back up goes all the way down to zero and goes back up and down well you really don't need to look at this too long to realize that this is a very poor study technically speaking and would not be reproducible and must be interpreted with caution so we would rate this answer best at I poorly reproducible values measur by spirometry are likely underestimated meaning that the F1 is likely higher than the first second volume right about over here and the vital capacity itself can even be higher than here we don't really trust that this patient really finished the maneuver properly question number seven in this example we see severe obstruction in fact we saw this curve earlier on the first example where we saw a severe asmatic the obstruction is confirmed by a very low fe1 ratio and air trapping with an elevated RV and TLC however unlike the severe asmatic who had a diffusion capacity of 105% this patient has a diffusion capacity of 25% which stays quite low even when corrected for the total L capacity consistent with C severe COPD in this example we've already seen the spirogram and flow volume curve for restriction no obstruction yes restriction so that's confirmed by an normal or above normal ratio of F1 to FC indicating absence of obstruction and a low vle capacity again restriction is confirmed by the total lung capacity being low but in this case the diffusion capacity is even lower than the total lung capacity indicating not extrinsic disease but instead intrinsic lung disease something that is making diffusion capacity go down even lower than the actual restriction of the lung so that the diffusion capacity when accounting for the lung volume remains low this patient has a normal expiratory Reserve volume because this is not obesity and their negative inspiratory force is normal indicating this is not a weakness problem like neuromuscular weakness so we're looking for a restrictive lung disease that disproportionately affects the diffusion capacity this is an example of intrinsic lung disease frequently intitial lung disease and the best example in this whole list of intitial lung disease is f severe ipf in this example the flow volume curve is slightly indented and there's a late plateau and a low F1 but not a low vital capacity the vital capacity is almost normal F1 is low and there's mild obstruction in the presence of very mild air trapping with a slightly high TLC maybe that's normal at 102% but the residual volume is high so there's some air trapping normal diffusion capacity this is similar to the first problem I showed you which was severe asthma but in this case the curves are not too affected and the fv1 is only mildly suppressed so rather than the first answer on problem number one which we said was severe asthma when the fv1 was 1 liter this is an example of mild asthma same pattern as the first question just much less severe question 10 in this problem there are no numbers given just the curves on the flow on the spirogram there seems to be constant flow in the middle of expiration and inspiration on the flow volume curve there's a cut off of flow both on inspiration and on exhalation we see a fixed upper Airway obstruction in diseases such as K tracheal stenosis which is the best answer question number 11 we've recognized this pattern now as restriction with no obstruction confirmed by a normal ratio and the fact that the TLC and diffusion are down together at 52% once again means that this is some sort of non-intestinal process the lungs are healthy they're just small why are they small they have a low Erv which can be seen in obesity but also a low Erv can be seen in neuromuscular weakness this example is very similar to the Obesity all of the numbers I used are the same except the negative inspiratory force is only 25% of predicted which is consistent with uh answer H which is neuromuscular weakness such as myasthenia gravis or guon Beret or something along those lines final question in this question no spirograms or flow volume Loops are shown just numbers which are all normal except for the diffusion capacity is low and that's disproportionate to a normal TLC something is making the diffusion capacity go down in someone whose lung functions are otherwise fairly normal we call this an isolated lung diffusion capacity deficit and this is consistent with pulmonary vascular disease such as vasculitis or chronic pulmonary emilii in this list of answers the best answer is L chronic pulmonary emilii here's your answer key and I want to thank you if you made it to the end of these four Le cures I very much appreciate um I designed these talks from my medical students and residents in Baltimore but um if you're seeing this in any other venue I hope this was helpful to you would appreciate any feedback uh this is Peter Sloan um finished a four-part series on pulmonary function tests interpretation take care
Up Next
Pulmonary Function Test Interpretation: A Step-by-Step Guide
@Medcram
206.3K views•2014-12-20

Memory and Long-Term Potentiation | Physiology | MBBS Exam Prep
@doctutorialsmbbs
307 views•2025-08-27

Neuroanatomy: Central and Peripheral Nervous System Divisions Explained
@AKLECTURES
136.2K views•2014-09-20
Stages of Labor and Vaginal Birth | Childbirth Animation
@nucleusmedicalmedia
52.1M views•2017-08-18
Related Study Plans & Knowledge Roadmaps
Structured learning paths in Medicine