











![The Incredible Story of the Milky Way Galaxy [4K]](https://i.ytimg.com/vi_webp/sDuZiimfSQU/maxresdefault.webp)
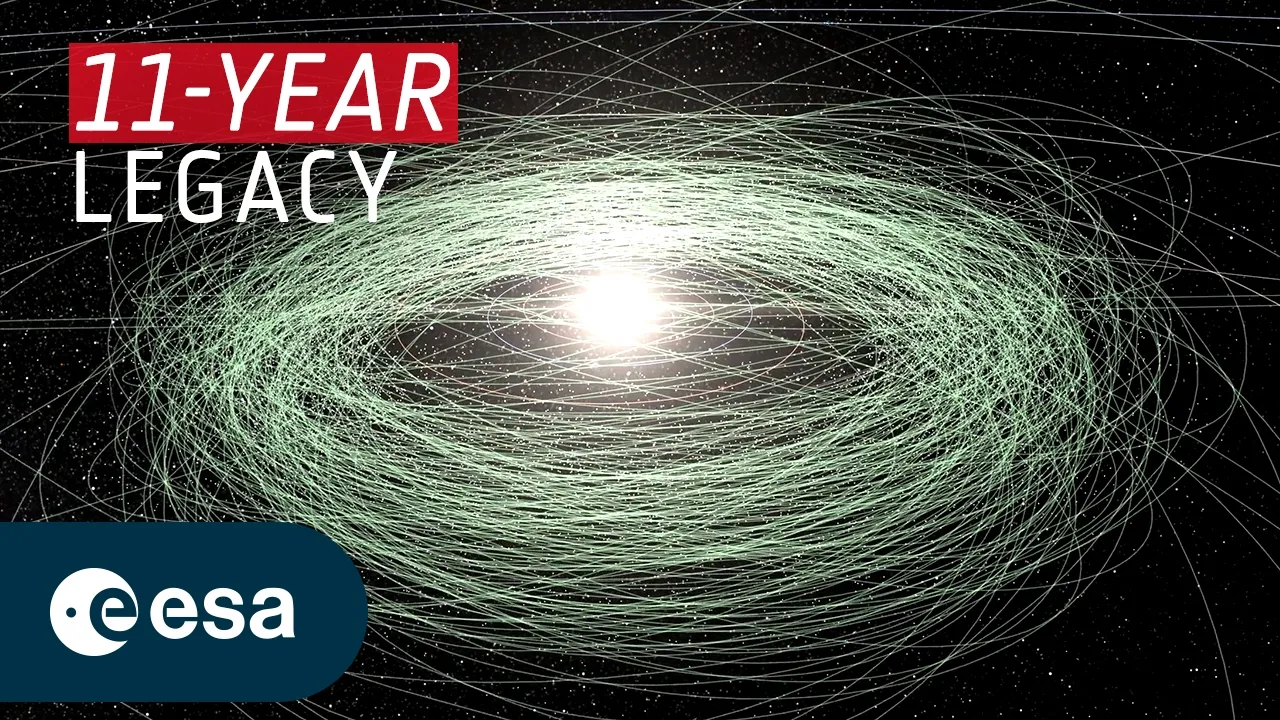





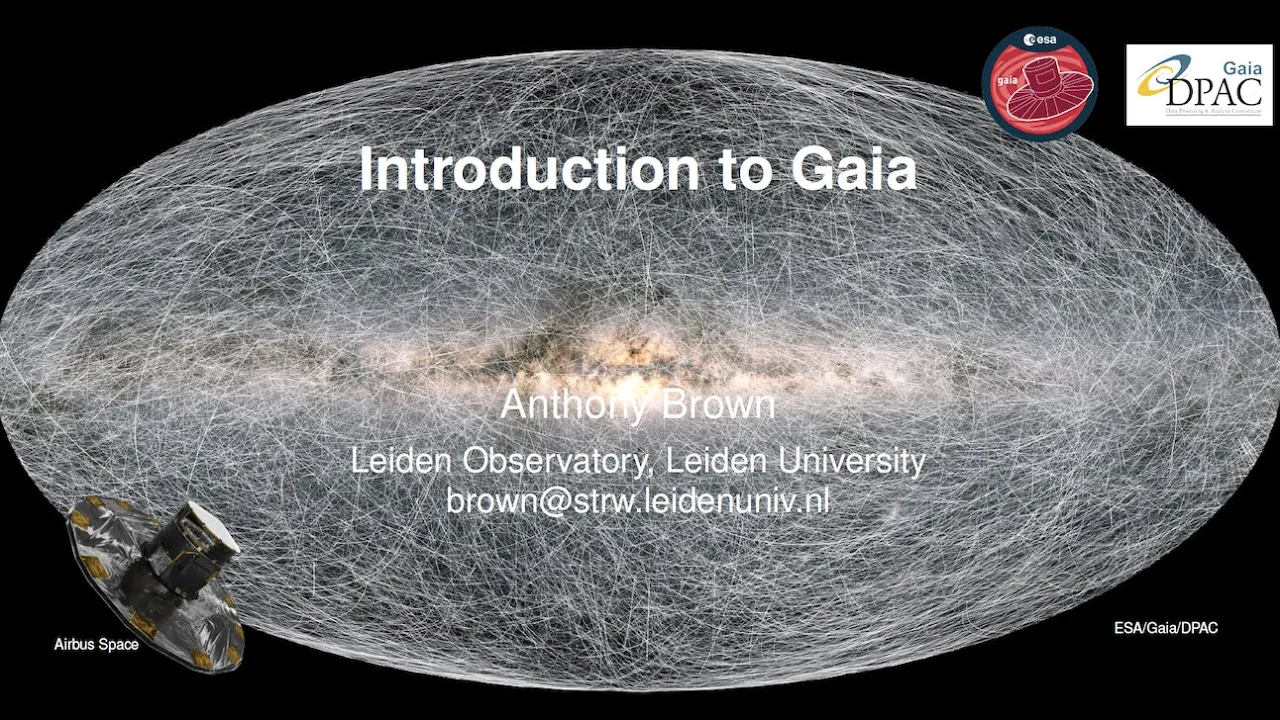


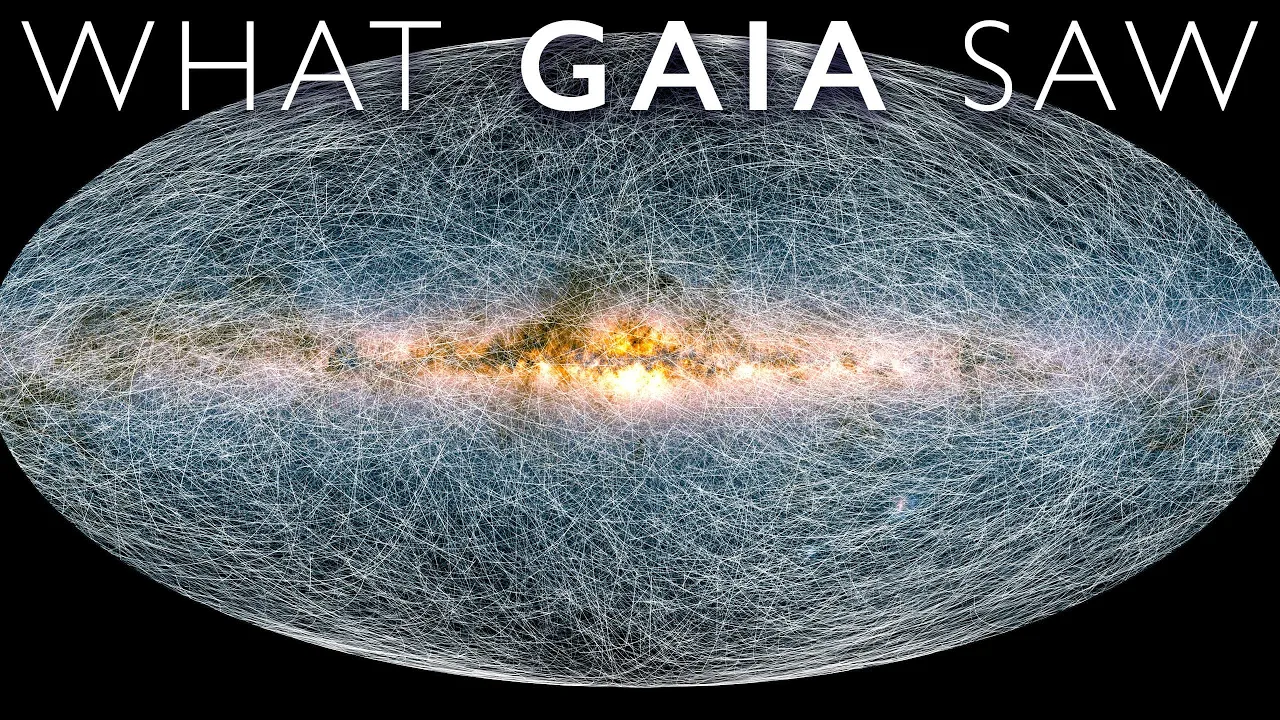
The European Space Agency's Gaia mission, launched in 2013, has created the most comprehensive 3D map of our galaxy by precisely measuring the positions, distances, and velocities of nearly 1.7 billion stars using stellar parallax and Doppler shifts, enabling astronomers to study stellar evolution, galactic dynamics, and even detect exoplanets and dark matter substructures.
Gaia Mission: Revolutionizing Our Understanding of the Milky Way
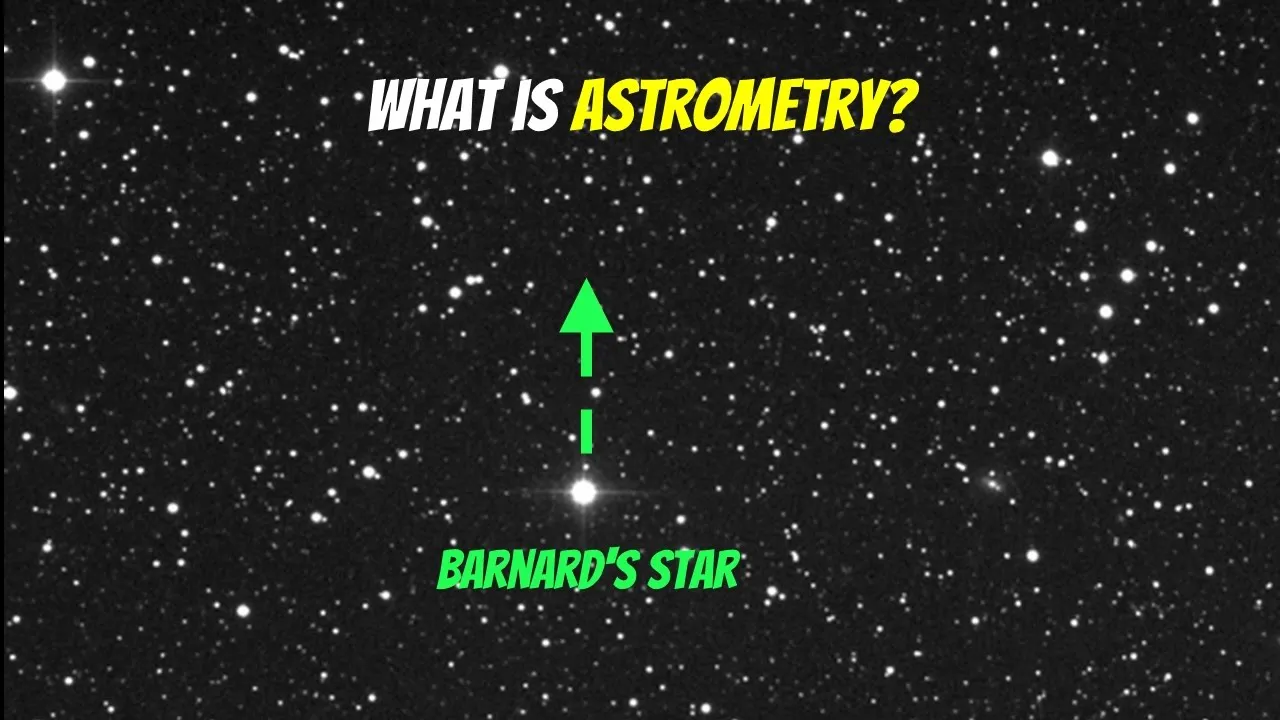
Added:Understanding the basics of astrometry, specifically how astronomers measure the positions, distances, and movements of celestial bodies.
Familiarity with the structure of the Milky Way galaxy, including its key components like the disk, bulge, halo, and spiral arms.
Knowledge of stellar parallax and proper motion, which are the fundamental geometric techniques used to determine cosmic distances and velocities.
A basic concept of dark matter and how its gravitational effects are inferred through the rotational velocities of stars in galaxies.
Exploration of 'Galactic Archeology,' studying how Gaia data is used to reconstruct the assembly history and past merger events of the Milky Way, such as the Gaia-Sausage-Enceladus collision.
Advanced studies in stellar evolution models, utilizing Gaia's high-precision Hertzsprung-Russell diagrams to refine the ages and lifecycles of diverse star populations.
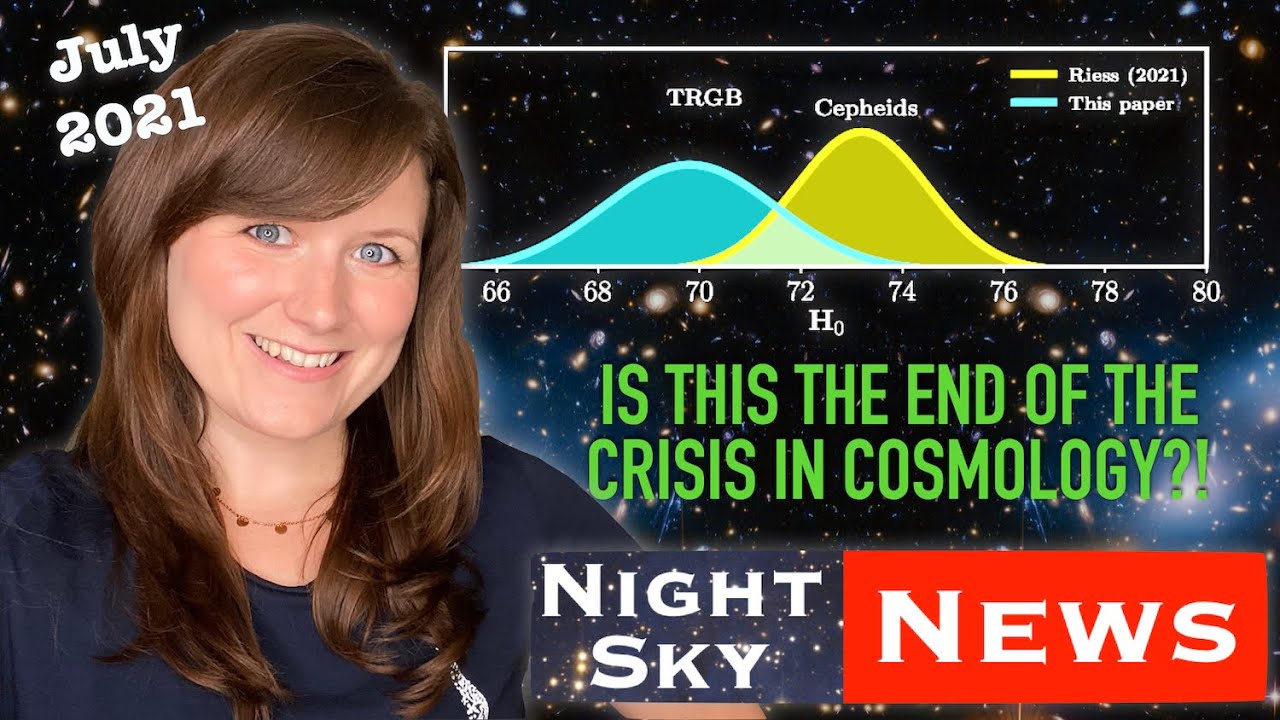
Investigating the calibration of the Cosmic Distance Ladder, specifically how Gaia's precise parallaxes help resolve the Hubble tension by refining distance measurements to Cepheid variables.
Hands-on astronomical data science, learning how to query and analyze Gaia's public databases (like DR3) using Python and Astronomical Data Query Language (ADQL).
429K views11.2Klikes10:45Original Release: 2018-05-09
The great advances in any science tend to come in sudden leaps April 25th of 2018 marks the beginning of just such a leap for much of astronomy.
In the early hours of the morning the Gaia mission second data release dropped.
Our understanding of our own galaxy will never be the same again.
The Gaia satellite was launched in late 2013 entirely built and operated by the European Space Agency Its primary goal is to map the stars of the Milky Way with a scale and precision orders of magnitude greater than ever before.
Gaia's predecessor, Hipparcos, catalogued 120,000 stars.
Gaia blows this out of the water with positions colors and brightnesses of nearly 1.7 billion stars.
Gaia can see orders of magnitude fainter and further away than previous missions but its greatest superpower is its precise astrometry.
Gaia can pin down a star's position to the equivalent of a human hair's width at a thousand kilometers That's one to two thousand times smaller than the resolution of the Hubble Space Telescope As we'll see this precision allows Gaia to measure true distances and true velocities for 1.3 billion of its stars.
The result is a 3D dynamical atlas of our quadrant of the galaxy, an atlas that we can wind both forwards and backwards in time.
Let's start with distances. How does Gaia measure these?
The spacecraft orbits the Sun at Lagrange point two, tracking the Earth's orbit, but 1.5 million kilometers further from the Sun, from there It stares outwards to the galaxy.
As it traverses its orbit Gaia detects the tiny shifts in the positions of stars due to this motion, a phenomenon called stellar parallax.
It's just like the way your finger moves relative to the background when you wink your eyes back and forth and the degree of motion depends on this distance Gaia's winks are the size of its entire orbit.
Coupled with its incredible position measurements this enables Gaia to mesure distances to stars as far away as the galactic center.
Knowing the distance to a star is critical for determining its other physical properties, for example combining distance with the star's apparent brightness gives us it's true luminosity, and Gaia measures brightness with incredible accuracy.
It measures brightness in both the red and blue parts of the electromagnetic spectrum, now, combining those gives us the color of the star which in turn gives us its surface temperature.
The combination of stellar luminosity and surface temperature has incredible diagnostic power.
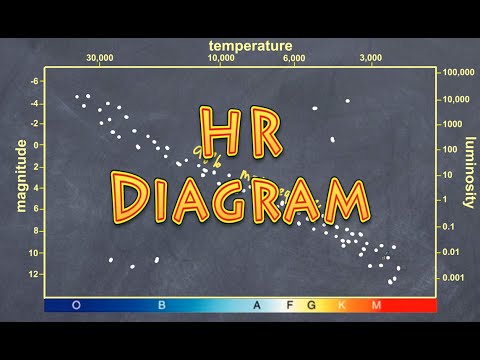
We often plot these properties against each other in a Hertzsprung–Russell or H-R diagram.
Location on this diagram can tell us about a star's mass, size, fusion activity and even its past and future evolution For example, stars on this diagonal band, the so called main sequence, are in the primes of their lives, fusing hydrogen into helium after which, low mass stars will become red giants before leaving behind, white dwarf remnants So let's take a look at the Gaia H-R diagram. It's pretty incredible.
For the first time we have a complete census of the stellar population far beyond the neighborhood of the Sun.
Compare it to the H-R diagram of Hipparchos, and we now see the main sequence extending down to include extremely faint red dwarfs. We also see the full sequence of faint white dwarfs showing the paths they follow as they slowly fade into blackness.
We see intricate details within that sequence, and unexpectedly clear separation of evolutionary paths that may reveal the composition and past life of the white dwarf.
We see hot newly formed white dwarfs some of which are still embedded in the nebula of gas ejected in the death of their star.
Looking at the red giants We resolved the shape of the so-called red clump in greater detail than ever before These are stars near the ends of their lives now burning helium in their cores We can even watch variable stars dent along the H-R diagram as their brightness's change the information Gaia provides will revolutionize our understanding of stellar formation and evolution We are barely getting started Okay, moving on to stellar velocities.
The galaxy is a dynamic place.
The stars all move in their own orbits around the galactic core that movement is imperceptible to the human eye even over many years It's imperceptible to most telescopes but Gaia's incredible astrometry revealed the changing positions of stars over the five years of its operation.
This give us the velocities of the stars in the plane of the sky.
A dedicated high-resolution spectrograph shows the tiny Doppler shift, the stretching or compression of the wavelengths of starlight due to the motion towards or away from us.
Combining motion on the sky and Doppler shift gives the full three-dimensional velocities for these billion stars.
And putting such complete velocity measurements together with our position data it's now possible to model the dynamics of the Milky Way with incredible detail.
On the large scale we see the distribution of stellar velocities through the spiral structure of our part of the Milky Way We can see the rotation of the Milky Way through the red and blue Doppler shift of the stars We can map things like stellar streams and detailed sub structure that tell us about the history of our galaxy's formation.
Astronomers have already found evidence in the Gaia data that our galaxy was disturbed hundreds of millions of years ago probably by an encounter with the Sagittarius dwarf spheroidal galaxy and mapping globular clusters and dwarf galaxy orbits Also tells us about future interactions with the Milky Way knowing the current velocities and positions of the stars we can actually wind the clocks backwards and forwards to see where they came from and where they're going.
For example: this is the field of stars of the planet hunting kepler telescope And this is how they travel to those locations over the past half million years And this is where they're going over the next half million We can now study the kinematics of stars that have cumulatively thousands of confirmed planets We can potentially trace the origins of these stars allowing us to find solar systems that came from the same stellar nurseries.
Also, by constraining the distances to stars We can get better measurement on the sizes of those stars, and thus also get better measures of the sizes of the planets around them.
Based on the new data we've already been able to confirm a gap in planetary radius size at around 1.9 earth radius.
We can even potentially detect exoplanets by looking at the stars radial velocities and measuring shifts due to a planet tagging on the star new binary star systems can also be found with these same methods This dynamical information will be a powerful tool in understanding the Dark Matter distribution of the galaxy for example: we can study stretched out groups of stars called stellar streams These dynamically connected flows of stars once bound together as a globular clusters of dwarf galaxies.
It's been hypothesized that disruptions in these flows are due to clumps of dark matter so-called sub halos The nature of sub halos and other details of Dark Matter's distribution could help us figure out what dark matter really is.
And, on top of all of this, Gaia doesn't only study stars.
It's tracked over 14,000 asteroids and other solar system objects and found many new ones.
This is useful for future asteroid mining missions and to identify potentially earth threatening objects.
Gaia has also mapped the position and brightnesses of over half a million quasars, the cause of distant active galaxies and it'll identify a hundred thousand supernovae.
Gaia even helps us with the pulsar timing array a galactic scale gravitational wave observatory which we spoke about recently it does this by providing better distance measurements to those pulsars Every generation we improve our maps, first our maps of the world and now our maps of the galaxy, filling in unexplored regions.
These maps help us to better understand our place in the universe.
This new map, Gaia's 3D atlas of the Milky Way, fills in so many of the dark gaps in our old understanding.
Every dot of light in this picture is a star with its past and future motion now known.
This is our Milky Way, and we just became much more familiar with our galactic home in space-time.
Last week we talked about the last stars that will shine in our universe, the humble red dwarf.
Souerman123 asks about the difference between a white dwarf and a red dwarf Astronomers are not the most imaginative at naming stuff.
A white dwarf is the remnant core of a low-to-mid mass star after it burns out and ejects its outer layers, leaving only that core.
White dwarfs aren't necessarily white, they start out blue and are expected to eventually fade through white to red to black, but we always call them white dwarfs.
Red dwarfs are just very low mass stars, they start out red but heat up over time and we expect them to pass through white and some to blue at the end of their lives, but we always call them red dwarfs, until they burn out, and then they're white dwarfs.
Makes perfect sense, right?
Many of you point out that there will be useful sources of energy in the universe long after the last red dwarf fades away.
A popular one seems to be rotating black holes or harvesting Hawking radiation from black holes.
It's a dismal future, super advanced civilizations clustered around black holes in an utterly dark universe.
Possible? Sure. Worth an episode?
Hell yeah, but if you can't wait Isaac Arthur's channel goes as deep into this stuff as you could hope to and then some.
Craig Harrison asks about the accuracy of the statement "the star that burns twice as bright burns half as long".
Shouldn't it be "burn exponentially shorter"?
Actually Eldon Tyrell had a decent grasp of hydro-static equilibrium and the continuity equation.
A star that burns twice as bright does burn half as long and actually slightly longer because that star will have a more massive core.
On the other hand a star that weighs twice as much as the Sun burns about 25 times brighter and burns out 10 times faster.
Obviously this is why the more massive Leon beat it before Pris and Roy.
Up Next

39:47
How Galaxy Rotation Curves Reveal Dark Matter
@matthewmalkan137
328 views•2025-03-16
61:17
First Billion Years of the Universe with the Square Kilometre Array
@iaaudc
121 views•2022-05-26
13:37
Starstuff: The Cosmic Origins of Elements and Supernova Chemistry
@pbsspacetime
480.3K views•2016-04-06
6:10
Gamma-Ray Bursts: Cosmic Snipers Explained | Astronomy
@kurzgesagt
15M views•2016-07-31
Related Study Plans & Knowledge Roadmaps
Structured learning paths in Astronomy
astronomy
Reionization: Pop III Stars, IGM & 21cm Line
01Foundations of Cosmology & the Early Universe
02Population III Stars & Cosmic Dawn
03Physical Mechanisms of Reionization
+ 2 more learning modules
17h5 modules
Explore Roadmap
astronomy
Planetary Rings: Dynamics, Roche & Resonances
01Foundations of Gravity and Orbital Mechanics
02Tidal Forces and the Roche Limit
03Structure, Composition, and Collisions
+ 2 more learning modules
10h5 modules
Explore Roadmap
astronomy
Asteroseismology: Stellar Waves, Ages & Cores
01Foundations of Stellar Astrophysics & Wave Mechanics
02Stellar Oscillation Modes: P-modes and G-modes
03Mathematical Framework of Asteroseismology
+ 2 more learning modules
35h5 modules
Explore Roadmap
astronomy
Adaptive Optics: Physics, Engineering & Control
01Foundations of Wave Optics and Wavefronts
02Atmospheric Turbulence & Optical Distortion
03Wavefront Sensing Technologies
+ 3 more learning modules
35h6 modules
Explore Roadmap