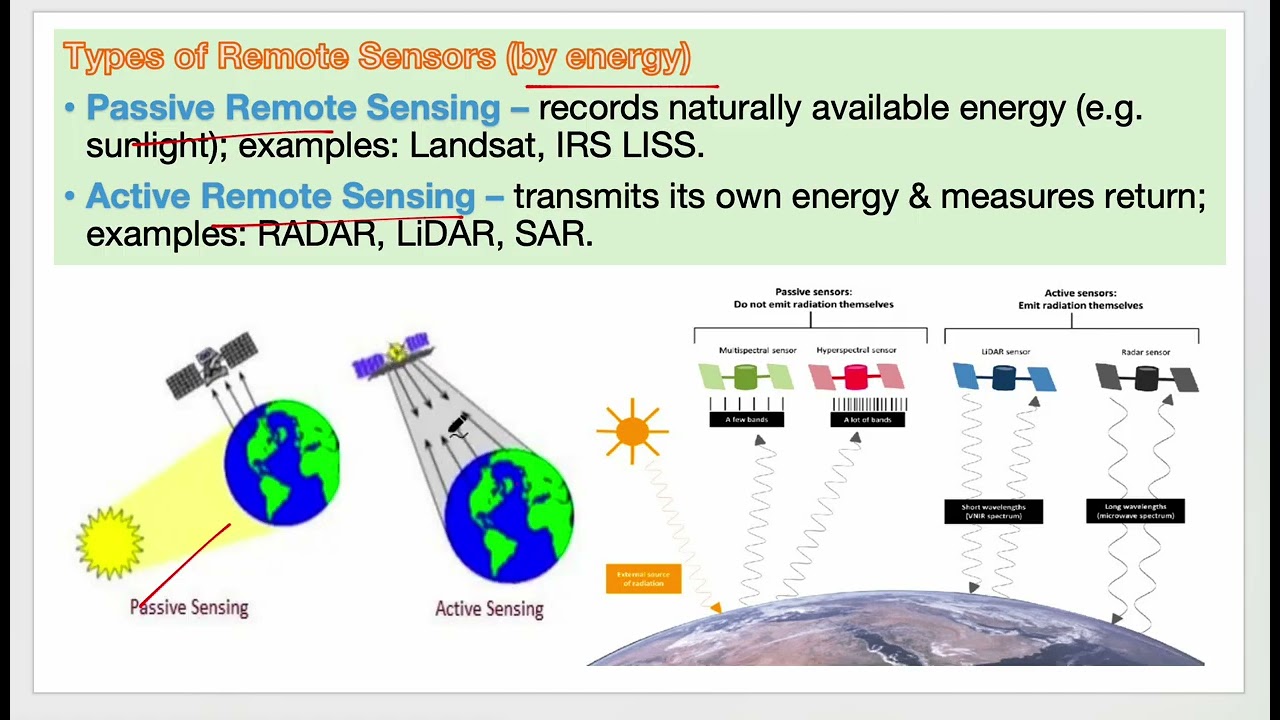




















Urban heat islands occur when cities experience significantly warmer temperatures than surrounding rural areas due to impervious surfaces (buildings, roads) with low albedo and high heat capacity that absorb and retain solar radiation, unlike natural surfaces (vegetation, water) that cool through evapotranspiration; satellite remote sensing using thermal infrared sensors (such as Landsat series, MODIS, ASTER, GOES, and Sentinel-3) enables large-scale monitoring of land surface temperature to map urban heat islands, with the statistical mono-window algorithm being a common method for converting satellite thermal infrared data to land surface temperature estimates, though each approach has trade-offs between spatial resolution, temporal frequency, and atmospheric correction requirements.
Mapping Urban Heat Islands with Landsat LST in Google Earth Engine
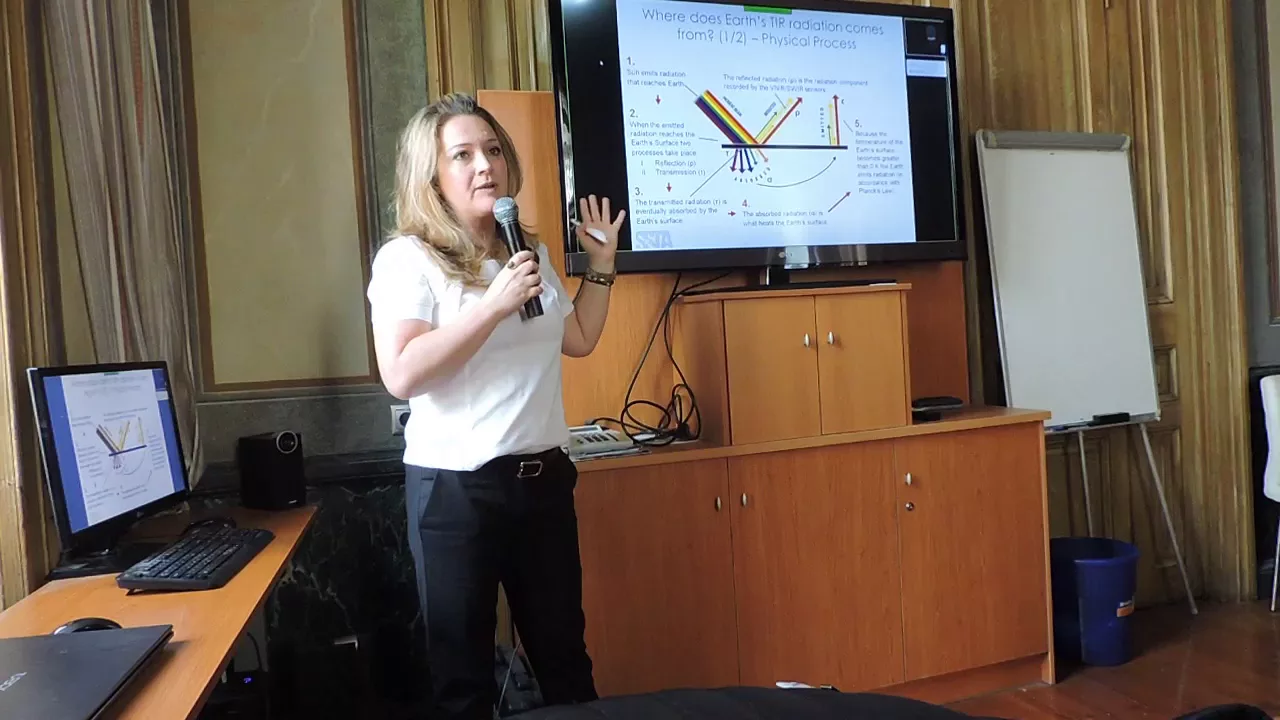
Added:good morning afternoon or evening wherever you are joining us from welcome to the rset training satellite remote sensing for urban heat islands my name is sean mccartney and i'll be co-leading today's training with my colleague dr amita mekhna this introductory training on urban heat islands will be over subsequent tuesdays in the month of november the first part of the webinar series covered today is focused on land surface temperature based urban heat island mapping we hope you will join us for all three parts of the webinar series over the course of the webinar series there will be three one and a half hour long sessions each tuesday that will include both a presentation and a question and answer session the same content will be presented at two different times each day for participants in different time zones the first session is at 10 am eastern time in the united states and the second at 4 pm eastern time please only sign up for and attend one session per day below is a link to the rset webpage for this training from the webpage you will be able to access the recordings presentations and homework for all three parts of this webinar series there will be one homework assignment due at the end of this training as stated in the previous slide you will be able to access the homework assignment from the webpage for this training the homework must be completed via google form the due date is tuesday december 1st a certificate will be awarded to those who attend all live webinars and complete the homework assignment by december 1st you will receive a certificate approximately two months after the completion of the course from marinas martin the prerequisites for this training are creating an account with google earth engine if you want to follow along with the demo as well as going through the fundamentals of remote sensing if you are interested in learning more about google earth engine we recommend exploring the tutorials provided at the link below the learning objectives for today's training are the following after participating in this training you should be able to summarize the characteristics causes and impacts of urban heat islands identify the satellites and sensors used in analyzing urban heat items replicate the steps of converting data from the landsat series of satellites to land surface temperature estimates using google earth engine and finally to recognize the limitations of satellite data for urban heat island analysis below is a list of abbreviations used throughout today's training for your reference i will now provide a brief overview of nasa's applied remote sensing training program the applied remote sensing training program or rset is part of nasa's applied sciences capacity building program ourset empowers the global community through both online and in-person remote sensing training thematic areas for trainings include water resources air quality disasters and land the goal of the rset program is to increase the use of earth science in decision making through training for professionals in the public and private sectors environmental managers as well as policy makers all our set materials are freely available to use and adapt for your curriculum if you use the methods and data presented in our set trainings please acknowledge the nasa applied remote sensing training program arsed is now in its 11th year of providing remote sensing training to increase the use of earth science in decision making over the past 11 years rsat has trained over 40 000 participants from over 170 countries and conducted over 140 trainings in air quality water resources land and disasters the circles in the graph correspond to the number of participants attending each rset training as shown the past few years have seen a marked increase in the number of participants following our trainings we are delighted to offer high quality trainings for specific applications in earth science and hope you will join the rset list serve to learn to learn more about upcoming trainings as they are offered now for an overview of the characteristics causes and impacts of urban heat islands an urban heat island occurs when a city experiences much warmer temperatures than outlying areas difference in temperature has to do with changes in radiative and thermal properties of impervious surfaces such as heat absorbing buildings and roads both rural and urban systems obtain energy from radiative processes gaining energy from the sun and subsequently losing energy back to the atmosphere in space natural surfaces are composed of vegetation and moisture trapping soils these natural surfaces use a relatively large proportion of the absorbed radiation in the evapotranspiration process and release water vapor that contributes to cool the air in their vicinity in contrast impervious surfaces such as buildings and roads are composed of a high percentage of non-reflective and water resistant construction materials as a consequence they tend to absorb a significant proportion of incident radiation which is released as heat the spatial distribution between water soils vegetation and impervious surfaces is what accounts for temperature variability within cities urban areas where impervious surfaces are highly concentrated and greenery is limited become islands of higher temperatures urban heat islands can form under a variety of conditions including during the day or night in small or large cities in suburban areas in northern or southern climates and in any season there are two types of urban heat islands which i will go into more details in the coming slides the first is the urban surface irving heat island which can be observed through satellite remote sensing the second is atmospheric or air urban heat island as we see in the diagram on the right surface temperatures vary more than atmospheric air temperatures during the day but they are generally similar at night daytime surface temperatures are depicted as a solid orange line in the graph and daytime atmospheric temperatures are depicted as a dashed orange line the dips and spikes in surface temperatures over the pond area show how water maintains a nearly constant temperature day and night because it does not absorb the sun's energy the same way as buildings and paved surfaces parks open land and bodies of water can create cooler areas within a city temperatures are typically lower at suburban rural borders than in downtown areas surface urban heat islands represent the radiative temperature difference between impervious and natural surfaces surface urban heat islands are present at all times of the day and night but are most intense during the day when the sun is shining the magnitude of surface urban heat islands varies with seasons due to changes in the sun's intensity as well as ground cover and weather as a result of such variation surface urban heat islands are typically largest in the summer surface urban heat islands are primarily measured through remote sensing which will go into much more detail later in this training warmer air in urban areas compared to cooler air in in swirl surroundings defines atmospheric urban heat islands atmospheric urban heat islands can be subdivided into canopy layer heat islands and boundary layer heat islands canopy layer heat islands exist in the layer of air where people live from the ground to below the tops of trees and roofs they are measured by in-situ sensors mounted on fixed meteorological stations or mobile traverses boundary layer heat islands start from the roof top and tree top level and extend up to the point where urban landscapes no longer influence the atmosphere this region typically typically extends to no more than one and a half kilometers from the surface boundary layer heat islands are measured by tall towers radio songs and aircraft canopy layer urban heat islands are the most commonly observed of the two types and are often the ones referred to in discussions of urban heat islands they are often weak during the late morning and throughout the day and become from and become more pronounced after sunset due to the slow release of heat from urban infrastructure now let's turn to the causes of urban heat islands properties as mentioned before of urban materials in particular albedo thermal emissivity and heat capacity influence urban heat island development as they determine how the sun's energy is reflected emitted and absorbed albedo is the percentage of solar energy reflected by a surface urban areas typically have surface materials such as asphalt concrete and brick which have a lower albedo than those in rural areas as a result urban areas generally reflect less and observe more of the sun's energy this absorbed heat increases surface temperatures and contributes to the formation of surface and atmospheric urban heat islands emissivity is a measure of a surface's ability to shed heat surfaces with high emittance values will stay cooler because they will release heat more readily another important property that influences heat island development is a material's heat capacity which refers to its ability to store heat many building materials such as steel brick and stone have higher heat capacities than rural materials such as dry soil and sand as a result cities are typically more effective at storing the sun's energy as heat within their infrastructure another cause of urban heat islands is due to reduced vegetation in urban areas trees and vegetation provide shade which helps lower surface temperatures they also help reduce air temperatures through evapotranspiration in which plants release water to the surroundings at this air dissipating ambient heat in most urban areas dry impervious surfaces predominate as cities develop more vegetation is lost and more surfaces are paved or covered with buildings the change in ground cover results in less shade and moisture to keep urban areas cool which contributes to elevated surface and air temperatures a third cause of urban heat islands is due to anthropogenic heat anthropogenic heat contributes to atmospheric heat islands and refers to heat produced by human activities it can come from a variety of sources and is estimated by totaling all the energy used for heating and cooling running appliances transportation and industrial processes anthropogenic heat varies throughout cities but can significantly contribute to heat island formation an additional factor that influences urban heat island development particularly at night is urban geometry which refers to the dimensions and spacing of buildings within a city urban geometry influences wind flow energy absorption and a given surface's ability to emit long wave radiation back to space two primary weather characteristics affect urban heat island development wind and cloud cover in general urban heat islands form during periods of calm winds and clear skies because these conditions maximize the amount of solar energy reaching urban surfaces and minimize the amount of heat that can be convected away conversely strong winds and cloud cover suppress urban heat outs lastly the geographic location of a city will be impacted by climate and topography large bodies of water can moderate temperature while nearby mountains can block wind or create wind patterns that pass through a city now that we've covered the characteristics and causes of urban heat islands we'll address why urban heat islands are a problem increased daytime surface temperatures reduced nighttime cooling and higher air pollution levels associated with urban heat islands can affect human health by contributing to general discomfort respiratory difficulties heat cramps and exhaustion non-fatal heat stroke and heat related mortality children older adults and those with existing health conditions are particularly at risk elevated summertime temperatures in cities increase energy demand for cooling and add pressure to the electricity grid during peak periods of demand which generally occur on hot summer weekday afternoons during extreme heat events which are exacerbated by urban heat islands the resulting demand for cooling can overload systems and require a utility to institute controlled rolling brownouts or blackouts to avoid power outages higher temperatures can increase energy demand which generally causes higher levels of air pollution and greenhouse gas emissions currently most electricity in the united states is produced from combusting fossil fuels these pollutants are harmful to human health and contribute to complex air quality problems such as acid rain and contribute to climate change in addition to increases in air emissions elevated air temperatures increase the rate of ground level ozone formation which is produced when nox and volatile organic compounds react in the presence of sunlight finally surface urban heat islands degrade water quality mainly by thermal pollution water temperature affects all aspects of aquatic life especially the metabolism and reproduction of many aquatic species when warm runoff from impervious surfaces flows into ponds wetlands rivers and lakes aquatic life can experience stress and shock when water temperatures reach a certain level as a reminder canopy layer heat island is the layer of air from the surface to the tops of the trees and buildings it is useful in mitigating public health risks since it is the best indicator of conditions experienced by people it is measured by in-situ sensors on fixed meteorological stations or traverses and by climate models to estimate temperatures in places where no field data are available due to limited monitoring stations measured canopy layer heat islands provide insufficient spatial detail for urban planning surface urban heat islands represent the difference of land surface temperature in urban relative to non-urban areas as well as hot spots within urban areas and are usually measured using satellite remote sensing satellite thermal remote sensing measures surface urban feed islands and provides consistent objective timely and repeatable observations of the earth's surface remote sensing offers the ability to study the urban thermal environment at various spatial scales from local to global and also temporal scales including diurnal seasonal and inter-annual i will now pass the presentation over to my colleague amita to tell us about satellites and sensors used in analyzing urban heat islands thank you sean so now in this section uh we're going to have an overview of satellites and sensors used in analyzing urban heat eyelines we will start with a very brief introduction to remote sensing of land surface temperatures or lsds which are used for monitoring urban heat island we will then look at a list of satellites and sensors which are relevant for estimating lsds and we will also look at land surface temperature data already derived from some of these satellites and readily available how to access these data sets is what we are going to look at then we will also look at a couple of ancillary data sets which can help in assessing vulnerability and impact of urban heat islands finally we will look at benefits and limitations of satellite measurements for monitoring urban heat islands so remote sensing of land surface temperatures we know that earth emits radiation in infrared wavelengths and as shown here in the spectrum it is the thermal infrared channel that is used the most for most commonly for lst estimation and that is between 8 to 15 micrometers if you look at this schematic diagram a satellite receives radiation at top of the atmosphere so it's called toa radiances so emitted by earth's surface attenuated by atmosphere and then it is received by the satellite so the toa radiances which are sensitive to land surface temperature they are affected also by land surface emissivity because from different surface types radiation is emitted at different rates and so if it is bare land or built up area or grass or forest or water it matters how much radiation will be emitted no matter what the temperature is emissibility is also important also the radiation emitted by the surface gets attenuated by the atmosphere because of water vapor and aerosols they absorb some of this radiation also the angle at which satellite sensor receives radiation intensity of that radiation depends on that also so in order to derive length surface temperatures all these factors have to be known here uh there's a spectrum shown from and the channels marked here are from goes-r which is a geostationary satellite and as you can see 10 11 12 all these are in thermal ir band up to 15.
however as you can see from here between 10 and 12 micrometers atmosphere is relatively transparent to infrared radiation so radiation emitted by the surface which depends on its temperature and emissivity most of it is received by the satellite so this window is quite popular generally used for deriving lsds there are references given here which provide details of several methodologies that are used in deriving lsds from infrared radiation sometimes one channel is used sometimes multiple channels are used and there are also methodologies which derive emissivity and temperature for surface styles simultaneously so we recommend that you look at the references for details there are several polar and geostationary satellites which have been flying with sensors that have thermal infrared uh bands in them and so that is what we are going to review next okay so here so satellites and sensors uh we're estimating lsds satellite sensors and their temporal coverage they're shown here to start with this landsat series four five seven and eight all of them had sensors uh with uh infrared channels such as thematic mapper on four and five etm plus or enhanced thematic mapper on seven and thermal infrared sensor or tirs on landsat 8.
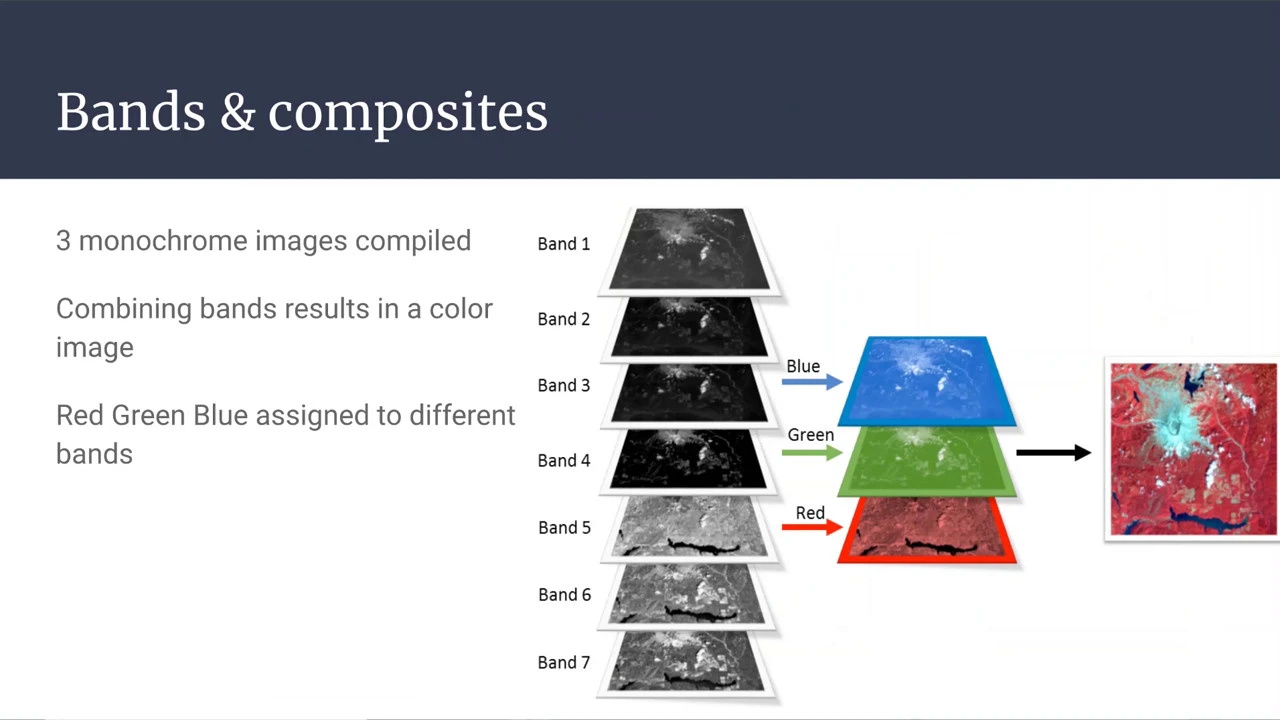
there is also an operational lan imager in ole and there are also other channels in these instruments which help in deriving land cover which is really useful in understanding emissivity from the surface so there are additional sensors as well in addition to these tir channels as you can see landsat 4 was launched in july 1982 so between four and eight uh these measurements are available from mid-july all the way to present also there is landsat 9 plant which will be launched and so these measurements will continue two other satellites which are also relatively long-term that terra and aqua they both have a moderate resolution imaging spectral radiometer or modis on terrain aqua in addition tera has advanced spaceborne thermal emission and reflection radiometer or ester all all these instruments they have thermal ir channels and as you can see these data sets span more than 15 years this is almost 20 years now 1999 december and this is april 2002 one of the recent missions which is called ecostress or ecosystem space bomb thermal radiometer experiment on space station so that is flying on international space station and there is a hyperspectral uh instrument it's called prototype high speedy thermal infrared radiometer or phi tir this instrument um this was launched in 2018 june and it has been flying okay there are additional satellites uh so these satellites are all nasa satellites these are um some sensors are derived i mean they're developed by nasa and nova and some of these satellites are from noaa as well as from european space agencies but they also have thermal ir bends and they are used for lst estimation so sumi national polar partnership or nspp and joint polar satellite system these are noaa satellites they have visible infrared imaging radiometers suite that's weirs it's been flying since october 2011 and continue still present nova operational satellites the current missions are 15 18 19 and 20 which is jpss they have advanced very high resolution radiometer or avhrr that has a long-term coverage uh starting from first no operational satellites so in 79 to present it extends also european space agencies meteor a and b they carry avhrr as well nova series of geostationary operational environmental satellites or goes they these satellites have been flying one after another since mid seventies and earlier satellites had imager and sounder in infrared visible channels including thermal ir bands the current satellites go 16 and 17 they have advanced baseline imager and this can be this has been used for deriving lsds finally european space agency has sentiment 3a and 3b has c and land surface temperature radiometer or slstr this has been flying uh two satellites launched respectively in 2016 february and 18 april they have been flying since then um also there's sentinel-2a and 2b they have multi-spectral instrument or msi relatively high resolution instrument this does not have thermal ir channels but this has channels which can be used again for looking at land cover and so look for land cover land emissivity emissivity this instrument can be used just to uh go over what types of satellites these are so landsat series of uh satellites that polar orbiting satellites are going from pole to pole that the spots are shown here the local time of observation is 10 am pm and swath width is 185 kilometers terra and aqua which carry modi's they the modi swath is about 23 30 kilometers and the orbits are such that observation time is 10 30 am pm for terra and 1 30 am pm for aqua ester is on terra and has what width of 60 kilometers high resolution uh instrument this is iss ecostress international space station ecostress has a swath width varying between 385 to 415 kilometers and has varying temporal satellite samplings depending on how the orbit is also these data are available over the u.s alone snpp and jpss veers has a very broad swath 300 kilometer 3000 kilometers and the time of observations is 1 30 am pm uh there is no one thing about weirs is that there is no gaps between swats there is um continuous coverage uh as opposed to say landsat and modis where you do see these black areas between swamps nova operational satellites are also polar satellites they are in 2 am pm orbits uh this nova 19 particularly many of them they have different time of orbits but this one is at 2 am pm swath is 2 900 kilometers okay now goes is the geostationary satellite that we talked about a long time the series there are two ghost satellites currently in orbit the one in east over atlantic is go 16 and west is 17 and as you can see geostationary satellites so they have observations of this full disc shown here so one centered here one centered here and because they go around with earth so they are constantly looking at this disks and their images can be quite frequent so it could could be every 10 minutes or 15 minutes in some cases sentinel 3 and sentinel 2 both are polar orbiting satellites in 10 and 10 30 am pm orbits respectively and swath width for sls tr is 740 kilometers whereas for msi is 290 kilometers so now these are the sensors and what is shown here is their temporal and special resolution now these slides or information about satellite sensors you can use them as a reference so if you are interested in using this data for lsa estimation you can go back and pick the sensor that is appropriate for you so landsat sensors tm etm plus and tirs they all have as you can see spectral bands between 10 and 12 and mode is same thing ester and this is the ecostress instrument this is hyperspectral has multiple bands between 8 and 12.
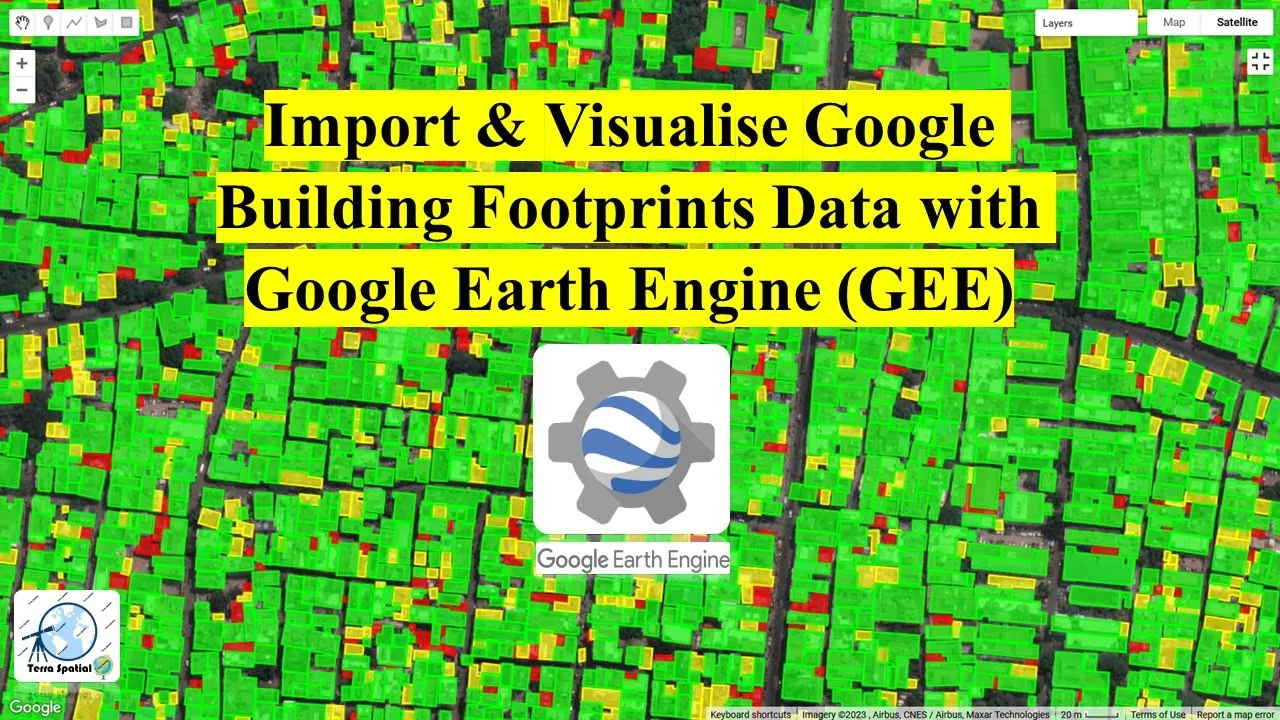
special resolution for landsat sensors are ranging from 30 meters to 100 meters so tmi tm and etm plus they have 120 meters 60 meters reservation but they are resampled at 30 meters and tirs is at 100 meters the temporal resolution for landsat is 16 days so every 16 day you get one image modis has relatively lower resolution it is one kilometer pixel and it's every 12 hours am pm esther has high resolution it's 90 meter pixel and that also is 12 hourly every twice a daily data uh ecostress 5tr they also has a 60 meter and this covers cornice only all these sensors have global coverage veers has resolution of 750 meters again it is twice daily av hr that has also one kilometer and four kilometer this also uh actually um same uh twice daily these are polar orbiting satellites um goes sounder and this advanced baseline imager they have two kilometer resolution and they have two different way they look at either just u.s continental u.s or a full disk image that we just saw and temporal resolution can be minutes hours to day so day and night so it's a continuous observations and slstr is one kilometer it's also twice daily also notice all of them have these thermal ir bands so they can be used for deriving lsds if you are interested in getting tir radiances top of atmosphere radiance is in these bands then these are the websites which um provide these radiances so for all the satellite sensors that we saw from landsat all the way to goes and sentinel data these websites can be visited to get radiance data what we want to show next is actually ready-made temperature product that you can get from some of these websites so before we do that though there are two websites that we want to point out this is nasa earth data and then this is usgs earth explorer and websites are given here um and so all the nasa satellite data that you you want to search for they can be found through earth data and or uscs earth explorer any data that you are looking for can be found from here or lsd related data can be found in usgs earth explorer also this is just for your information with that we will start with land surface temperature data products okay so landsat has already a landsat land surface temperature data product the website is given here with a lot of information there is a product guide here this is a provisional product as you can see here based on landsat 4 and 8 tir bands and uh this is only on the over the u.s they are derived over the u.s only right now 1982 to present and it also it uses land surface emissivity from esther and also ndvi data are used so these are normalized difference vegetation index this tells you what kind of surface it is whether it's bare surface or there is vegetation atmospheric profiles for atmospheric correction is used also and these data are available at 30 meter resolution so these are quite useful for looking at urban heat islands and can be obtained from earth explorer several of our set webinars have covered earth explorer usgs earth exporter site um and so basically you can pick data set spatial domain uh and temporal domain also a temporal uh range also here i've just picked washington dc for example and once you pick the data which satellite you want and dates you pick you can get a number of images that you can download so you search for data as landsat ard data and you get a number of parameters one of them is this provisional land surface temperature data that you can select that you can click and download there is also bulk download available from this site and you can save this data as stiff image and eventually you can analyze this in gis as is it shown here over dc this is 22nd august 2019 and it shows land surface temperature variations over the city in washington dc also notice that when you look at the data there are sometimes scale factors uh associated with it and this information is available from metadata along with the images that you can use to scale the data that's something to keep in mind for all the data sets to you use next it's the modis land surface data these are also derived products and um these are physically based algorithms you can look at this website for references uh also the methodology how it's derived since modis is a multi-spectral band instrument it also is used for um deriving both lsd and emissivity simultaneously resolution is one kilometer and again uh based on the extra temperature emissivity separation algorithm which is described here that is used uh coverage is global uh since 2000 and there are multiple products so these are from aqua terra and these are from aqua so mod is terra and myd is aqua so you have landsat land surface temperature and emissivity um daily five minute swaths you can have daily global one kilometer so during daytime and night time because there are twice available and then this is eight daily uh data so these data are available already and um they so we are going to see how to get that uh but weirs also has similar products uh which uh can extend this modi's time series uh so where's land surface temperature and emissivity are synergy synergistic with modis data products and similar algorithm is algorithm approach are used to derive these data only difference is that here this swath has 750 meter resolution everything else is one kilometer again you have day night and eight day images from veers as well ecostress land surface data um these are available only on the contra minus us and then they're key for understanding biomes and agricultural zones that's the objective of ecostress and that's why atmospherically corrected land surface temperature emissivity values are derived from this instrument or this mission this is the product name uh it's available now here the resolution is 70 meter as you can see here it's available since july 2018 the temporal resolution kind of varies depending on when international space station is going over a particular region now all modis wheels and ecostress temperature data land surface temperature data can be obtained by this site it's usgs appears and this rset webinar describes um how how to use appears that the details provided in here but basically there is a way to pick each of these data modifiers and echo stress you can search as land surface temperature here and you will see the list of all the products so this is product search you can have temporal subsetting and you can pick a special domain by drawing a polygon here or you can upload your own shape file to get data and different project different formats and projection are also available through here it's a very uh useful site to get all these land surface data okay finally ester land surface data that is available from the information is available here and the product ids so both land surface temperature and emissivity are available so these are the product ids you would search with that if you like um it's available since march 2000 at resolution of 90 meter so if you look at the resolutions landsat is 30 meters um ester is 90 meters ecostress is 70 meters so these are higher resolution sensors and the other sensors like modis wears um they have one kilometer resolution ester data can be accessed by this from this nasa earth data and there is a special subsetting and temporal selection also so going through this portal you can extract data and download you can search product by name and you will be able to download the data so these are all the nasa data now we're looking at nova operational geostationary data so goes um land surface temperatures are available from goes 16 and 17 the ready-made products available from these satellite two satellites um they are available at 10 kilometer resolution if you look at the full disk or two kilometer resolution over the cornice and so there is a noaa class site which provides this data uh here you can see um how you can this is the the site shown here where you can enter latitude longitude of your area of interest uh and you can pick temporal sub select subsetting also and this is land surface temperature from product type for conus or full disc you can pick one of these and so then you can download these data either from 16 or 17. again all the satellite and sensors we mentioned radiances are available for all of them but the products are available uh from the from landsat from terra and aqua terra ester ecostress snpp and jps as weirs and goes okay now so these are all the land surface data sets we saw a couple of ancillary data products that we want to mention here which can be very useful in looking at vulnerable vulnerability and impact of urban heat islands one such data set is population data set so this uh site cdac a socioeconomic data and application center has multiple data which can be used for looking at vulnerability so these are social economic data and population data are available for several years and as you can see this also has a way of you can download geotiff images you can subset this specially also and there are also other useful data sets such as global human built up and settlement extent area from the same site and there are global grid of um probabilities of urban expansion to 2030 so these are available if when you are looking at your urban heat islands united states census bureau has the socio-economic data and they're classified in many ways so population data you can see this is percent population about the age of 65 years which would be more vulnerable to extreme heat and similarly you have multiple way of stratifying population so this site can be used to get population data such global data set is also available from united nations world population dashboard and again here is the website you can again look at data set by age by gender by education level so these are global data sets that you can use so with that um this is the last part of this section the limitations already shown has mentioned uh some of those are are again shown here is that uh data acquisition types of sun synchronous satellites or polar orbiting satellites they don't coincide with the time of day when heat index could be or length surface temperature could be maximum or minimum um and resolution also can be a limiting factors for cities landsat um that only has like daytime data of course because it's um that's the only time it's available others have twice daily these are optical sensors so they cannot see through clouds so if it's very cloudy then you cannot see the surface and again atmospheric correction and surface immediately have to be known angle at which the radiances are received that has to be looked at too and it is difficult to obtain high spectral special temporal resolution with the same instrument so that but one can use multiple instruments as we see and and do combination to get sense of how lens surface temperature and urban heat island effect is changing so these are different types of data with different resolutions and sizes and formats so there's a little bit of effort involved in getting all the data set in the same format in your own region of interest but at the same time there are several benefits to using remote sensing data for urban heat islands first of all it provides continuous special coverage compared to in situ data and it provides where there is no there are no systematic in situ measurements available they can be used but if they are available they can augment the data sets as we will see in in our subsequent sessions next week and week after there are simultaneous observations of land surface temperature mecvt and land cover they are available from these sensors that we saw many of them provide global consistent data coverage such as landsat modis wears avhr these are all then global data um these are all open source data and as we pointed out there are so many websites and resources that can be used to access these data sets so with that uh we're going to end this section and i'm going to hand it over back to uh sean he is going to show us uh engine how to use that to get lens surface temperature from landsat observations thank you thanks amita i will now demonstrate how to convert thermal infrared data from the landsat series of satellites to land surface temperature estimates using an open source google earth engine code repository the reason we are using google earth engine for this demo is because it's an online platform created to allow remote sensing users to perform big data analyses in the cloud without having to download data onto your machine high spatial resolution land surface temperature data sets are currently not available in earth engine we'll be using an open source code repository accessed from bermuda at all 2020 that allows computing land surface temperatures from landsat 4 5 7 and 8 with all the google earth engine scripts necessary to compute land surface temperature google earth engine is a cloud-based geospatial processing platform it is freely available to scientists researchers and developers for analysis of the earth the platform harnesses google's computational power through a javascript api earth engine contains catalogs of satellite imagery modeled products and geospatial data sets for planetary scale analyses of earth science data you can access and search the catalog from the link provided on this slot you can also sign up for a free account if you wish to follow along with this demo or repeat the steps to derive land surface temperature from landsat imagery on your own time the image on the slide shows the web-based integrated development environment or ide for the earth engine javascript api code editor features are designed to make developing complex geospatial workflows fast and easy the javascript code editor is where you add or create your own code to take advantage of the earth engine api the map display is for visualizing geospatial data sets and results from writing the code from the code editor the script manager stores private shared and example scripts in git repositories hosted by google this is where the repository for calculating land surface temperature is located once you've accessed it from sofia hermita's repo there's also an asset manager to upload and manage your own assets in earth engine we encourage you to explore more on your own time to learn more about this cloud-based geospatial processing platform we've provided a couple links below to the developer's guide as well as the google earth engine developers group the processing chain for generating landsat land surface temperature was fully coded in javascript by armeta at all 2020 using the code editor platform the open source repository with all associated modules can be accessed at one of the links below to learn more about how the algorithm was developed as well as the station data used for validation and the results of the validation exercises please refer to the reference in the blue box by armeta at all 2020.
the code computes land surface temperature from the thematic mapper instrument on landsats 4 and 5 enhanced thematic mapper plus on landsat 7 and the operational land imager and thermal infrared sensor on landsat 8.
landsat surface temperature is computed using the statistical mono window algorithm developed by the climate monitoring satellite application facility known by the acronym cmsaf the climate monitoring satellite application facility first developed the statistical model window algorithm to derive land surface temperature data from mediosat first and second generation satellites the mediosat series of satellites are geostationary meteorological satellites operated by umet sat the approach is based on an empirical relationship between top of atmosphere brightness temperatures in a single thermal infrared channel and land surface temperature and utilizes simple linear regression all inputs to the land surface temperature algorithm are obtained from the google earth engine catalog they are top of atmosphere brightness temperatures for landsat's thermal infrared channels and surface reflectance data as provided by the united states geological survey total column water vapor as provided by the national center for environmental prediction and the national center for atmospheric research and surface emissivity from the advanced spaceborne thermal emission and reflection radiometer global emissivity database this is provided by the jet propulsion laboratory this slide lists the landsat satellites with instruments bands bands used in the processing chain to derive land surface temperature spectral resolutions for each band naming conventions for the data set in earth engine the spatial resolution of each band the equatorial crossing time for each satellite as well as the date range for each satellite mission assuming you've signed up for a google earth engine account you can launch the application and click on the link below to add the repository from airmedia at all you will be able to find the added repository under the scripts tab on the left side of your window confirm the repository and all associated modules have been added to your scripts manager before proceeding within the repo there are 10 modules written in javascript used in the processing chain for calculating land surface temperature from landsat imaging there are also two examples for calculating land surface temperature for an area of interest and deriving a time series of land surface temperature for a given location based on user input the modules used in the processing chain for calculating land surface temperature are as follows code to derive bare ground emissivity from aster data a module with code that calculates land surface temperature from landsat data code that matches the percentage of atmospheric water data to each landsat image coefficients used in the statistical model window algorithm determined from linear regressions of radiative transfer simulations performed for 10 classes of total column water vapor a module with code that applies the statistical window model window algorithm for computing land surface temperature code that computes broadband emissivity from the jet propulsion laboratory's aster global emissivity database code that masks clouds and cloud shadows using the quality band from landsat data a module with code that computes the fraction of vegetation cover from ndvi data from landsat imagery code that computes ndvi from landsat surface reflectance data and a module of code that computes surface emissivity for landsat data the two examples provided by hermita at all in the repository show how to compute landsat's landsat land surface temperature from landsat 8 imagery over quamber portugal the example code can be modified to compute land surface temperature for your own area of interest and from different landsat imagery the second example derives a time series of landsat surface temperature land surface temperature at a surface radiation budget site in desert rock nevada this code can also be easily modified to derive a time series of land surface temperature for your own area of interest to modify the example code to compute land surface temperature for your area of interest you will need to specify the following inputs in example 1.
you'll need the longitude and latitude to create a bounding box around your area of interest you'll need to specify which landsat satellite based on the satellite id coded into the module you'll need a start and end date for the landsat collection chosen and whether or not to use ndvi values to obtain a dynamic emissivity if you choose not to use ndi from the landsat imagery emissivity is obtained directly from the aster global emissivity database now let's take a look at the code within earth engine itself assuming you've successfully accessed the repository from our media you should be able to find that on the left hand side of your window within the scripts manager you can see that there are privately owned scripts publicly owned scripts and then those that have been shared with you so in this case if you look at the reader drop down and if you go in there you should be able to find the repository that you just accessed from sofia hermita and as well as the the 10 modules that are part of that repository as well as the two example scripts used i recommend that you go through each of these 10 modules to see how they're coded and so you can better understand how the processing chain works for sake of time we will skip to the example code written in javascript and break this down so you can understand how to run this on your own for the example one if we go down to the first variable to find which is a variable the landsat lst this is defined that calls the landsat land surface temperature module in the repository for use in the script if we go a little bit further we can see that there are five other defined variables here the inputs i mentioned in the previous slide are those that are that are entered here the variable geometry is defined from an earth engine object based on longitude and latitude the first set of longitude and latitude is for the lower left corner of your bounding box and the second set of longitude and latitude is for the upper right corner of the bounding box which forms the rectangle for your area of interest the next input defines the variable satellite specifying the landsat satellite from the id coded in the module landsat underscore lst this module again is being called from the first variable we we defined in the script the next variables are defined for the start and end dates for the landsat collection of choice the last input defines the variable use underscore ndvi which specifies whether to use dynamic ndvi from landsat imagery in this example it is true scrolling down on the code a variable is defined named landsat cole that calls the script we defined in our first variable and outputs the results from running the land surface temperature script outputs include fraction of vegetation cover land surface temperature surface emissivity for the thermal infrared band total column water vapor and the landsat original bands that have all been cloud masked it uses as parameters the inputs we specified above for geometry satellite and date range there's also a print statement below used to inspect the metadata for the printed collections in the console and the console is found on the right hand side of the screen in between the inspector and tasks tabs the next variable defined x image takes the first and best cloud-free image from the date range that we specified through the user inputs the next two variables defined are for the palettes used when visualizing the results in the map window the next line of code centers the map window on the bounding box we defined by specifying the longitude and the latitude above subsequent lines of code added the results from running the land surface temperature module to the map window parameters for min and max values are specified along with the palette used and a name of each result found in the in the layers panel this last chunk of code here which i just highlighted can be uncommented to output the land surface temperature results to your google drive i will uncomment them they start with an asterisk and a forward slash for both the beginning and the ending for the comment so since i've cleared that i can now export the image in this case we're specifying the lst the land surface temperature but we could easily specify a different output to be up uh to be downloaded to our google drive but in this case since i'm interested in land surface temperature we will leave this as the default i'll go ahead and click run at the top of the screen which will run the code and momentarily we'll start seeing results appear in our map display all the outputs are displayed in the map window and once they've finished generating themselves we can click on the layers pane we can see all the different results that have been outputted to the map window in the layers panel we see the true color landsat image specified as rgb we have the land surface temperature output from the uh from the landsat we have the thermal infrared brightness temperature we have surface emissivity for the thermal infrared band we have fraction of vegetated cover and this is i'm sorry this is scaled fraction of vegetated covers scaled from 0 to 1 similar to ndvi and then also total column water vapor in millimeters in this case i'm going to leave just the land surface temperature selected because that's what i'm most interested in we can also go up here to the inspector tab and click on that and then once that's selected we can zoom into an area that we find of interest so let's go to this agricultural area here and we can click on that left click and then we can see the results within the inspector tab we can also click on the console tab and what this does is we can drill down into the metadata for the landsat collection that we are using in this analysis but if we go back to the inspector tab we can see the total column water vapor in millimeters we can also see the fraction of vegetated cover in this very unvegetated surface because it's just been cleared prior to planting for uh for agricultural practices we can see the emissivity which is scaled from zero to one we also have the thermal infrared brightness temperature and we also have the land surface temperature which is shown in kelvin so we can click around in different areas of the map and again for that given pixel that we selected it will regenerate new results within the inspector tab we can also click on the tasks and we can see here because i uncommented the code to export the image to my drive we can see that it is now been put within my tasks and if i click run i can then export this to my google drive in this case would be for the land surface temperature so a lot of functionality in in very few lines of code so what if you wanted to change the study area to your own area of interest for calculating land surface temperature well to do so we would go back to where we add our own inputs and for geometry we're going to have to change that geometry to fit your own longitude and latitude for your study area so in this case i'm going to add a study area which is a bounding box around washington dc the capital of the united states and for the landsat satellite i'm going to leave it as l8 which is for landsat 8 and then for the start date i'm going to add july 1st because i'm interested in temperatures uh for this for this month so it's going to be july 1st to july 31st 2018 and we'll select the first best cloud free image within that month date range and i'm going to leave the defaults the rest as they are and i'll go ahead and click run the output centers the map window around the bounding box and calculates land surface temperature for the first date in that date range and again i specified july of 2018.
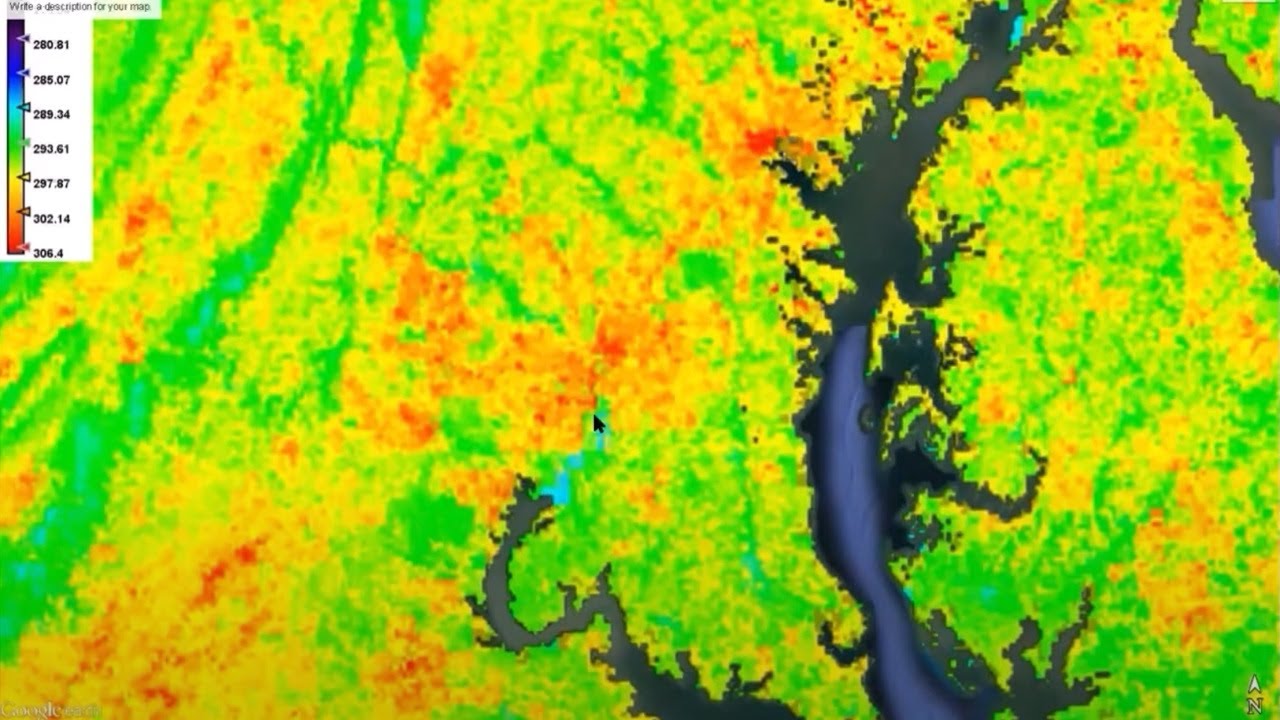
i'll turn off all the layers except for the land surface temperature layer so that we can see see this image more clearly and i'll also get more real estate on the map by dragging the script manager up so i can get more of the map window and also what i want to do is i want to change right now we're on map view i want to change this to satellite view and i'm going to remove the layers that way we have a good base map underneath the land surface temperature so to find i know where it is but maybe you don't this is the city of baltimore this is the the chesapeake bay baltimore and then this is the i-95 corridor that connects baltimore to washington dc and so if i turn back on the land surface temperature we can see areas that are highlighted in different colors reflecting the temperature in kelvin what we can do is we can also play around with the transparency so we can see see where those impervious and non-impervious surfaces are located within this this map area so if i turn the transparency off we can see areas around waterways and forested areas displayed in cyan and green and areas of higher land surface temperature in built up areas visualized in yellow and red these colors were specified by the palette defined in the code and again land surface temperature is in kelvin so i'll zoom around to an area in the navy yard and for those that don't know where that is it's just up on the potomac river close to um in what is it uh south southeast dc so if we zoom into this area we can see that there's one that's along the anacostia river which is cooler temperatures shown in cyan and then we also have some higher temperatures around the navy yard as well as the some of these more built up areas we can see darker surfaces with lower albedo and we can also see lighter surfaces what's interesting is if we look at the nationals park where the professional baseball team plays which is located right here we can see that on the field itself there are low land surface temperature but then all the built up area around it obviously shows higher land surface temperature we can use the inspector tab to find pixel values for each layer at a given location so what we'll do is we'll go up to the inspector tab and then we can click on some of the uh the layers here say in this very built up area here and then we can actually see all the results that are generated underneath the inspector tab if you uncommented the code to export an image to your google drive you will find the image waiting uh to export under the tasks tab so because i had that unchecked again i have that i can export this land surface temperature temp uh temperature image to my drive to be able to pull into a gis and to do some more visualization and analyses so the second example of code derives a time series of land surface temperature this code can be easily modified to derive a time series of land surface temperature for your own area of interest i will not be demoing this today just because we're running out of time but i do encourage you to do so on your own so some of the ways to get involved in studying urban heat islands through citizen science is through the globe program the global learning and observations to benefit the environment program is an international science and education program that provides students and the public worldwide with the opportunity to participate in data collection and the scientific process they currently have an urban heat island data collective collection campaign students can set up research studies at their schools such as looking at the difference between paved and unpaved areas elevation latitude and longitude urban versus rural proximity to water etc to better understand the urban urban heat island effect in their community some of the data you will be collecting in this campaign are cloud data surface temperature and air temperature all super exciting the first link takes you to more information about this urban heat island citizen science campaign and the second link makes you familiar with the atmosphere protocols followed by globe when they collect data for their scientific investigations you will explore the steps of setting up a globe atmosphere study site and be introduced to globe data reporting and visualization tools we hope you'll explore both websites to learn how you can participate in data collection and the scientific process to better understand urban heat ons for educators my nasa data provides grades 3 through 12 teachers access to nasa mission data through unique tools that help students learn about earth system science the project's value is providing earth science data resources that are teacher and student friendly the links below will take you to lessons you can complete with your students and for creating a story map with your students to interact with nasa images charts and graphs for your students to explore urban heat island effect using land surface temperature and vegetation data below are references we've provided for further research we will now transition to the question and answer portion of this training we've been receiving many questions throughout this presentation and we will try and answer them in the order received based on the time we have remaining if you haven't already please enter your questions into the question and answer box for the questions we don't have time to address today we will answer them and post the q a doc to the training website following the conclusion of the course below is the contact information for both amita and myself along with the training page to access materials going forward we will now start the question and answer session starting off with the first question that we have for the question and answer session the question was does the building material matter in urban heat islands or is it negligible and the answer that we put is uh well the properties of urban materials in particularly albedo thermal emissivity and heat capacity all influence urban heat island development as they determine how the sun's energy is reflected emitted and absorbed so building materials i.e in urban areas generally reflect less and absorb more of the sun's energy this absorbed heat increases the surface temperature and contributes to the formation of surface and atmospheric urban heat islands so it is not negligible definitely not question two how can urban heat island research actually change urban planning for well-established urban areas and they used some examples from the united states new york city chicago etc these are all large cities uh that have established infrastructure uh that has been in place buildings built up uh roads buildings etc so the answer is uh doing research in urban henons and understanding uh you know spatially and the uh the dynamics throughout the city help city planners by understanding for example where to increase tree and vegetative cover uh so through remote sensing and we're gonna be hearing a lot more about this uh next week when we hear more about dr v vik chandler's work with using in-situ data in urban areas where they can identify what areas are the tree cover or vegetation cover is lower and that can determine where best to plan for maybe efforts to uh you know to to to to replant to to provide more cooling and evapotranspiration in these hot spots of the area it can also show maybe plan on where to install green roofs uh green roofs uh are are much better at cooling uh the built-up areas within the cities as well as installing if uh roofing with higher albedo so more reflective roofing so they're not absorbing uh as much as the sun's energy as well as uh using cool pavements uh reflective uh pro-mobile etc and then uh all this on how to utilize better smart growth practices so if you're a city that uh it might be going uh under a lot of change and development you can use the resources especially uh the the resources that we've talked about today for better planning on as the city is growing and how best to develop that city so taking together these actions can all contribute to lowering overall urban heat island within hot spots of urban areas as well as provide greater benefits uh to the residents that are living uh in these areas that are already well established like new york city chicago et cetera uh question three can we analyze the urban heat island uh and i guess in this case this participant was interested in using a gis either arcgis or qgis the answer is yes so the land surface temperature products uh which dr amitabhekta described today can be acquired from the websites that were all referenced in today's training and once you are able to download them you can certainly bring them into a gis if you have access to arcgis or qgis which is an open source gis software you can certainly bring them into that for further analysis if it's identifying time series trends or or just identifying hot spots within that area so that that is certainly uh all possible um to do within within a gis uh question number four how does one identify the impact of the urban heat island effect on seaside megacities like chennai mumbai of india with comparison to other inland mega cities like delhi or kolkata so this is tricky because urban helanines are are highly localized for many of the reasons we talked about today um different cities located in different geographical areas have different climates associated with them different built up environments um so all of these so despite the fundamental physics uh behind them being similar uh they're uh strongly modulated by local dynamics so it's best to identify the impacts of the urban highland urban heat islands on cities individually uh and that's probably the best uh course of action for uh this participant question five uh landsat land surface temperature when you say over the united states is it only the continental united states does it include u.s territories so uh currently the product that the analysis ready product that the usgs provides this land surface temperature product uh is currently only available for the contaminants united states alaska and hawaii so that does not include u.s territories that being said if you if you ingest if you use the code that we provided with the you know open source repository you will be able to generate that land surface temperature over u.s territories but you will not be able to do it from the analysis readily data that is provided by usgs which is one of the reasons why we wanted to do this training and provide this code to you in google earth engine so you can do this analyses regardless of of where you live as long as you have good coverage from the landsat missions for the specific date range that you're interested in uh question six are there future plans to generate landsat land surface temperature data for areas other than the conterminous united states if so is there a tentative date uh the short answer is yes the usgs does have plans to generate a land surface temperature product for areas outside of the united states but currently it has not been released it's because all of the validation exercises they've been doing have all within uh within the united states currently the methodology we showed today using the open source code on google earth engine does allow you to generate land surface temperature for any area you know outside inside the united states as long as the landsat has coverage of that area what i will recommend this participant that asked this question is to please join us for all three parts of this webinar series um because in this in the third part of this webinar series we will be joined by a colleague from the usgs aero center uh who's actually working on these algorithms for land surface temperature within the united states and he's a a wonderful person to direct this question to so please do join us for the third part of this this webinar series and and please ask the question again so you can get it directly from the source of these people that from usgs that are making this analysis ready data available to to the public uh so question seven with the use of modis land surface temperature data certain rural areas are much hotter than the urban area in certain cities during the day and urban areas get hotter comparatively in the night what could be the cause so again we'll mention that urban heat islands are highly localized so there might be areas within these rural areas with a high level of built up services this could be you know industrial areas or or just you know just some type of a built up area outside of that core downtown area so this could be one of the reasons why just in terms of spatial variability this could be the cause as well as there's also a lot of cities that are built up in arid environments so they actually do a lot of landscaping within urban areas for you know urban forests urban tree cover etc and if you're in an arid environment where you don't have a lot of vegetation outside of the the downtown area then this these um the planning that the cities take to to vegetate the the urban areas can actually cool it relative than the outlying areas so that might be one of the reasons as well uh again everything is highly localized so it really just depends on what city that your uh your study area or area of interest might be and then regarding urban uh areas being hotter comparatively at night time again that was uh what we discussed earlier uh so it has to do with a lot of the building materials such as you know steel stone etc have higher heat capacities than rural materials they also have lower albedos so they reflect less than than rural areas so for example such as dry soil and sand so as a result again cities are typically uh more effective at storing the sends energy especially during the day and then they re-radiate that or they radiate it at night uh which again is warming that city comparatively at nighttime question number eight will the codes be provided for use in google earth engine at the end of the webinar the answer is if you go on the the training page for this specific training satellite remote sensing for urban heat islands and if you go to the the the slides that we provide for today's training um you have the links to those open uh source uh repositories that have the code written in javascript for everything that was covered today so we highly recommend you please go to the rset training page i think we'll put a link on here momentarily and we've also provided a link below in one of the lower questions so please go to that click on that link access the slides from today's training and you'll be able to click and access the all the code that we showcased during today's training question nine can i use urban heat island data for sustainable urban planning in favor of reducing temperature in a city so the short answer is yes and we'll allude to the question that we we answered earlier uh which is land service temperature products uh can be used for urban planning to understand you know where are areas within the city uh you know is it is it uh you know how heterogeneous is a city are there areas that are are lacking uh in say tree cover and can we see a correlation between that tree cover and higher land surface temperatures and if so that can maybe uh better direct city planners urban planners on where they should be going in and planning for greater urban tree canopy cover it also helps inform where to install green roofs within the buildings within urban areas some areas might be hot spots even within uh the urban yeah there might be hot spots within those downtown areas and it can better inform on on where to plant you know green roofs install install more reflective roofing so you're not trapping as much as the the sun's radiation as also uh you uh where to maybe put in or or install uh cool pavements that are um more reflective or uh permeable as well and question 10 is there consistent land surface temperature data starting from the 1980s just for trend analysis and i believe amita answered this one but you can drive land surface temperature since 1980 using avhrr or goes those are two different instruments on noaa satellites and then also landsat lamp surface temperature are available from mid 1982 starting with the landsat 4 mission until the present and they can be used to identify the trends so you have different options there depending on how far back in time you want to go definitely landsat land surface temperature will provide the highest spatial resolution so if you're trying to really drill down within an urban area that's that's certainly going to be uh the most precise in terms of identifying hot spots but again all of these are are available to you and and some of them go back for four decades so question 11 while deciding which satellite to use to retrieve data for urban heat islands is it better to use something like modis since it has land surface temperature and emissivity simultaneously yet the resolution is better in landsat uh again landsat uh spatial resolution being 30 meters and the answer to this is uh for looking at spatial uh uh for ligand spatial resolution land surface temperature patterns within urban areas landsat is better because of the higher spatial resolution modis data can provide area integrated continuous time series of landsat learn surface temperature so for looking at frequent land surface temperature variations modis is better due to its temporal resolution um so this is either eight uh it could be a daily product there's modis also has an eight day product etc so if you're really trying to look at you know within let's say a month and then the changes within that month or you know diurnally then that might be the better option of the two so question 12 which season and data should be considered best to study urban heat island effects and also are the outputs of all the available data sets the same or different so answer 12 usually summer season data are considered for looking at urban heat island effect uh when this is when land surface temperatures are maximum but all seasons will show indications of urban areas being warmer than they're surrounding non-urban open areas so it's going to be most pronounced during the summer months that would be either the austro-summer or the northern latitude northern summer but again you can study this effect uh throughout the year uh seasonally or annually question 13 what are appropriate atmospheric correction algorithms to apply to landsat thermal infrared data to compute land surface temperature are these already processed so yes plants outline surface temperature already processed as we saw in the presentation and are available from the usgs earth explorer but these are only for the united states uh what i am showing in google earth engine can be used to dry plant surface temperature from landsat uh it really depends the the atmosphere corrections for landsat 8 are going to be a different correction that are applied from landsat 4 through 7 and i we will put the uh the exact names of those uh algorithms that they use to correct them but they're derived from uh from the usgs and we will certainly put them in there before we post this uh question and answer document to uh to the rset website so question 14.
do you know any good tutorials or courses on how to use google earth engine with python instead of javascript um so i'm familiar with using javascript but there are certainly a lot of tutorials that are out there on youtube or online that you can do to search that you can maybe receive some training or or or more information on how to use python i highly encourage you to do that if that is your the language that you're most familiar or comfortable using so we're gonna do this one last question because there's so many more questions to get to but what we can do is uh we're going to answer the rest of these for all of them that were added and we will post the rest of these to our the training page so please at the conclusion of this uh this this uh this three-part webinar series please go to the rsi website where we will post all of the q a uh docs for all three of the the three parts but again we're going to end it with this one just because we are running over for time but for question 15 can the cm saf uh smw algorithm be used for any of the satellite data for example astra data or ecostress so the answer is land surface temperature data are available from asteroid ecostress as we just saw the cmsef algorithm is used with landsat data it's also used with mediosat data and you can you you may try to apply it with aster ecostress with appropriate modifications to the algorithm but aster does use its own surface emissivity that has been calculated in a date i believe it's from 2000 to 2008 and so they actually use their own algorithms to derive land surface temperature which are uh uh and actually it's used they're the same some of the similar coefficients and algorithms are used to generate the landsat land surface temperature um but they are they are different so um so anyway we hopefully we answered that and we will certainly get to all the rest of the questions that you had and we will answer them all and post them to the web page um but we are running over so i i just want to thank uh i want to thank dr amita mekta for uh presenting today we also want to present uh i thank our wonderful team uh brock blevins uh selen hudson odoi as well as jonathan o'brien who have all been in the background making sure that this uh this presentation went so smoothly so thank you to everybody that took part and especially to everybody that joined us today we hope that you enjoyed this we do look forward to your feedback when the surveys are sent around and we do hope that you will join us next week when we're going to be able to hear from dr vivek chandas and he will be presenting on how to use institute data to derive land surface temperature with satellite data so please join us next tuesday thank you for joining us and stay safe
Up Next

NASA ARSET: Mapping Urban Heat Islands with Landsat & MODIS
@NASAgovVideo
18.1K views•2022-08-04

Life in Biosphere 2: Sustainable Ecosystems & Human Survival
@TED
334.9K views•2009-06-16
Ecological Forecasting with NASA ARSET: Session 1
@NASAgovVideo
2.4K views•2018-11-06
Ice Stupa Artificial Glaciers: Solving Ladakh's Water Crisis
@SonamWangchuk66
3.2M views•2015-05-03
Related Study Plans & Knowledge Roadmaps
Structured learning paths in Environmental Science