

































Pulmonary Function Tests (PFTs) are interpreted through three key components: spirometry (FEV1/FVC ratio indicates airflow limitation when below lower limit of normal), lung volumes (TLC, RV, ERV reveal hyperinflation, air trapping, or restriction), and diffusion capacity (DLCO assesses gas exchange function). Case analysis demonstrates how combining these measurements—such as identifying airflow limitation with hyperinflation and air trapping in asthma, or restriction with decreased DLCO in pulmonary fibrosis—enables accurate diagnosis of underlying lung pathology.
PFT Interpretation: Real-Life Cases for Spirometry & DLCO
Added:Basic respiratory anatomy and physiology, including the structure of the airways and the alveolar-capillary membrane.
Fundamental spirometry parameters, specifically Forced Expiratory Volume in 1 second (FEV1), Forced Vital Capacity (FVC), and the FEV1/FVC ratio.
Standard lung volumes and capacities, such as Total Lung Capacity (TLC), Residual Volume (RV), and Functional Residual Capacity (FRC).
The physiological concept of diffusing capacity (DLCO) and how gas exchange occurs across the alveolar-capillary membrane.
The general clinical distinction between obstructive (e.g., asthma, COPD) and restrictive (e.g., idiopathic pulmonary fibrosis) lung diseases.
Interpreting complex or mixed pulmonary defects where obstructive and restrictive patterns co-exist.
Formulating clinical treatment and management plans (such as pharmacotherapy titration) based on PFT severity classification.
Understanding the indications and interpretation of bronchoprovocation testing (e.g., methacholine challenge tests) for suspected asthma with normal baseline spirometry.
Utilizing Cardiopulmonary Exercise Testing (CPET) to evaluate multifactorial or unexplained dyspnea when resting PFTs are inconclusive.
Applying PFT data to pre-operative risk assessment to evaluate patient suitability for major cardiothoracic or upper abdominal surgeries.
7.7K views124likes7:33Original Release: 2019-02-09
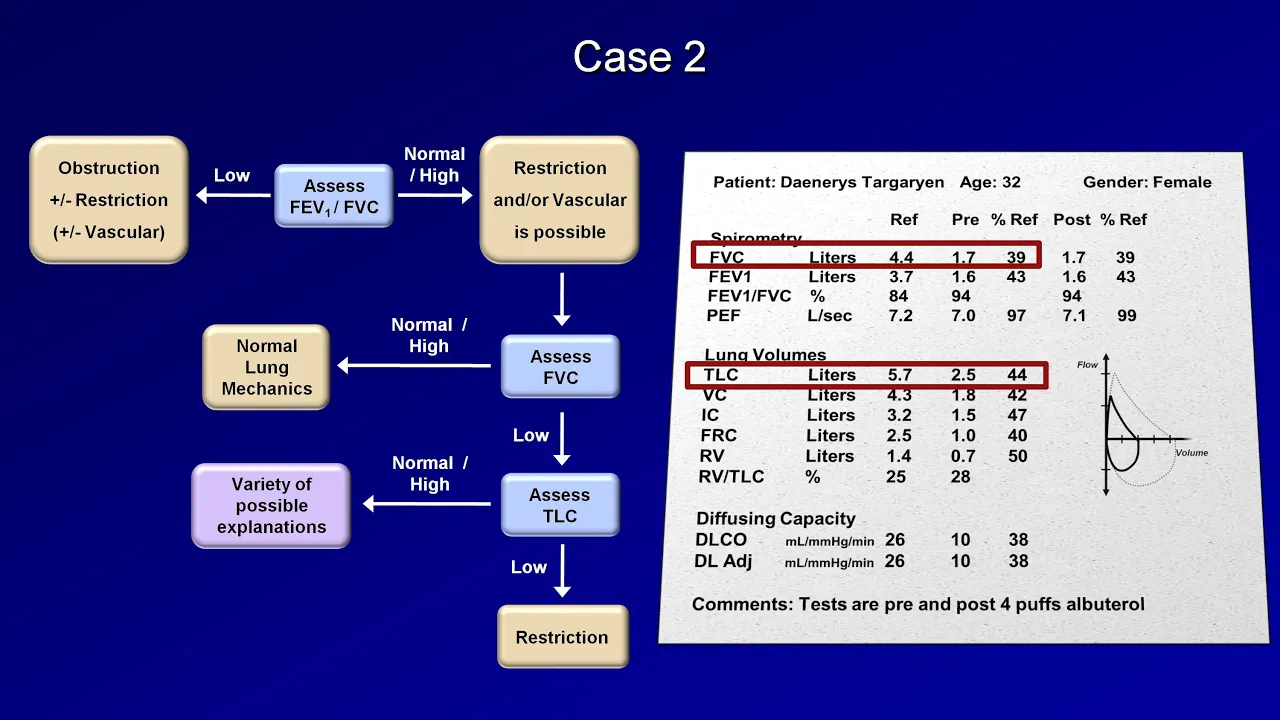
hey guys it's Meredith here again and finally we've made it to the case practice so we're gonna go through a couple of my real-life cases from clinic and hopefully at the end you'll be able to understand how I read PFT s so hopefully you'll be able to start reading PFT s on your own so let's go ahead and get started alright so here's how P of T's look the first thing I want to look at is spirometry remember and so what we're gonna look at here is the fe b12 fvc ratio remember if the FE v12 fvc ratio is low then that is indicative of airflow limitation so this patient when you look at the lower limit of normal it's 69 and when you look at his number it's 65 so that is lower and so therefore you can say that this patient does indeed have an airflow limitation I just want to take a moment right here to let you guys know that there's a lot of numbers and there's American Thoracic Society guidelines and there's gold stage guidelines and you're gonna hear all about this but really what you want to pay attention to is the lower limit of normal because at the end of the day you want to be comparing the patient to what is going to be expected for their baseline and that's going to be based off their age their race their height etc and so use these lower limits of normal to your advantage and just know that you don't have to necessarily memorize those numbers alright so next I'll look at the lung volume so that's a number two thing I look at you want to pay attention to the TLC the total lung capacity the RV the residual volume and the ERV the expiratory reserve volume remember if TLC is increased then that can go along with your airflow limitation in the form of air trapping and hyperinflation if TLC is decreased then you have a restrictive component of lung disease so here we look at the lower limit of normal again it's clearly much higher so this is indicative here of hyperinflation of the lungs the RV is also increased which is indicative of air trapping so in summary this person has hyperinflation as you can see from the increased TLC and they have air trapping as you can see with the increased RV and these both go with our prior diagnosis of airflow limitation that we saw on spirometry I don't want to forget about the ERV so notice in this patient that the ERV is actually a little bit lower than you would expect 38% so you would just want to check the BMI in this person because this is indicative of obesity so the last and third thing I want to look at is a diffusion capacity and that's the dlco we talked about in the last lecture so this person's lower limit of normal is 18 and their actual is 25 so they have a normal dlco so we can just say that there's no diffusion issue going on with this patient so in summary one we definitely have an airflow limitation present and we can tell that from spirometry number two based on volumes we have both hyperinflation by the TLC plus air trapping by the RV so based on this what do you guys think the flow volume loop is going to look like alright well here it is so essentially what you can see here is the normal in the first line and the patient's in the second line and you can see that it slopes down consistent with airflow limitation on this line what's interesting is this is the volume against time and you can see that the patient is breathing out forever also consistent with airflow limitation and on a physical exam that is called prolonged expert ory phase so what do you think this guy has so he has asthma and he's an interesting guy he has its secondary to something called Church Straus so case two so again number one look at spirometry what do you look for the fev1 to fec ratio lower limit of normal 69 this patient's 91 they're doing great so that's normal so a normal fev1 to fvc ratio means that this patient does not have airflow limitation the next thing we want to look at is why is that number at the top red so the fvc the forced vital capacity is low in this person and while that cannot tell us anything definitively it can suggest that their TLC may also be low so good thing we always look at the lung volumes next so long volumes number two's step after spirometry what do we look at the TLC and in this patient it actually is slightly lower than the lower limit of normal so we can say that this TLC is low and this essentially confirms what we are suspicious of which is a restrictive disease process that is going on I also just want to point out this patient slower ERV which could be suggestive of obesity but could also just go along with their restrictive disease process the third thing that we always look at is the diffusion remember the dlco so here this is significantly lower than the lower limit of normal and so we can say that something's wrong with the diffusion is it alveolar or is it a capillary cause remember the differentials from the lecture on dlco so what do you guys think is going on and how would we be able to figure this out so remember the differential for the decrease in dlco alveolar versus capillary things that are alveolar like fibrosis and emphysema they affect your surface area or lung volume remember capillary issues like a pulmonary embolism or pulmonary hypertension or anemia should have nothing to do with your lung volume so that's your clue for this patient so remember we said this patient had a low TLC confirmative of restriction so this patient must have an alveolar cause of the decrease in the dlco so if you don't believe me yet here's the graph so that's normal person and then this is our patient significantly more narrow indicative of restrictive disease also on the right hand side this curve is a lot less time as you can see compared to the prior and that goes along with sort of the restrictive process because they have more elastic lungs if you will they have a lower compliance and so they snap back pretty quick and remember this patient also had that decreased dlco which we thought because of the volumes was probably due to an alveolar cause and you guys were right so the diagnosis here is pulmonary fibrosis and in this patient its secondary to rheumatoid arthritis so as we say on the wards strong work guys you solve both of the patient's problems stay tuned we're gonna have pulmonary hypertension neuromuscular disease and more complex flow volume loops and upcoming presentations thank you so much for tuning in thank you for watching I hope you learned something today and as always if you have any questions please feel free to email me at m'kay Grier at Emory edu happy studying
Up Next

4:04
Cognitive Behavioral Therapy (CBT) Basics Explained
@TherapyToThePoint
278 views•2023-07-29

32:45
Memory and Long-Term Potentiation | Physiology | MBBS Exam Prep
@doctutorialsmbbs
307 views•2025-08-27

10:28
Neuroanatomy: Central and Peripheral Nervous System Divisions Explained
@AKLECTURES
136.2K views•2014-09-20
3:05
Stages of Labor and Vaginal Birth | Childbirth Animation
@nucleusmedicalmedia
52.1M views•2017-08-18
Related Study Plans & Knowledge Roadmaps
Structured learning paths in Medicine
medicine
Interpreting PFTs: Spirometry & DLCO
01Respiratory Anatomy and Physiology Foundations
02Spirometry: FVC, FEV1, and Flow-Volume Loops
03Lung Volumes and Plethysmography
+ 2 more learning modules
12h5 modules
Explore Roadmap
medicine
Abnormal LFTs: Diagnostic Workup & Pathology
01Liver Anatomy and Basic Physiology
02Introduction to Liver Function Tests (LFTs)
03Hepatocellular vs. Cholestatic Patterns
+ 3 more learning modules
12h6 modules
Explore Roadmap
medicine
Analyzing Blood Smears: RBC, WBC & Platelets
01Introduction to Blood Components & Smear Preparation
02Normal Morphology of Blood Cells
03Erythrocyte Pathologies & Morphological Variants
+ 2 more learning modules
12h5 modules
Explore Roadmap
medicine
Mechanical Ventilation: Waveforms & Alarms
01Anatomy and Physiology of Breathing
02Introduction to Mechanical Ventilation & Core Modes
03Ventilator Settings and Waveform Interpretation
+ 2 more learning modules
12h5 modules
Explore Roadmap