













Asteroseismology uses the oscillations (sound waves) observed in stars to directly measure their mass, radius, and other properties. By analyzing the frequency spacing of these oscillations, astronomers can determine a star's mean density (mass divided by radius cubed), while the maximum observable frequency reveals the star's surface gravity (mass divided by radius squared). Combining these two measurements allows independent determination of both mass and radius for stars across the galaxy. This technique has been successfully applied to thousands of red giant stars using space-based observatories like COROT, Kepler, and TESS, providing unprecedented insights into stellar interiors and galactic structure.
Asteroseismology: How Sound Waves Reveal Star Properties
Added:Understanding the basic structure of stars, including the concept of hydrostatic equilibrium and the layers of a stellar interior (core, radiative zone, and convective zone).
Fundamentals of wave physics, specifically acoustic waves (sound waves), standing waves, resonance, and how waves propagate through mediums of varying density.
Familiarity with the Hertzsprung-Russell (H-R) diagram and key stellar parameters such as mass, radius, luminosity, and effective temperature.
An introduction to helioseismology, the study of wave oscillations in our own Sun, which serves as the foundational template for asteroseismology.
Exploring how stellar rotation and internal magnetic fields split oscillation frequencies (rotational splitting) to map the internal rotation profiles of stars.
Applying asteroseismic data to exoplanetary science, specifically using precise stellar radii and ages to characterize the sizes and evolutionary states of orbiting exoplanets.
Studying galactic archaeology, which uses the precise ages and chemical compositions of thousands of red giants probed by asteroseismology to reconstruct the formation history of the Milky Way.
Investigating advanced stellar evolution models and testing the physics of extra mixing, convection, and angular momentum transport in stellar interiors.
193 views3likes45:07Original Release: 2022-03-24
Um, hi everyone. I'm Ellen Swel. I'm the chair of the astronomy department and it's a great honor to uh be here to introduce uh professor Lars Bilston from the Cavali Institute for Theoretical Physics at University of California, Santa Barbara where the weather is probably not like it is here. So um Lars uh Lars's story begins in the Midwest.
He's originally from Ohio uh undergraduate and graduate degrees from MIT and Cornell. uh then he went to Caltech to be a postoc then he moved up the coast to Berkeley to be a faculty member then he moved back down the coast to um be a permanent member of the Cavali Institute which is a wonderful uh sort of sandbox for people who do theoretical work in all areas of physics to come and gather and and learn from each other and and make new knowledge in in physics and uh Lars is now the director He's a he's here as the Witford the in the Witford lecturesship of the UW astronomy department. We meant uh for him to come two years ago. Uh and I don't think I have to explain why we've had to wait. So um Lars, I won't cut into your time anymore. Uh take it away.
All right. Well, thank you very much, Ellen. It's really my pleasure to be here tonight and eager to take questions from the audience. But I'll do a few slides first before I start asking for questions.
What I'd like to do this evening is sort of tell you a story of unusual expectation in our community, which is the ability to use uh oscillations observed in stars to really understand their detailed properties. So when you look out at the night sky, the major thing I want you to take away from this talk is that even though you can't really see it, but when you're looking at the stars in the night sky, the majority of them are actually undergoing oscillations, ringing like you would imagine if you hit a wine glass and there's a frequency it likes to ring at. I'm going to explain to you a little bit about how we understand the frequencies we've observed, how we observe those frequencies, and in particular, how we use those observed frequencies uh to actually measure properties of these stars all across our galaxy, the Milky Way.
So, I'm going to start by talking about sound waves because pretty much everything I'm going to tell you about tonight are sound waves in stars, but I wanted to start it start with sound waves in this room.
So you're hearing me because of the fact that I'm causing a soundwave to be transmitted to you. And in the room at the current temperature, I probably could have reduced this a little bit uh for here. Uh it is indeed this sort of 350 meters per second. That's this the speed of a soundwave in air.
And you probably experienced it. If you see something far away, you notice you can see it before you hear it. So the speed of sound is much less than the speed of light. But you can also, as I'm going to talk about first, use sound waves. Um, if you have a localized source somewhere that creates sound waves and you measure time of arrivals at different locations, you can use that to actually triangulate and get locations. And I'm going to start by telling a story about that, which has nothing to do with stars, but it's just so cool that I just can't help myself once I learn this uh story. So, I'm going to start um first off reminding you of what a soundwave is in air, which is the propagation of a disturbance. The disturbance, as I've shown here, is a is a disturbance that we call a rare faction, an area where there's less air, where it's getting decompressed, and compression. And that's the wave that's propagating towards you uh has a certain characteristic wavelength, which we call lambda, and a certain sound speed. CS is the sound speed. And the frequency of these waves is as I've shown here lambda. And so sort of as you know from musical instruments for those of you who play instruments, the shorter the wavelength, the higher the frequency.
And it's going to be the same for stars.
Uh there they don't behave any differently. They have different sound speeds. They have different gross structural properties. But they're really what I'm going to talk about today are just sound waves. I'm going to take this diversion to talk about sound and water because it's just a cool story which I learned for many years. I taught a class called the physics of California where we use natural phenomena in California to understand physics and this is one story that I learned. So water is quite different than air. Air you can understand the speed of sound basically just due to the properties of an ideal gas in that case molecu molecules nitrogen oxygen. Um in water it's much less sensitive to temperature.
Water is almost incompressible. It's sort of hard to imagine you can compress it but if you compress it you can get a sound sound wave to travel. Um, it is about four times faster than air.
Um, and if you go into the ocean, which is what I'm going to talk about, as you go deeper down in the ocean, all of you know, the pressure rises. And for anybody who's a diver, they can always tell me how deep they have to go to get to one atmosphere extra pressure. See, does anybody know that? How deep you have to go in water to have the pressure double.
There you go. So there's always somebody in the crowd that knows it. That's right, about 10 meters, right? Um, and so the pressure does increase as you go with depth. And that actually naturally leads to a slight increase in the speed of sound. Very slight as you'll I'll show you. So if you if life were simple, you would just expect the sound speed to rise as you go down into the ocean.
However, there's one difference, which is that if you're at the top of the ocean, it's actually a little bit warmer, particularly at the equator. And that leads to another cause of increase of the sound speed. And so the sound speed profile and these are I'm going to show you plots from old papers. So the units are really funny. Um so here's a plot where it's shown on the um y ais is how deep you're going. Okay. So as you go down the plot you're as you go down the plot you're getting deeper and deeper. This is in thousands of feet. So here's 13,000 ft. Uh there's other plots I could have had with fathoms but I decided that was not going to help. And then this is the speed of sound and they use feet per second.
So, as I said, as you go deeper down, the pressure is rising. The sound speed rises. If you're at the equator, it's uh here's latitude 20 degrees north. It's much hotter than at latitude 60° north.
And so, what you find though is that there the temperature rises. And so, there's a place where there's a minimum in the sound speed.
And you can see uh that and this is going to lead to a really interesting phenomena that was actually used to find uh downed pilots during World War II, which is why I wanted to tell you the story. It's kind of a cool physics and action story. So, what happens if I have a wave that's trying to propagate in a regime where the speed is changing, the the sound speed is changing? Um well, what happens is the waves um are going to propagate and start to get bent as they proceed down. So if a wave is going down and the sound speed's rising, there's sort of a a Snell's law, if you will, that tells the wave how to behave and that will lead to that is me. Is that me? Okay, turn that thing off.
Yeah, here I can turn it off. You can.
Um so you sort of know about this.
There's already a sound speed jump between air and water. And so there's a lot of reflection of sound at the water surface, which you've experienced. Of course, you you experience it off walls.
We don't think about it as much. Water, you might think about it a little bit.
But the Snell's law means as the sound speed rises, if you have a wave that's propagating at a certain angle, it'll become more acute and eventually it'll reflect and turn around and come back out.
And so here's a plot that's really busy.
And this has fathoms on it.
So what's being shown is range. So the x-axis is distance from a point source here where let's say you set off a small little soundwave by blowing up a little device u to the right then is range down range.
Uh this is in fathoms unfortunately. So if I have here your translation a fathom is six feet. So what this is showing is in the earth's ocean because of this this place where there's a minimum in the sound speed a ray that's going at 15 degrees up will go up go up go up but then turn and come back down that's this wave here 15 degrees initial angle 12 degree ray more acute stays in the channel and then many of these uh really these narrow channel these narrow rays at very narrow angles basically travel out So if you have a point sound source, they'll travel out in a two-dimensional way. They stay trapped in this two-dimensional channel.
Okay?
And if you think about spreading of energy, if I confine the energy into that two dimensions rather than three, the amplitude of the sound will stay.
It'll be louder, if you will, if you're in the channel than outside of the channel.
And this allow allows sound in the ocean to go to very large distances. Um, and it really does spread in two dimensions.
This was discovered in the 40s by ooing with the explosion a few pounds of TNT uh off the coast of Africa. It was detected in the Bahamas.
So that's quite remarkable. And it was used uh during the war and I the only place I could find this was in an old um not Scientific American uh Popular Mechanics, right? All right. So, 1949 there's a popular mechanics where they, you know, I guess declassified this cool thing. So, it was called SOFAR. Uh, and this was the Navy's lost and found agent. So, here's your downed pilot who would have a device that they'd set for the latitude they're at and it would be then go to the pressure where the sound speed is minimum and it would set off a a explosion. And they had hearing devices all around in different places and they're just trying to show you here. Here's one of point sir here's one is this uh over in I guess this is Hawaii and they would then get these signals at different times and they would triangulate and they would say the explosion occurred in this point and because of that they could then send uh rescue craft to actually find find the individuals and use that as a a way to localize where the downed pilots were.
So that's kind of the military use. This has also been used as a great way to measure uh net climate change for the ocean. So I don't have that here. But the point is this is very sensitive to the actual temperature in the ocean. So it was used and this is really done a lot by Walter Monk many years ago as a way again setting off explosions in the ocean and doing time arrivals to get the mean temperature in the ocean. So it has been used as a way to monitor the increasing temperature in the ocean uh due to climate change.
Okay. So I'm going to pause there and see if there's questions before I go to the the next case which is a star.
So any questions on that?
Okay.
All right. So let's go now and do something completely different. But the reason you probably came here was to not hear about explosions in the ocean. But it's it's kind of a cool physics problem. So how do we understand stars?
Stars are very simply objects which are being held up by the hydrostatic hydrostatic balance between the pressure of all the stuff sitting on your head.
So we talked about you go down 10 10 meters in water the pressure doubles.
Well you do the same in a star there's a huge amount of pressure as you get near the center. That pressure is being balanced by gas pressure and that gas pressure if it's an ideal gas actually is what sets the temperature. So the way to understand the temperature of a center of a star is is this relation which is that the thermal temperature which is the boltzman constant times the temperature. That's the typical kinetic energy of a particle is equal to the gravitational g is the gravitational constant. The big m is the mass of the star. The little mp is just the mass of a proton. Stars are mostly hydrogen. For this purpose, I'm just going to keep it hydrogen. The r is the radius of the star. So, what you see is what we also refer to often as sort of a varial relation that the thermal energy equals roughly the gravitational energy per particle. But this is what tells you how hot a star needs to be at the center. If you give me a star of a mass m and radius r, I can use this formula and pretty much estimate what the temperature must be at the core. That's how stars work most of the time.
So you can then ask, how long does it take a sound wave now to travel across this star? Well, that's just going to be the radius divided by the sound speed.
And the sound speed depends on the temperature. These stars get quite hot.
And as I showed you back in the ideal gas case, the sound speed goes roughly as a square root of the temperature. And so you can use that and this relation to get a typical relation for the time it takes a sound wave to traverse a star.
And because of this relation, uh, you can just write this all in terms of the radius and the mass of the star. And for the sun it's about an hour.
So quite remarkable to think about. The time it takes a soundwave to go you know sort of around the whole star is just an hour. And this time scale for those of you who've done dynamics is also pretty much the same time scale as a time it takes a particle if it's orbiting right at the surface of the sun. It's roughly the same time as it takes for an orbit of a particle at the surface.
Okay.
We're going to do giants, giant stars in this case, where these radi will not will be up to around 100 times the radius of the sun. In which case, this time scale is going to get much longer.
It's going to get to days to weeks.
So, let's start with the sun and then I'm going to go to distant stars. And, you know, the sun is a great example of a star only because it's close.
That's pretty much it. Uh, it's it's, you know, we can learn a lot about it because it's the closest star we've got.
uh in the 60s that it was really discovered that the sun had was showing periodic typical oscillations of around five minutes.
Um these motions were quite coherent clearly a large scale waves. It led to motion at the surface of about a half a kilometer per second. So these measurements were being made by using the Doppler shift effect which is you look at a spectral line and you see the frequency shifting as the wave comes towards you and moves away. That's how the measurements have historically been made for the sun. When we talk about distant stars, I'm going to I'm going to talk about a different way to measure it. So, my title of my talk was hearing the stars. And just to be clear, the sound waves that are present on the star are not getting to us via sound waves.
They're causing some phenomena on the star that we observe with light. So, in this first case with the sun, the phenomena is the Doppler shifting of of the fluid moving back and forth periodically.
And over time it really became clear that for the sun where we can really observe things much more carefully than for a distant star it was oscillating in you know thousands hundreds of thousands of independent frequencies.
And it's because we can really observe small wavelengths around the sun because the sun's so close. We can look at patches and you can see really small wavelength phenomena which of course on a distant star we're not going to be able to see that. Right? So the challenge when we look at any other star as I'll talk about is that we're not going to see individual patches. We're going to see the coherent light from the whole object.
Um but it really is like a musical instrument with with many many tones.
And everything I'm going to talk about for distant stars really was based on how we understood the sun. And so that's why I like to sort of use the sun first as an example of how we we being the community, the scientific community, sort of honed our skills on using observed frequencies to measure properties. Of course, for the sun, if I tell you I'm going to use this to measure the mass, that's kind of boring.
We know the mass of the sun already from many other techniques. And if I tell you I'm going to measure the radius, that's also pretty boring because we know the radius of the sun via many other techniques. So, the things we're going to do for these distant stars, which is indeed to measure their masses and their radi halfway across the galaxy, which is pretty profound, um is not is sort of not that exciting for the sun, but we really cut our teeth on the sun.
So, like I talked about for the Earth's ocean, it's also the case uh for the sun that as you go deeper and deeper into the sun, the temperature is rising.
And so if you have a wave, let's take this green one here, this wave that I launch at some acute angle, not radial, but I give it an acute angle. There will be a place where it reflects and it comes back out and it's just going to bounce around as shown there. And you can see as you make them more acute, there's always a turning point that's further out in radius.
Okay?
And so if you ask yourself what I'm going to see for a star that's far far away, these waves like this red one are going to be tough to observe because there's going to be a lot of cancellation of hot spots and cold spots. And so when I integrate over the whole stellar surface, the red things are going to go away. But I might see some of these other ones that are low, what we call low L, which is basically the L. Think of that as the wavelength, sorry, the radius of the star divided by the wavelength. So, I'm going to talk about oscillations that are radial oscillations or quadripolar oscillations or dipole things that are like the green and the and even this blue one. And they're much more of interest to us because they penetrate deep. If we really want to understand the properties of the deep core, we need to find waves and observe waves which have these properties of being able to get close to or near the center.
Um, okay. So, any questions at this point?
So, this this diagram is sort of generic. It's for the sun. It could be for any star. Any place where the sound speed is rising.
Okay. So, in the sun, this was all done in fantastic detail.
And what was allowed to be measured inferred is the uh sound speed within the sun. Here they like to plot the speed the square the square of the sound speed as a function of radius. So here's the surface of the sun. Here's the center of the sun.
And uh the theory the prediction pretty much agrees agreed back then this is like 20 years old. So better than 1%.
And it's actually what gave us a lot of confidence, us being the astrophysical community, that we knew how to calculate things like the sun and we knew how to calculate the nutrino emission. And when there was this outstanding puzzle of too few nutrinos, it was pretty hard to solve it with astrophysical games because we had this constraint.
Now, any idea why I told you the temperature should rise everywhere? Any idea why as you go deeper in the sound speed drops?
Why would the sound speed go down as you get near the surf the center? Pardon me.
What's happening in the center of the sun? Yeah.
Yeah. So, so gravity is getting weaker at the so the so the I'm going to repeat for those out there online. Um the the the response you're suggesting is that gravity's changing, which it is. Gravity is getting near zero at the center for sure. But the sound speed knows about the temperature of the plasma. And the temperature is definitely rising as you go in.
What else does the sound speed depend on?
The state of matter.
That's right. Has anybody ever done what you're not supposed to do and breathe a helium balloon?
Right.
What happens?
Your voice changes. Which way does it go?
It goes higher. So, what do you think the sound speed did?
It got higher. Exactly. So, why did it get higher? It got higher because the the mass So, so really the sound speed goes like the temperature divided by the mass of the particles. And the mass of the particles in air is some combination of N2 and O2. So, it's heavy. Helium is lighter. Okay. this. So helium's four and you know N2 is 28 and O2 is 32. So I don't know there's some mean you know they're molecules so it's like 30. So so the sound speed is way higher if you have helium. Okay. So the surface so this composition of the sun starts off with hydrogen and helium but at the center of the sun it's actively converting hydrogen to helium which is actually getting therefore heavier in this case. Right? So it's the because we're starting with hydrogen going to helium and that's why you see the sound speed drop towards the center. So it's remarkable confirmation that the sun really is fusing hydrogen to helium.
That's what's causing that minimum that turn. Okay. Um yeah. So it's you know so this works right. So you know we've got every reason to believe this is not a crazy uh pursuit.
Um in the sun you can measure things like the rotation. Pretty remarkable. We always knew at the surface of the sun that as a function of different latitudes shown here. So here's so this plot is showing as a function of radius.
So here's the surface here's the center.
Uh this is the fre the rotation frequency and this beautiful unit they love nanohertz doesn't help us at all tonight. Um but what you can see here is as uh the outer layers of the sun which you could see visually because of sunspots have different rotation rates.
This outer part from here dash line to the surface is the vigorously convecting outermost parts of the sun.
Once you get inside of that convection zone, this part of the sun is rotating nearly rigidly.
And of course, these are the hard points to get. I need to find the waves that go all the way in and the only way I'm going to measure rotation. And so those are tough ones to get um because there's only a few modes that do that. And this is again is 27 days. So, so we're not going to see, well, there's some indications. I'm not going to do that this evening, but we are getting not data nearly this good, but we do see data of some of the objects I'm going to talk about this evening, the giants, where we see evidence for differential rotation uh and um well, differential rotation and just measuring measuring the number itself, but I'm not going to really do that this evening.
Okay.
Now, where are we?
There's always somebody in the crowd who knows this ladies.
Okay, so I'm going to transition to stars for distant stars. I can't resolve them, right? So if I go to what's called a high L, L is just again roughly the radius divided by the wavelength. uh these hot these hot spots and cold spots are going to cancel, right? Because I'm going to integrate all this up. So I'm gonna have to see waves that are low low L. So I'm gonna say L equals Z. That's a radial mode. L equ= 1, L equals 2. I'm going to try to not use that jargon, but when I do, just think images like this.
Right? So if if you're far away and as the frequency of the wave, sorry, as over the period of the wave, this bright spot becomes a dark spot, you're going to modify the brightness of the star.
And those are the measurements that we can now make. So in distant stars around the galaxy, if you go to space and you stare and you make measurements, you can see that the brightnesses of these stars are changing periodically, but at very low amplitudes, typically 10 to 100 parts per million. So you can't do this from the ground.
That's the problem.
So, the first thing you want to do then is ask yourself, well, what if I went far away from the sun and and did the same measurement? What would the sun look like? I told you the sun we've got like millions of modes, but what if you just go far away and you just measure the sun and only do the stuff you can integrate over the whole disc. Um, and this is what you see. Uh, these are data in this case in velocity space. This is what's called a power spectrum. So on the y a sorry on the x axis is shown the frequency of the waves. Uh 250 seconds is shown there at 4,000 microtz. So I trans translated it for you. And what you see is this forest of all these waves right this forest of all these waves all these frequencies are independent oscillations. All of these and these are observed from from this was a this was an integral measurement of the solar surface. And so the only waves that were being seen were radial modes L of one and L of2.
But what's remarkable is the major thing I want to get a point across this evening is that you probably can see that they're equally spaced in frequency.
Again, if you've done musical instruments, this is not a surprise, right? If I add an extra node, the frequency doubles. If I add three, etc., etc. So all you're seeing here are waves where the there's there's the angular distribution around the star, but then the other piece is I have a place here where it's hot, cold, hot, cold, hot, cold within the star. And those nodes we count as n. The little n in that first equation uh in this equation is how many nodes there are in the whoops in the radial direction is this little n. And what you're seeing here are basically, you know, I'm going to just say it out loud like, you know, maybe that's n of 10, 9, 8, 7, six, right? These are just that's what you're seeing. This uniform spacing and what you can show is that the fundamental frequency delta new, which is this frequency spacing, is related roughly to the the integral, pardon me, is related to the sound travel time around the star.
Okay, so this is what the observer sees. You can measure the delta new right off this plot, right? It's just a frequency spacing. It's just screaming at you. You can relate that to this integral of the sound speed throughout the star, which is roughly the light tra the sound travel time, pardon me.
And that measurement directly because of the fact that the star has to be holding itself up due to gravity against gravity gives you immediately a mean density. So this goes back to the first equation I roughly wrote which is the time it takes a sound wave to go through relates to the dynamical time. And so if you measure this frequency spacing you infer what we call the mean density the mass divided by the radius cubed.
Okay.
And again, for the sun, yeah, it's not that exciting. We knew the number, right?
Now, there's another thing about this plot that's kind of funny. Um, I guess I should use my pointer so you can see it.
Um, as I go up to higher frequencies, so let's just say this is 10, 11, 12, 13, 14, 15, 16, 17. For some reason, you get to a high radial order and there's there's no power, there's no amplitude, there's no signal. And so the other puzzle was why is there a maximum frequency that I observe because there's another wave there. I mean I could always in an instrument I can just keep you know adding nodes and that has to do with the fact that these waves actually can just leave the star uh and create shock waves. And so if I go back if I go to this plot and this is the power what we call power spectral density. Just think of this as the amplitude how much motion there is. But I now go and do the same thing with different data set um but do it on a log plot. Here's that forest. As you go to high frequencies, it drops off dramatically.
And this is kind of tricky. So let me pause to try to explain this a little bit because this is seen in all stars that there's a maximum there's a frequency above which there's almost no power. And the way we understand that is as you get to high frequencies uh the waves as they get near the surface of the star the temperature is dropping as you get near the surface. So the sound speeds getting uh very low compared to the center right for the sun it's a it's you know a few million Kelvin at the center and at the surface it's a few thousand Kelvin. So it's a big temperature contrast big sound speed contrast. What that means is for the as the wave gets near the surface to maintain its frequency, what's going to have to happen to the wavelength that the sound speed is going down.
So it's fixed frequency.
So which way does the wavelength go?
It's going to get shorter and shorter to try to maintain frequency. And there's a magic distance in a star which we refer to as a scale height. It's how far you have to move to have the pressure drop.
It's the 10 meters in water. In air, it's I just flew yesterday. It's roughly 30,000 feet, right? There's a reason you're at 30,000 feet because you're Well, it's a different that's a tropos.
It's different. Um, but the point is is what happens is these waves get near the surface. If the wavelength is very long compared to that last scale height, it sees it as a boundary it reflects from and so it's sort of trapped. If the wavelength is very short, it just tunnels through and leaks out.
So there's a frequency above which the stark becomes very leaky and no matter how you excite them these waves don't get to large amplitude.
This is called the acoustic cutoff for those who want to sort of look it up.
But the acoustic cutoff knows then it's measuring this last little scale height.
It's measuring the thickness of that top layer of the star. And the thickness of that top layer totally relates to gravity at the surface. little g which I've shown here is just the gravity divided by the times the mass divided by the radius squared. You have a high gravity star that scale height's smaller low gravity star the scale height's bigger but you measure the surface temperature of the star by doing spectroscopy from far away and therefore you have the sound speed and that allows you by measuring the scale height to get little g.
Okay, so that's a lot of physics in a short period of time.
It's not going to get worse because we're going to start talking about data.
Okay. But I've shown you that by measuring the frequency spacing, I can measure the mass divided by radius cubed. And by measuring this maximum frequency, which is sort of defined, you know, somehow mathematically by this maximum power, I measure the mass divided by radius squared. Two independent measurements.
So I combine them to then get the mass and the radius of the star.
Okay. So this is all done for the sun first and I'm going to show you now it's been done for thousands of stars across our galaxy. And that's what's new. Well, it's not it's not really new but it's you know it's not in the textbooks yet.
So it's new. So in the sun we understand the reason these modes are excited by the fact that the outer last outer 70% of the radius of the sun is convecting. It's noisy. It's rattling around. All of that noisy rattling around creates some oscillations that end up getting to a finite amplitude.
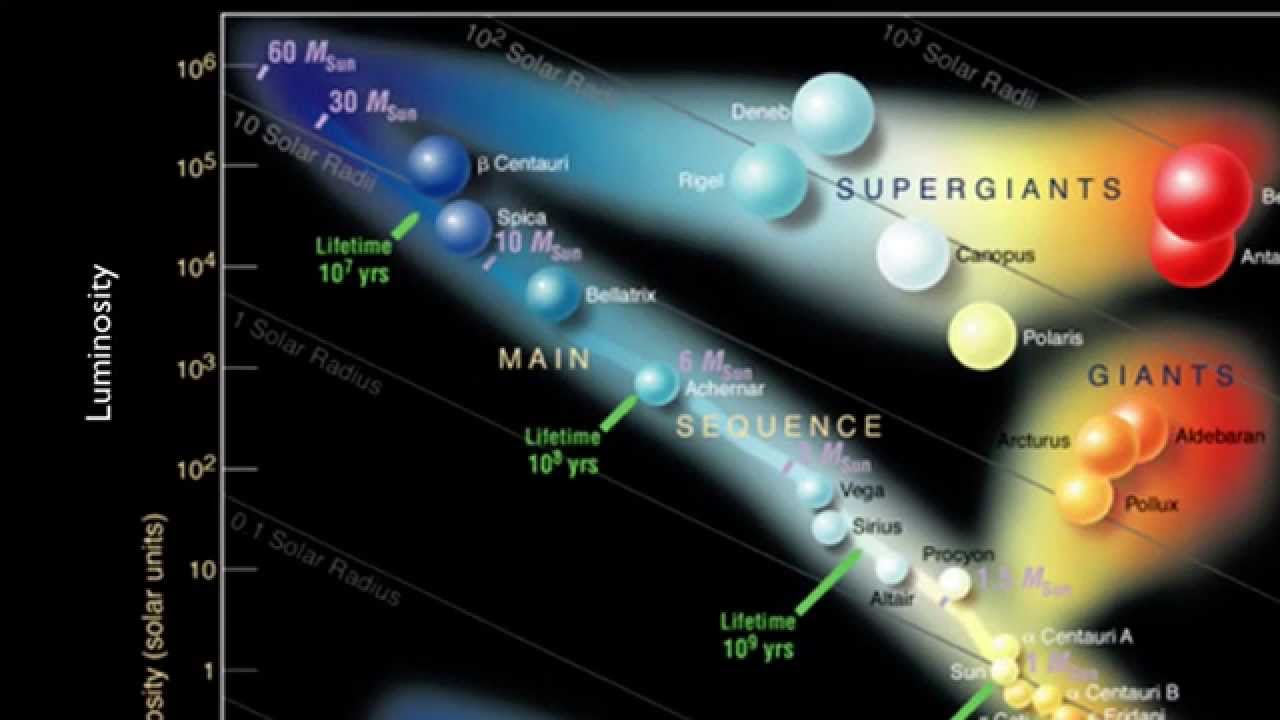
And the stars we want to talk about now are stars. So what's shown here is the luminosity of a star is a function of its temperature as it evolves in time.
So here's the sun sitting today about right there. As the sun runs out of hydrogen in its core, it develops a ball of helium at the center becomes what we call a red giant where it gets extremely bright. So it'll get up to about a thousand times the luminosity of the sun. These stars at this point are thousand times 100 thousand times brighter than the sun. All of this outer part of the star is fully convective roing around. And therefore there was a hope and expectation that just like in the sun this convective envelope would create a set of standing waves that would be visible.
And because the star is bigger, the periods are just going to be longer.
Okay.
Uh so two space satellites were uh launched now. Well, now it's it's been over a decade ago. Coro, a French satellite, and Kepler, which is a US satellite, which were both reasonably small diameter, 27 cm diameter, 95 cm.
Um and these missions really were most famous for finding planets around nearby stars by just staring at stars.
and seeing the rare opportunity for a planet to come in front of the star and cause a little bit of dimmunition and its light and then you'd see it again and again and that would tell you that you had a planet, right?
However, uh all that we care about for what we're doing is just anything that's measuring the brightness of a star has the opportunity for finding the star just oscillating.
And so that's what happened. And it happened first um uh with CRO. So this is a kind of a busy plot. But what I'm showing here are uh this plot on the left each panel as it goes across is a different star. It has some code name which doesn't matter. Okay. On the on the y ais is shown the the power spectrum. How much how large the amplitudes of fluctuations are. So now you're missing brightness. That's what you're measuring. and the the x- axis are the frequencies. Okay, so for those who've done 4A transforms, this is just a power spectrum of the light curve.
That's what this is mathematically.
And basically everything they looked at, all these red giants were oscillating.
Okay. Um from the ground, you can't do this. Uh there's too much noise in in looking through the Earth's atmosphere.
So it was sort of duck soup once you went into into space. And I'm sparing you. You know, there's many people who spent a lot of their life trying to get this on the ground and it was just hard.
So I'm not talking about, you know, 20 years of hard labor because once they went into space, you could do it.
So these modes again are few hours to many days. Um these are modes that if this if the star stopped convective, they would they would die in about a month. So these waves are they're being excited and they're damping. Okay?
They're not oscillations that are being naturally caused by some exitation mechanism. It's just ringing.
Okay, that was the Crow satellite.
Uh Kepler did the same thing. And again, these are six different stars. I've put a sort of an indicator there uh that this is roughly a three-hour period. But if you start to stare at these, maybe you can see like this one's pretty good.
You can kind of see the frequency spacing, right? You can kind of see it here pretty well.
Um, so you can go ahead and then divide this these frequencies by what you think the frequency spacing is. And and that's what's done here. So the frequency divided by the frequency spacing. This would now be the n what we call the radial order uh of these different modes. And basically you can start to see that these are n of 10 or 15. If I go back, you can also start to see these are ordered on the graph as the frequency of maximum power. So this star, you see out here at high frequencies, there's nothing. Whereas this one, there's a lot.
Okay? So these stars also have a different frequency of maximum power, which means they have different little G's. GM over R square is different. And you can I mean it's remarkable, right?
know the instrument's working because for this star it has plenty of noise up here but this star it's dead quiet and that's because all those waves though they're being excited are just leaking and leaving the star.
So this is you know quite remarkable how this all worked.
Um so how so Rich I don't know if Rich is out there he's on YouTube he might be screaming at me right now.
So, I've sort of given you the observational story, but if we're going to go quantitative, we actually can't just do the little loose tilda physics I talked about.
And to do that, for much of what the community is doing, not just those of us who uh use these tools, there's two different instrument two different software instruments we use. One is called MESA which is modules for experiments in stellar astrophysics which has been around for about a decade which is an open source computational tool that allows you to calculate and evolve stars.
Um and then the open source tool that Rich has been developing and continues to develop was called GIRE which allows you to take a stellar model and calculate these natural oscillation frequencies.
And um if you look at the papers in this community, even though Rich may not be on them, they're using GIRE to do almost all of their analysis and they're using MESA to do the stellar structure. And that's what allows you to then quantify going from seeing this sort of, you know, it's a little kind of ratty, but these measurements to actually then calculate the actual oscillations.
And so here's really early, this is a paper from 2013. So right when uh some of the data started coming out, this was Coro data. Um they just showed the masses and the radi of these stars, right? So you like again you get you get two parameters and you just invert it.
Um and again for those of us who do astrophysics, the notion that you're taking a single star that's halfway across the galaxy and you're telling me its mass and its radius, I mean that that's really profound. we just have no way to do that, right? Um if it's these are evolved stars as well. So you can also using theory this also this depends a lot on theory but also you can calculate the age right and you know you might get a little worried if you start to see um this is uh well you know if you get something bigger than the age of universe you probably have an error but let's not worry about that but this was early days uh and again there's you know I'm sparing you you know much more accurate and detailed things but there's one more thing you could do so now you want to test right so we're always confident as physicists and astrophysicists that we're confident, but you really want to test this stuff, right? So, how would you test how would you test this?
Any ideas?
I got a star halfway across the galaxy.
I've told you its mass and radius.
I mean, how would you test how would you test it? Any ideas?
nearby stars.
Okay, one is you can look at nearby stars, but you have other ways of getting out those parameters. So, one would be you have a star where maybe you know uh it's maybe in a binary. So, you actually you might have a star that's in a binary and therefore you think you know its mass because of binary relations and that was done and that confirmed the masses were good to about 10%. So, it's one way to start to quantify, right? What about if you have a star on the sky and you know how bright it is and you know how hot it is and I've now told you what its radius is. What can you tell me if I've told you its radius?
Well, so hang on. So I've got I've got a let me ask a different question. I tell you uh you know I've got I've got a point source of light basically right I know how bright it is to my eye and I now tell you and I've measured its temperature I actually know how hot it is and now I've given you its radius right well if you know the brightness on the sky and I've given you everything else you can actually tell me how far away it is I can get the distance Okay, so for every one of these stars, there's embedded in here a prediction for the distance to the star.
Okay, so how do we measure? So that's profound. We usually don't have a way to measure a distance to a star, right? The traditional way of measuring distances is what's called parallax, right? which is which is looking um at at a star when the earth is you know six months later to see how the star has changed its apparent position relative to some distant background right that's called parallax and that's a geometrical measurement and that is a you know that was you can't argue about that measurement and that gives you a distance so the satellite Gaia was able to measure distances to many many stars and therefore allow allowing us to confirm or deny uh what this looked like. And here's how well it work worked. So what's shown here, this is from the work of Joel Zen who at the time was a graduate student at Ohio State. Uh the distance um found by Gaia do it using parallax.
Okay, so this but a space satellite but still just using parallax versus the distance that he called the seismic distance, the distance inferred from seismology. So here's the things where they should all be on the line. And here's you can now see where I subtracted them. So you can see that for many these it's it's like a 5% measurement.
Okay.
So that's fantastic. So now we have a way for giants to do that. And you can go ask where they are uh on the sky. Oh, sorry. Different distances. For the Kepler satellite, it only looked in certain directions, which is why this is a weird plot. You know, this isn't really what the galaxy looks like, but this shows you where they are. Um, I haven't talked at all about the test satellite. That's a very active satellite that NASA launched again to do extra solar planets, which is also now measuring uh these same phenomena. And this is a recent paper showing uh distances to this is pretty nearby. You can see a kilo parse. But again, a profound ability to measure distances to stars within our galaxy.
So let me just wrap up by really sort of highlighting that these new observatories the space observatories in particular those three Coro Kepler and now TESS have really allowed us to do a lot of interesting galactic structure.
I've not told you everything we've been able to measure. Uh theory is a really key part of the story. So I always like to remind people you know the profound thing we get to do as scientists which is to take a data stream which looks like that which looks like noise to the visual eye right and we have a way to take that noisy thing and turn it into measurements of the mass and the radius and I didn't tell you but we can measure rotation rate uh we think we can sometimes measure the age and sometimes even infer the magnetic field. There's many more stories I could tell you this evening, but it's just a wonderful thing to imagine the strength of sort of quantitative reasoning and science that allows us to take measurements like that and really quantify things. So, thank you very much and I look forward to more questions.
Up Next
64:28
Introduction to Asteroseismology: Probing Stellar Interiors
@nrui
406 views•2022-04-19
61:17
First Billion Years of the Universe with the Square Kilometre Array
@iaaudc
121 views•2022-05-26

6:25
Kepler's Laws of Planetary Motion Explained (Educational Astronomy Video)
@Peekaboo_Kidz
404.9K views•2023-02-17
6:10
Gamma-Ray Bursts: Cosmic Snipers Explained | Astronomy
@kurzgesagt
15M views•2016-07-31
Related Study Plans & Knowledge Roadmaps
Structured learning paths in Astronomy
astronomy
Reionization: Pop III Stars, IGM & 21cm Line
01Foundations of Cosmology & the Early Universe
02Population III Stars & Cosmic Dawn
03Physical Mechanisms of Reionization
+ 2 more learning modules
17h5 modules
Explore Roadmap
astronomy
Planetary Rings: Dynamics, Roche & Resonances
01Foundations of Gravity and Orbital Mechanics
02Tidal Forces and the Roche Limit
03Structure, Composition, and Collisions
+ 2 more learning modules
10h5 modules
Explore Roadmap
astronomy
Asteroseismology: Stellar Waves, Ages & Cores
01Foundations of Stellar Astrophysics & Wave Mechanics
02Stellar Oscillation Modes: P-modes and G-modes
03Mathematical Framework of Asteroseismology
+ 2 more learning modules
35h5 modules
Explore Roadmap
astronomy
Adaptive Optics: Physics, Engineering & Control
01Foundations of Wave Optics and Wavefronts
02Atmospheric Turbulence & Optical Distortion
03Wavefront Sensing Technologies
+ 3 more learning modules
35h6 modules
Explore Roadmap