



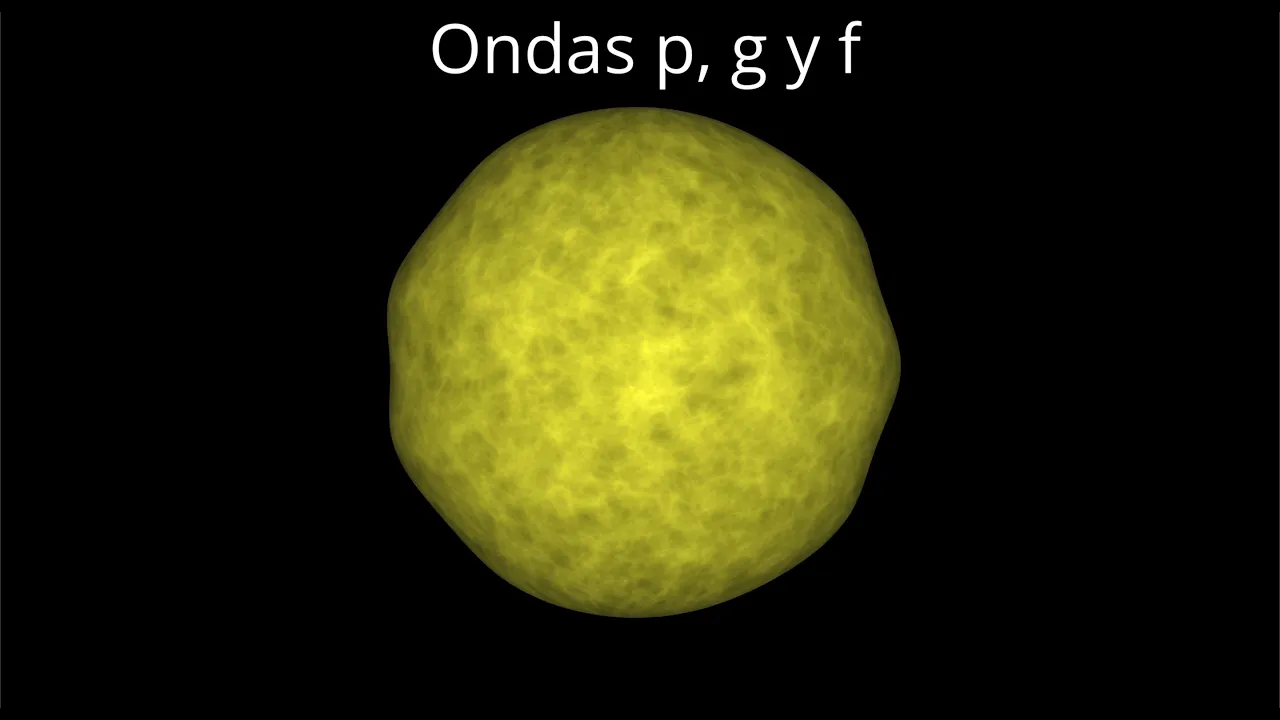
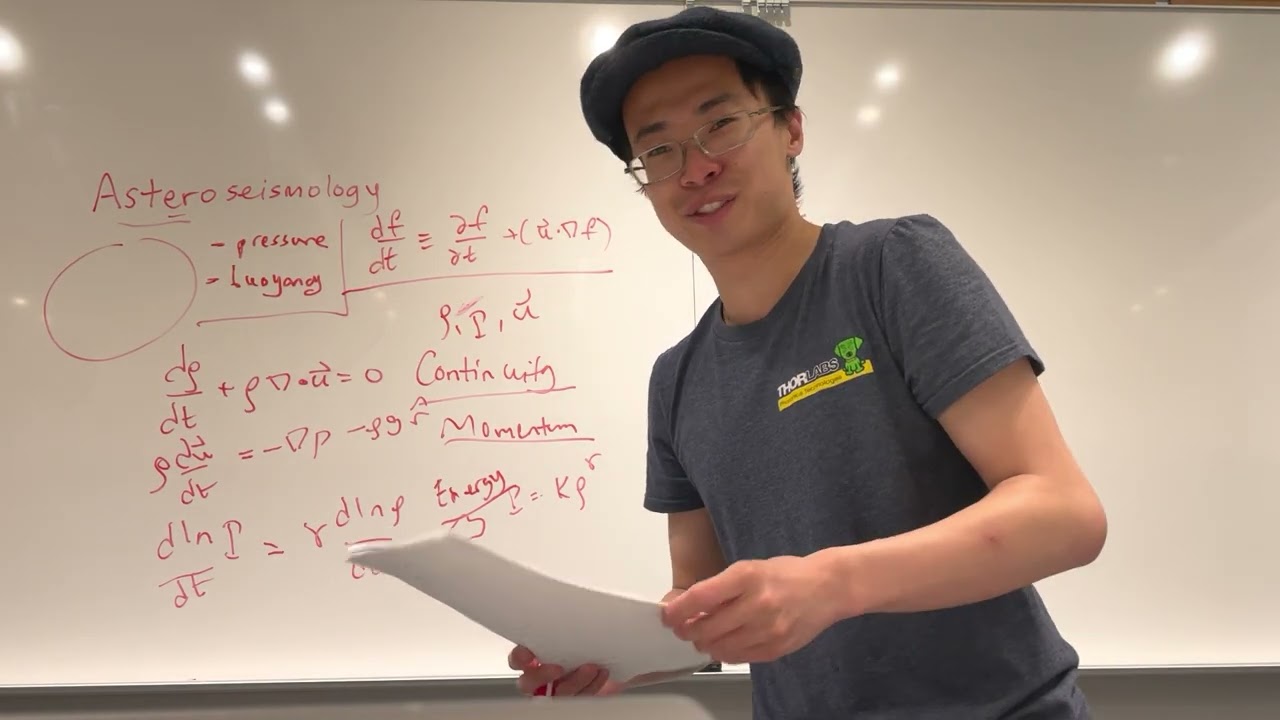









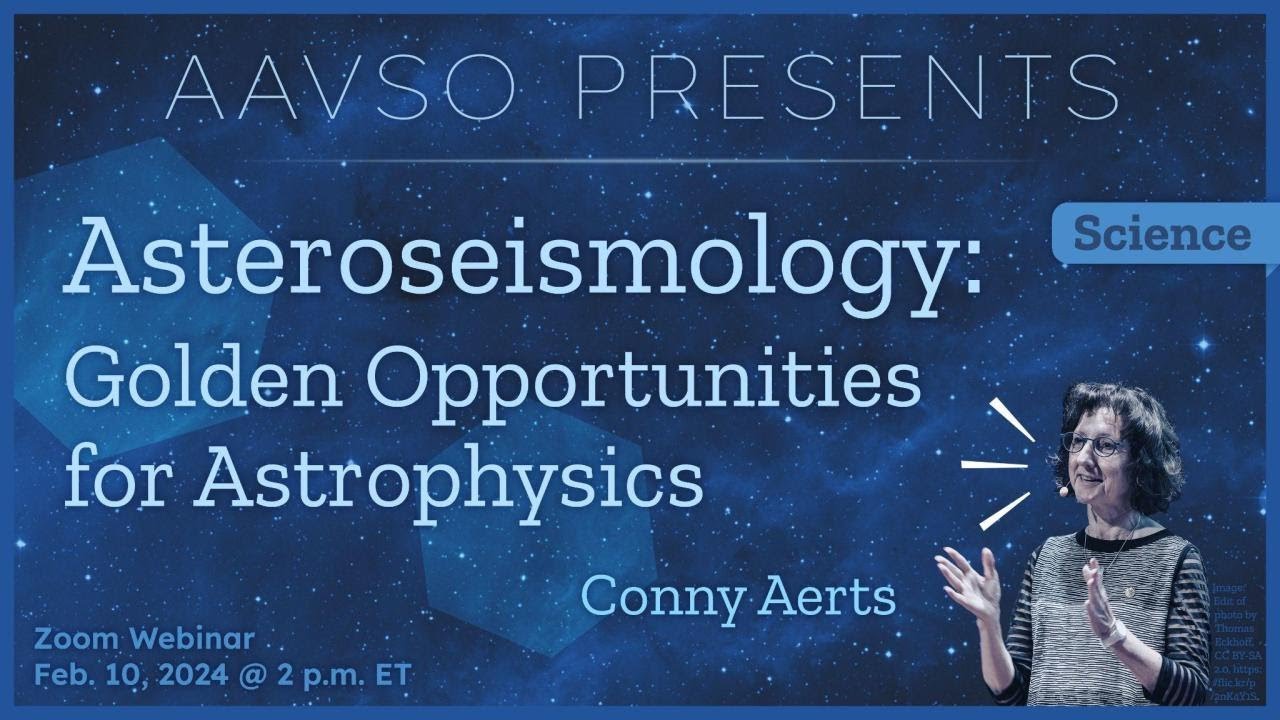




Asteroseismology is the study of stellar oscillations that allows astronomers to probe the interiors of stars by detecting sound waves (p-modes) and gravity waves (g-modes) that travel through stellar layers; these oscillations reveal information about internal rotation, chemical mixing, and structural properties that cannot be obtained through direct observation, enabling precise measurements of stellar masses, radii, and ages across the Hertzsprung-Russell diagram from solar-like stars to massive stars and red giants.
Decade of Asteroseismology: Probing Stellar Interiors
Added:Fundamental stellar structure and evolution, including the main phases of a star's lifecycle and the Hertzsprung-Russell (H-R) diagram.
Basic wave mechanics and acoustics, specifically how pressure waves (p-modes) and gravity waves (g-modes) propagate through fluid mediums.
Observational astronomy techniques, particularly high-precision photometry and Doppler spectroscopy used to detect minute stellar pulsations.
The principles of helioseismology, as the study of solar oscillations serves as the foundational framework for asteroseismology.
Advanced stellar modeling using computational tools to integrate asteroseismic constraints on internal mixing, convection, and core overshooting.
Galactic Archaeology, leveraging ensemble asteroseismology of red giants to map the formation, age, and chemical evolution of the Milky Way.
Exoplanet characterization, applying precise asteroseismic measurements of host stars to determine highly accurate physical parameters of orbiting planets.
Compact object seismology, examining the pulsations of white dwarfs and neutron stars to probe the physics of degenerate matter.
697 views18likes57:13Original Release: 2016-08-01
thank you very much for this very kind introduction it's a pleasure to be here and I'll try to educate you in a field of stellar physics that's perhaps not but most of you are doing in your daily research but after last week's experience we had a whole week of interactions between extra galactic scientists and seller physicists it was very interesting so I think we can all always learn from each other yeah so I thought that this audience was perhaps not experts in Astro seismology so let me first try to explain you what it is and why we care about it how it works in practice what we do in our daily analysis treat some various types of stars that may be of interest for broader communities and let's see where we move on in the future I tend to call our sources knology of course I have a biased opinion the revolution instead of physics and you may or may not agree with that by the end of the talk oh that's wrong so in general stellar physics is very well aware of describing how stars live their life they get born out of interstellar clouds in some live in clusters others are more isolated in the galaxy and we can study these very well in our own galaxy but also these days in galaxies further away and we know that stars can have essentially three evolutionary paths and stars like the Sun have a quiet life as I call it and they will die as a white dwarf while a star that get born with a higher mass they tend to have a much more rapid evolution they do nuclear burning cycles making all heavy elements and so they are steel factories of the universe so to speak and after the supernova explosion they end up as either neutron stars or black holes so this picture of stellar evolution is broadly known and so one could wonder what is there still to learn in the category well as I say the devil is in the details because if we are honest than the stellar evolution models that people use today and anyone many astrophysics topics do use the outcome of stellar evolution computations internal rotation of stars there's only there was only one star where we had some information that's the Sun until recently we have made major progress on that internal magnetic fields of stars well at best we can measure magnetic fields on the stellar surface juicebox spectra polarimetry but we would like to know how it works inside and an important aspect really is the mixing inside stars it is very hard to study because we simply only get information from the outer layers so the beauty of asteroseismology is that this concerned seismic studies of stars very much like seismic studies of our own planet in fact in terms of methodology and that allows you to probe the interiors of stars without being able to do experiments on this interior this was one of the big frustrations of Eddington that he could not find a way to probe the interior of the stars much more difficult and then probing the outer universe so what is the interesting aspect if we can detect oscillations of stars then we can know how the stellar structure is built up and how it behaves physically and so this is drawn schematically here on this very simple diagram where you have these wave patterns drawn the red one is an oscillation that gives rise to a wave that probes the area in this outer layer of this hypothetical star here and you have another oscillation mode this purple one that probes the entire interior of the star and then you have this green and yellow so oscillation of stars are our star quakes if you like and they invoke waves and the travel time of the waves through the interior says something about the physical conditions in these layers like density pressure temperature so if i extrapolate that let's look at this green and yellow wave structure here you see that the yellow one probes the physical conditions in a slightly different area than the green one so what do seismologist want to do we want to measure frequencies of such waves subtract them from each other and that then allows you to derive the physical conditions of the area inside the star that screen here but not yellow and if you extrapolate that to many oscillation modes then you can build up layer by layer the physical conditions inside the stuff now of course we can't look inside the star so we don't see these wave patterns what we do is we try to measure the oscillation frequencies by looking at the consequences of these star quakes at the stellar surface they give tiny little brightness variations and if we measure them over time we can deduce the frequencies of the quakes yeah and so that's basically how it works so I always tend to compare that I give a lot of outreach talks with music because it's in fact sound waves and if I were to i have an outreach talk next week and then I bring my flutes and I put myself behind a podium and I store I start with a quiz from the audience because immediately from the sound that you play on a small and a big flute the audience even if it's kids knows very well first of all that it's a flute and secondly which one is the small and the large when the frequencies tell you immediately the extent of the musical instrument so to speak so stars are just musical instruments for me as i said in practice what we do is a measurement like you could call it a seismometer so here is time and here in this case it's tiny little brightness variations that seemed to be scattering noise but if you put that into a fourier domain then you get beautiful oscillation frequencies that pop up yeah that's that's what we do in practice so here is a reality in in cartoon where four stars have been measured by the Kepler satellite is a real data and from this you can see that the amplitude of the oscillations change according to the size of the start and also the frequency this goes up and down much faster than this which is a very slow wave pattern because the sound waves travel through a big star right so by measuring these frequencies you immediately get a grasp on the size of the star and sizes of stars are connected to ages of stars in a certain way so this already gives you a feeling that we can somehow did you stellar ages and that's I think the most important quantity that asteroseismology can deliver the astrophysics because stellar ages are even important or interesting for cosmologists let's assume we could measure the age of the oldest star in our galaxy that would be a major interesting measurements we can't do that yet but we are try but that's the principle so we can't look inside the stars this is these are wave patterns as I've shown before here of gravity mode oscillations previously it was from sound waves but we measure the frequencies and the frequencies are connected to the internal physics of the star and for that we have a mathematical physical model and we try to connect the measurements to the date in that way now what you also know that's again an experiments I do with the flutes if you have a rotation inside a star yeah if an orchestra plays and you make the podium turn it's awful it's terrible because of the shifts of the rotation of the frequencies of the sound waves okay and so when we measure shifts in frequencies of oscillations we know that they are probably due to rotation and if we can do that for waves that pass through the cellar interior we can measure the internal rotation of stars and that's the second aspect that I think is very important for astrophysics and so we can compute more or less how this shift occurs again this is a function here that contains the physics of the star and this is something the internal rotation rate that we don't know in general because at best we can measure the surface of a star the rotation at the surface of the star at best usually it's even projected because there is this annoying inclination angle between us and the star so we are very far from deriving this function here that's a major goal of ostracism ology how does it work in practice this is a quite mathematical field in astrophysics so that's why I like it so I'm there on the one hand we have the observational parts on the right-hand side so we do time series observations we really need a long string of data to measure the oscillations and we need high-precision data either in brightness variations or velocity variations that also works we frequency analyze them and we get the observed oscillation frequencies and then on the other hand we have stellar models and in the very simplistic case that we think we know input physics then we have a six dimensional parameter space let's say where the initial chemical composition of the star X and Z is unknown to us the mass and the age of the star and these alpha parameters they are parameters connected to convective motions inside the star so we don't really know well how convection is taking place inside starts and we sort of the time-dependent time dependent convection theory that's described by two parameters alpha mixing length theory just says how convective bells travel the distance over which they travel before they lose their identity and the overshoot parameter is something very important for very massive stars that have a convective core so their nuclear reactor is continuously mixed and so when convective bells reach the boundary of the convective area into the radiative zone they can't abruptly stop right to have some inertia so they overshoot and if they overshoot they bring in new fuel in the nuclear reactor so that's the amount of over should we don't know and so that's again a parameter that we want to determine so assuming that we are perfectly aware of the input physics inside stars and this is an illusion this blue box but anyway that's what people who use outcome of stellar evolution models assume we can compute the theoretical pulsation frequencies and we couple these to the observations and the aim is well either this works well and then people are happy because we can get a mass a chemical composition and an age with a precision that cannot be reached with any other method so far I am much more happy if it doesn't work yeah because if it doesn't work then that means that this blue box here is not optimal and that's what I would like to work on so you you have two categories for Astro seismology delivery of high-precision biases and ages to the community of astrophysics let's say and stellar physics where we want to improve that blue box I mean that second category but it doesn't matter okay now from the point of view of theory we have two extreme descriptions for the oscillation modes we have what we call pressure and gravity most pressure modes are just connected with sound waves you all know this very well and so they are in the regime the high frequencies if you mathematically express that high frequency modes you can connect the frequency patterns that you measure to the sound speed inside the star and this is what has been so successful for the Sun on the other hand they so the sound waves have the dominant restoring force is the pressure force in this case on the other hand the dominant restoring force can also be brilliancy and then we have gravity mode oscillations this is perhaps less familiar to daily life let's say but you can compare it with the waves on the ocean so they are dominantly more horizontal motion and here you do not expect patterns in frequency space but in in the period space of the oscillations and now we can measure it these days so that's basically the theoretical framework that we apply in our daily research of course the showcase of the Sun is really our calibrator for the whole methodology and so here you see solar like oscillations strength as a function of frequency yeah and so all these lines here are the beautiful solar oscillation frequencies sound waves these are pressure modes in the case of the Sun and you do not need to be an expert in time series analysis to see that this is another random scatter here there are clear patterns right so this is the large frequency separation which is connected to the interior sound speed inside the Sun okay and so if I were to blow up this then you could see some refined structure the lines are a bit thicker here and here and here and so on yeah so this whole structure if you analyze that in detail you can measure the shifts in the basic sound frequencies due to rotation as I said before and that requires very refined measurements if you do that sorry now this is the Sun as a star yeah but but for the Sun we can do both of course that's the only store where we can do it both I'm just comparing this to start to come where we only have the integrated line yeah so if we invert these frequencies remember that there was this formula here huh this one yeah we invert this integral equation we measure this we identify these wave numbers we know more or less the basic model of the Sun and then we can say something about the interior solar rotation okay and that is what you see in this color plot here so the Sun is another rigid rotator and as you can see in the outer convective layer which is indicated here there's differential rotation but as you go in in the radiative zone here this dash line is the transition from a convective zone to the radiative zone inside the Sun then it becomes almost rigid and this was sort of going against the idea that there was a dynamo in the interior of the Sun that creates the magnetism because it's the opposite okay so here you see that plot so differential rotation in the outer layers of the Sun that's what we have been measuring up to 30 years ago you have a question for the Sun we have a fairly unique solution to the rotation profile I should say because we have hundreds and hundreds and hundreds of acoustic modes detected in frequency and the precision is mean we have more than 20 years of data right so and we have a very good solar basic model that was already close to reality so this inversion and the revision of the rotation works very well if you have a blue box let's say that's not too bad but you have to be close to your solution okay so that's one of the things where we are not as far yet for stars and for the Sun on some aspects but I'll come to that yes I know that's a very high simplification yeah I'll also come back to that because indeed the Sun is just one simple star and now we want to do that for all sorts of stars yeah that would be great so here is a famous heard from Russell diagram but this time from seismologists that means that all these areas that you see indicated here sorry these are all classes of pulsating stars so you have the evolution indicated there with some tracks full black lines and all the ellipses there indicate stars where we know if a star passes there throughout its life it starts having oscillations for whatever reasons yeah and you see that we can do in principle seismology throughout the lives of the stars in very many different phases so one of the key issues for nucleosynthesis computations for instance in our galaxy and other galaxies is about massive stars these are really the nuclear reactors of the universe and so what we would like to know is this overshoot parameter for them because that determines how much fuel is in the nuclear actor and how long they live and up until let's say a few years ago we were just assuming that we had an overshoot value of of a specific size now we can do knit seismically so that's one of the aims if you cover this this HR diagram and see all these stars then we have oscillation periods that range from a few seconds up two years so this tell you that there is an immense variety and that's of course connected to the huge difference in size and density of stars okay how does it work in practice well we have received an immense boost it's really a nice period to be in astral seismologist in these years because we have two space missions that were originally designed and sold and are also doing exoplanet hunting so what do you need you need ultra high precision when planet passes in front of the star that you can see transits parts per million precision but that's exactly what I as a seismologist also needs to find the stark ways so we have this very nice collaboration in the exoplanet and seller physics community because we both need the same data and they can have their planets and I can have the quakes that's the way it works in practice okay so uninterruptedly da this is a pulsating massive star measured by kuro this is a pulsating intermediate master measured by Kepler you have to imagine that some stars do have periodicities of their oscillations typically one day so I did this type of study since very long from Earth observatories walking to my telescope every night and I introduced a periodicity of a day into the measurements because that happens to be the periodicity of our planet where we live on and then you have to cut in these light curves daily and then it says if the star doesn't know Satan because after they sort of back at oscillation face so this is really a big step ahead the space missions having uninterruptedly or longer-term periodicity yeah so how does that work in practice here I show two stars I like these to start because they are almost copies of the Sun and they are together in a binary system and you see here the beautiful chrome structures of frequency this is power in terms of intensity here and again you see this very clear structure in the frequencies and a large frequency separation so characteristic of oscillation waves that are sound waves so what what do we do as for seismologist we have this frequency separation we cut paste and put the frequencies on top of each other in what we call on a shell diagram so here you see frequency frequency model the large frequency separation yeah and this frequencies you know the Sun had peaked at 3 milli hurts I forgot to mention that and here you see this star pick set well between two and two and a half million earths and this one a bit further so these are copies of the Sun from there outside but the oscillations already tell you that they are a bit larger bit lower frequency think of the fruits of the violin but that means a bigger musical instrument ok and so then from these structures we can do this modeling according to the scheme that I have explained and that gives you then a very tight constraint on mass radius and H now for these two stars these are among the brightest stars observed with the Kepler satellite this is way beyond the capability originally designed by the engineers because this is so bright objects that you have a saturation of your see CDs but that works magnificently so that was a very nice progress that we could make and in this case if you look at these measurements here the red are the theoretical predictions and the black symbols are the measurements and for most of them you don't even see the errors because it's so precise but if you subtract it from each other then you see some kind of deviation and that's what plotted here so deviation as a function of frequency for different types of modes so the colors mean different types of modes according to the quake structure let's say yeah the vertical axis is frequency in Mille hurts sorry about that and this is frequency modulo the big frequency spacing so the spacing that you can measure between these we call that a Nichelle diagram it gives you the structure of your oscillation yeah yes it these are all different modes so we know but then we have to zoom in in a refined way into these frequency Peaks because they have a certain width and if there is another type of mode excited and that must mean that there is another that there is a detailed in the physics that is different we calculate the frequencies in the assumptions that we have an eigen solution to a mathematical problem so we cannot really explain small deviations from the peaks that you expect right we can also not compute the height of these Peaks because that's very that's determined by the very non-adiabatic outer layers of the star where you have energy loss and we do not master the way to compute that yes no so I can say how big the star is what its mean density is but I cannot do a refined interpretation of its physical processes in the interior without exploiting it that's what you would need for my blue box right okay so I was explaining about these deviations that you see here and these are periodic deviations that you expect from the pattern and that's connected with the fact for these stars that we have helium settling in the outer convection zone we know that also for the Sun so from fitting these deviations and playing with the helium content we can derive in a non spectroscopic way how much helium is in that convective zone this is also a new aspect of stars that we don't have because these stars are cool and they don't have helium lines in their Specter okay let's move to other stars now the Sun will evolve to a giant when it has exhausted its central hydrogen and we'll do a hydrogen shell burning and after that helium core burning some stars start helium core burning explosively after what we call a helium flash because the matter is already to degenerate when you reach the temperature for the triple alpha reaction some stars avoid that because they are not degenerate in their helium core from the outside we cannot tell the difference because these are just big red giant stars it's purely an inside process that make the difference between these two evolutionary states and so one of the big discoveries that we were able to do from Kepler you can see here this is again a Nichelle diagram so frequency as a function of frequency versus mean spacing yeah and here you see a ridge of mouths you see another one if I go back to the previous plot so you see here four ridges yeah and so that's what we had expected also for these stars there's a ridge here that are here and this is a whole mess and that's fantastic as I said I am one of these people who prefers to be in trouble because then you learn something and this was a major discovery made by my student Paul Beck and i'm showing here mixed most this is an animation of stars that have mixed modes and these modes they have acoustic character in the outer envelope and in the interior they have gravity mode character so these are the two restoring forces that play together and in that sense you can probe much better the interior of the star because gravity modes are the ones that probe the internal regions we don't have such modes in the Sun so this is physics we can't do for the Sun but we can do it for successors of the Sun and so we have thousands of red giant pulsations now where we can then have the two diagnostics so sound waves gives you frequency separations and these coupled to the internal sound speeds gravity mode oscillation give you period spacings and these coupled to the interior boo you'll see frequency as we call it and that is connected with aging because if you can probe core regions then you have a better handle on the age so here you see all our Kepler stars the frequency spacing on the x-axis and the period spacing on the y-axis so by measuring these two numbers in frequency analysis for all these stars you can see that these are the stars that are in the red giant branch these are doing hydrogen cell burning well these stars here are doing helium core burning and so we can see what type of nuclear reactor they have independently of their similar serve and the red dots here are stars that are burning helium but that have avoided a helium flash because their course are not degenerate so this is a major asset now and this helps galactic people with their studies because by measuring two numbers from oscillation spectra we can tune the ages of stars I'll come back to that later on another major discovery is again the rotation because these same mixed modes after more than two years of monitoring with Kepler that's the time we need to resolve the rotational splitting we were able to deduce that the rotational splitting in these mixed mode so here you have radial nodes a little too much these are these mixed modes that have this messy pattern in the HL diagram and these do feel the rotation of the star in a different way because some of these modes here I've plotted these kernels that are in that expression these ones have pressure dominated let's say that means that the dominant restoring force there is pressure force but they are also affected a bit by buoyancy and here it's the other way around and so these functions are different and if you plug them into that equation then it means that you can use the gravity dominate mixed mode to get information on the core rotation well if you use the pressure dominated mixed mode you can get information on the envelope rotation and then you can see if it's the same or not we cannot do this for the Sun so that's a bit weird you're in the situation that we can do this now for several thousands red giants in our galaxy but we can't do it for our own Sun the masses of the Giants are well if I go back we go from more or less point 7 2 2.5 intermediate masses I would on the next slide no no this is just a very small zoom to show so in practice the we go from let's say 40 to 300 micro hurts more or less for red giant stars yeah and so here is this I like this plot I made it recently here is a the gravity of stars that's sort of saying how old they are it's connected to their evolution and on the y-axis is the rotation frequency of stars as I said it's very difficult to measure this because in general spectroscopy is just measure V sine I the rotational frequency projected over the line of sight and at the surface right here you see a diagram where we can now through seismology do the core rotation rates yeah and these are all these black sorry blue dots these are all red giants for which the core rotation has been measured from mixed modes and seismology for some stars a detailed inversion was possible and so you see the core rotation connected to the surface rotation frequency by this dotted line our son is here I cannot plot a blue dot for the Sun we don't know how the solar rotation is in its interior we just don't know and a major? there for the exoplanet fans among you this angular momentum diagram is very empty for the moment and we would like to fill it in this area when stars are younger because angular momentum loss or transport or distribution in host stars of planets is connected to the total angular momentum of systems so that's something to keep it right now let's move on to higher masses yeah here are kept data all period the grams I'm showing our from Kepler of A&F type so intermediate-mass stars yeah and you see we go all the way from near zero micro hurts very low frequency up to 250 micro hurts so that's an immense range here and this is an example of a very nice star that has both high frequency oscillations strongly picked here and low frequency so these are stars that are now very different from solar like starts in the sense that there are no acoustic modes due to outer convection but these have self driven modes that have a very different pattern here and this seems like a very sparse frequency spectrum but if you zoom in and do a detailed analysis then you see hundreds of frequencies and so from this again this is what we call hybrid tow satyrs gravity modes and acoustic modes and we can deduce the average rotation of this star it's 65 days index in this case and envelope to core rotation again for these type of stars so this is another one like that and so if you find one that does something weirds then you so question is is an exception it's not the case there are intermediate-mass stars whose rotation in the core and in the envelope are almost the same and that should not really be because during evolution these stars grow a little bit and conservation of angular momentum would imply that their core would tend to rotate a bit faster and their envelope bit slower that's not what we measure so interior rotation of stars has surprises for us and moreover there are several stars that have ultra slow rotation something must have broken them down because we believe that what stars are formed when they are greeting they are spinning up so we have to revisit our knowledge of stellar evolution in this aspect so what can be an explanation well I'm claiming that internal gravity waves is something we should take into account because so far this has not been included in this blue box that i showed in terms of input physics how does that work well star that have a convective inner core these convective motions they trigger gravity waves and these can then pass their angular momentum inside the star and this has been computed look at the movie here rotational frequency as a function of interior mass of the star and you can see that the rotation rate can change drastically as the star moves into its H pattern here you see in a thesis for a solo type star that's just to say that if you look at this type of theoretical predictions the rotation frequencies in the core versus envelope can take many different values if you consider this physical phenomenon this sorry yes but for a one solar mass star only and these are very old well ten years old and so now we have we are redoing these things we are trying to do that to see if this can be an explanation of why some massive stars behave as we didn't expect them to behave in terms of their rotation and so Tami Rogers is sort of leading that research here in the US by doing also 3d numerical simulations and then we hope to export that to a 1d description that we can then log in to our stellar evolution months so it's it's not yet realistic to do 3d stellar evolution for the time being now let's even go to higher masses the first time we saw period spacings in massive stars with only five years ago this we did from the coral space mission so what you see here is the period spacing as a function of period now because we're in a different mode regime and you see the measurements of one star where we have eight period spacings detected in a coral light curve of five months and that gives us a handle on aging of massive stars which is of importance for chemical evolution computations yeah this is the Kepler analogy that in fact came up last week when we were at the conference and this is another beast are where you can see here all the periods plotted so this you see these that dotted lines they give the real period spacing and that is really connected to two things the internal rotation of the star and the mixing properties inside the star and so here you see a pattern the observed pattern of all the period spacings and it's going down right for this star it was not going down why is that well this star is an ultra slow rotator almost standing still it's later this one is a moderate rotator and so then these period spacings get tilted that's again the computation of this rotational effect and this is a first model that we certainly have to refine but that more or less gives you an explanation of what is going on in this time so these are measurements that could only be done after four years of capital monitoring and so here we take full advantage of the very stable light curves that we got from that know me know mission so if you look at that star you see the period spacings you don't only see that in this case but here you see your rotation of splitting you see this is a triplet nice triplets here triplet triplet triplet so if you analyze that in detail then you get a handle on the interior rotation with a much higher precision because you don't only see the pattern of the periods basics you also see the exact spitting so here is another star that ultra slow in its rotation it's Abby stars which should be a rapid rotator it's not and we can model the period spacing and find out an inverted rotation profile this is the first one we ever obtained of a massive star and it's not a nice cleaned colored diagram as for the Sun but this for a massive star and what you see and we cannot avoid this is counter rotation in the envelope of this star this is not at all what theory says that we should have found not at all and so this is a something where the community is still trying to digest I should admit that not everybody is happy with its stellar evolution people are not happy with this but that's what the star is doing the mass of this star is three and a half solar masses more less it's only missing it's very young yeah so it should have rapid rotation if our star formation theory is correct and it should not be counter rotating in its interior on the other hand geophysicist they don't see any problem at all with this because gravity to inertial waves in the earth that's common right so we we will be following up on this and we are trying to hunt for more stars now to see if this is common or not it requires four years of data and you have to imagine that the Kepler satellite was of course built to for exoplanets 150 stars measured for years long nobody wanted bloody be stars because there are no sense it's really annoying if you want to find planets to have such high mass pride shining stars there are no planets there so this was avoided to the best of the abilities yeah so how do we find these stars from artificial intelligence goes that we let loose on this massive data set and that then tells us oh there are patterns in the light curves that resemble the ones of be stars that we have studied from the ground and so in this way we did guest observer proposals for Kepler and we have about 10 be stars 10 out of 150,000 and this one was number one we're now I'm doing number two and number three because it's really manual analysis with a lot of work power involved yeah but that's the way how we could make profit of the Kepler mission even though these targets were not at all 14 yes well we cannot we only have if you if I put back up the slide we only have 19 triplets detected in this stock so instead of hundreds and hundreds for the Sun we have to invert the rotation profile from 19 data points well we resolve this by choosing a resolution in the rotation profile I'm not sure I'm understanding your question yes here well we we can't make the difference frankly this is a very first estimate so we made this profile for let's say two shells and then for three and then four four and we can do that for up to about 10 and in in in every case the conclusion is the same there's counter rotation yes yes exactly a hint is a good word and I cannot provide a smooth profile because I have too few data points in this case yeah well yes so they are large admittedly but the point is that we cross a line here and there are inversion issues here certainly mathematical issues but we can't avoid crossing that line that's the point well we can't the core is indicated by this green dash line right and exactly it's standing still more or less not what we had expected here's another case that came up last week this is an f-type star it's not the Beast are so this is typically near to solar masses where we see period spacing going down and for the same star so period spacing going up these are retrograde modes these are the ones that have a wave pattern opposite to rotation these are pro-grade modes these are ways that go along with rotation and so these two go together in this diagram and from this we will be able to deduce some information on the rotation frequency again and this is explained here in this theoretical study that was done some time ago without any application where you see dipole modes and so this is for a non rotating star this rotates twenty percent critical forty percent critical and that's how you expect to see the periods change in the period spacing diagram and this is when you add mixing additional chemical mixing that's not included in our blue box for the moment because we don't know how to do it but then you see that this gets smoothed it out so from this measurement without having done modeling because this is a very fresh result I can already predict that we will need additional chemical mixing inside the model because this is too smooth if you look at these period spacings quite often than you know that you have to take that into account let me move on this covers the whole range in masses where we can do seismology these days these these two are coral stars and the others are Kepler stars this star has 24 solar masses that's an o-type star among the more massive stars in the universe and so it's big huh young and we move all the way up to the power spectrum to two solar masses there which I stood still call it intermediate math and this is a measurement of this overshoot parameter remember I told you that for a convective core you really want to know the mass in the nuclear reactor yeah current standard models let's say we'd put it at zero so no extra few now during the core hydrogen burning and these are the measurements connected according to the error bars admittedly they are still large for some stars but for the 13 stars where we have done this seismic measurement now we come to the conclusion that there is more mass in the core and what standard models have huh and to give you an idea the dashed connected circles there are eclipsing binaries so from eclipsing binaries and isochrone fitting you can also get the overshoot parameter that's a totally independent different way and these two types of works point to the same direction and so massive stars live a bit longer on general than anticipated well up to twenty percent long so that's something to take into account in nuclear fusion nuclear synthesis models we're trying real hard working on it yeah we're doing that and we have a few Kepler stars but the point is why is why we are so slow we need to monitor the orbit spectroscopically and then we and this is ongoing yeah come so asteroseismology can feed into galactic archaeology here is a plot of what the coro and Kepler space mission delivered in terms of red giant so the coro mission was pointing at different fields but only for five months which is short for this type of work this is the Kepler point of view and then you can use the scaling relations that are connected with the Sun and the frequency spacings yeah so these scaling relations are here you measure the spacing as I've shown and you measure the position of the maximum not the hide itself because as I said we can't really exploit that but the position of the maximum power and the spacing is connected to the mass and the radius of the star and it's effective temperature temperatures are fairly easy to measure from spectroscopy so this is what we are doing we measure that from spectroscopic analysis and then this measurement and this measurement two numbers deliver you masses and radii and we are typically at two percent precision in the radii five percent in the masses and ten percent in the ages so that's what we can deliver now and that's what the conference last week was all about in in Santa Barbara so that we can get give this to galactic studies and that's a big asset ok you can deduce from that if we provide a mass a radius and we have a spectroscopic effective temperature then you have the luminosity right then you have the distance so we are at a point that we give ten percent says distance estimate and we cannot wait to get Gaia because that will be a totally independent and then we can calibrate exoplanets that's a hot topic and so we go hand in hand so to speak this is a coral star where we have oscillations just like for the son of an exoplanet host star and from deducing this beautiful power spectrum and frequency separation will do aging of the star and then we have the age of the planetary system so that's a big asset as well so here we are feeding into the exoplanet community and for the Kepler mission you see here about 500 dwarf stars not too different from the Sun where says McKay ages have been determined now we move to k2 to come to the end k2 is wonderful in one aspect and is a downgrade in another aspect is to refurbished Kepler mission it can do very many different positions along the ecliptic that's fantastic because we can point that clusters we can point and well not anywhere you want but still but we can only measure the stars for three months and as I have shown the rotational results from seismology require longer soak a tool will not be able to deliver us internal rotations of stars in general but it can give us ages masses and radii of very different stars including metal-poor stars that we have not been able to measure for the moment so this is ongoing and we keep writing Kepler k2 proposals as we speak pre main sequence stars have also found their way into asteroseismology this is from a very recent paper in science where the frequencies of stars as they contract to the main sequence to their birth has been coupled to a seismic quantity that we have measured and from this you can do also aging and that is of course and very interesting if you could do that for stars where planets are forming so that is also something we want to explore it k 2 mission unfortunately there are not so many places where the satellite can point where we have known pre-made sequence stars but we have several of the proposed so as I said we are waiting for Gaia because then Gaia delivers us a radius or a distance essentially yeah but with an effective temperature that translates into radius and we lose one dimension in our space of variables let's say and then we will get a handle on the input physics much better we can do the same if we have a good interferometric radius and so this is another aspect that we are trying to work on but it's very difficult and technical to get radius up to a high enough precision to help but it's in principle possible and then very far away we in Europe we are working on the Plato project it has just been selected Plato is a mission to stare at two fields during a long time here are the two preliminary fields we will June that this is the Kepler field just to give you an idea and these are the coral fields and so Plato was there for two years in one direction for three years in another direction and then it has Stepan's their face and the aim is really to go for to hunt for exoplanets of low mass in long orbit so to have copies of the earth of just like Kepler we will find an immense amount of Astrophysical information that is not the main aim of the mission but this part of the complementary science and you are very welcome to register it's it's free it's European paid mission but the complementary signs that I'm leading is this is not connected to dollars or Euros okay so to come back to my statements is after seismology the revolution instead of physics well we moved from parts per thousand two parts per million precision just by space missions we had a few bright solar like stars now we have thousands of stars across the HR diagram and we can do physics of stellar course now even though we still have to refine it so I think we have come a long way it is true that this is a topic that is perhaps European let if I may say so and I'm very happy that since two or three years I'm receiving American piz and undergraduate students even because we have a very specific semester like program at our university dedicated to this and so again last week I got the question can't you receive students there are unbell j'en right and so there are specific funds like the belgian american educational fund so if you have students or if you want to get educated yourself you are very welcome in leuven university thank you
Up Next
54:56
Mixed Modes in Red Giants: Probing Stellar Interiors
@IvS_KULeuven
133 views•2024-11-07
61:17
First Billion Years of the Universe with the Square Kilometre Array
@iaaudc
121 views•2022-05-26

92:35
Astrophysics of Accretion Disks – Charles Gammie Lecture
@videosfromIAS
14.2K views•2016-07-25

6:10
Gamma-Ray Bursts: Cosmic Snipers Explained | Astronomy
@kurzgesagt
15M views•2016-07-31
Related Study Plans & Knowledge Roadmaps
Structured learning paths in Astronomy
astronomy
Reionization: Pop III Stars, IGM & 21cm Line
01Foundations of Cosmology & the Early Universe
02Population III Stars & Cosmic Dawn
03Physical Mechanisms of Reionization
+ 2 more learning modules
17h5 modules
Explore Roadmap
astronomy
Planetary Rings: Dynamics, Roche & Resonances
01Foundations of Gravity and Orbital Mechanics
02Tidal Forces and the Roche Limit
03Structure, Composition, and Collisions
+ 2 more learning modules
10h5 modules
Explore Roadmap
astronomy
Asteroseismology: Stellar Waves, Ages & Cores
01Foundations of Stellar Astrophysics & Wave Mechanics
02Stellar Oscillation Modes: P-modes and G-modes
03Mathematical Framework of Asteroseismology
+ 2 more learning modules
35h5 modules
Explore Roadmap
astronomy
Adaptive Optics: Physics, Engineering & Control
01Foundations of Wave Optics and Wavefronts
02Atmospheric Turbulence & Optical Distortion
03Wavefront Sensing Technologies
+ 3 more learning modules
35h6 modules
Explore Roadmap