



















Fourier optics provides a computational framework for predicting light diffraction patterns by treating light propagation as a series of Fourier transforms; when light passes through a slit, the intensity distribution at a screen can be calculated by taking the Fourier transform of the initial light distribution at the slit plane, multiplying by a propagation factor involving the wavelength and distance, and then performing an inverse Fourier transform, with the key insight being that diffraction becomes significant only when the slit width is comparable to the wavelength of light.
Fourier Optics in Python: Simulating Diffraction Patterns
Added:Mathematical foundations of the Fourier Transform, particularly the transition from 1D to 2D Fast Fourier Transforms (FFTs).
Wave optics fundamentals, specifically wave propagation, phase, and the Huygens-Fresnel principle.
The Fraunhofer approximation of diffraction and how it physically relates the aperture shape to the far-field pattern.
Basic Python programming proficiency, including numerical array manipulation with NumPy and visualization with Matplotlib.
Near-field (Fresnel) diffraction modeling using the Angular Spectrum Method (ASM) in Python.
Spatial filtering techniques and the simulation of 4f optical image processing systems.
Modeling optical aberrations using Zernike polynomials and simulating their impact on the Point Spread Function (PSF).
Introduction to phase retrieval algorithms (e.g., the Gerchberg-Saxton algorithm) and Computer-Generated Holography (CGH).
26.2K views1.1Klikes29:22Original Release: 2022-01-04
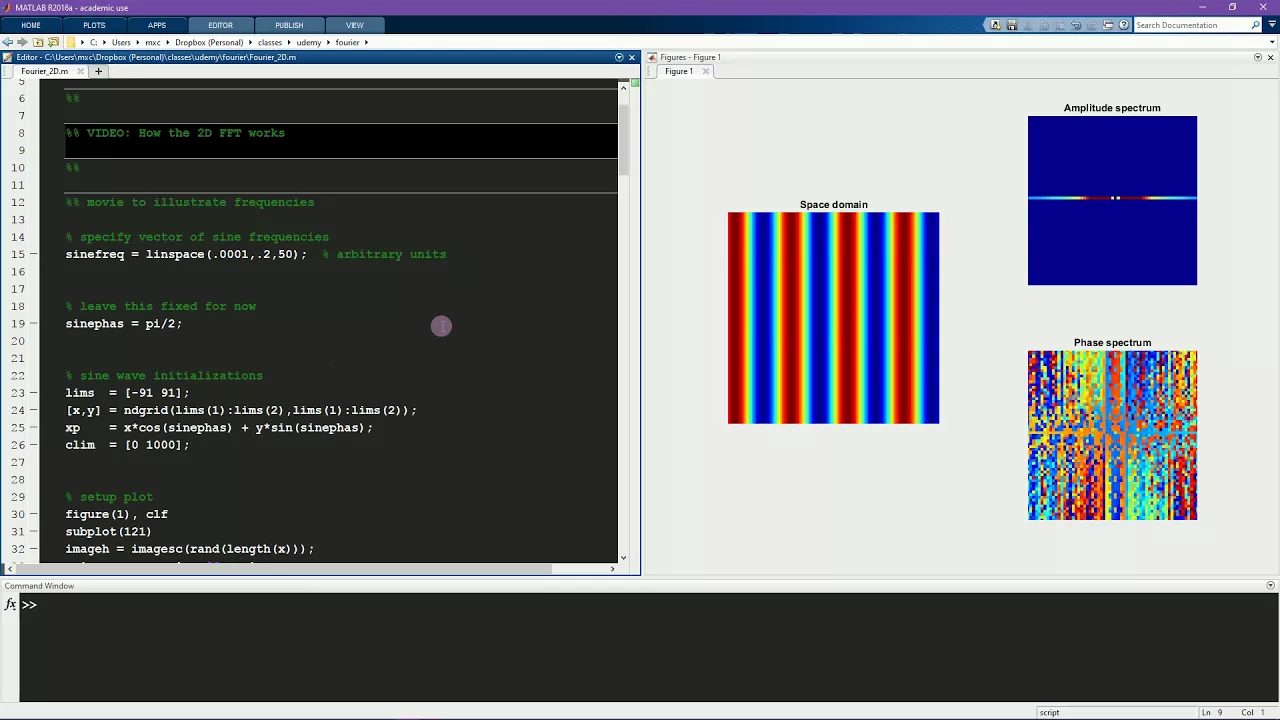
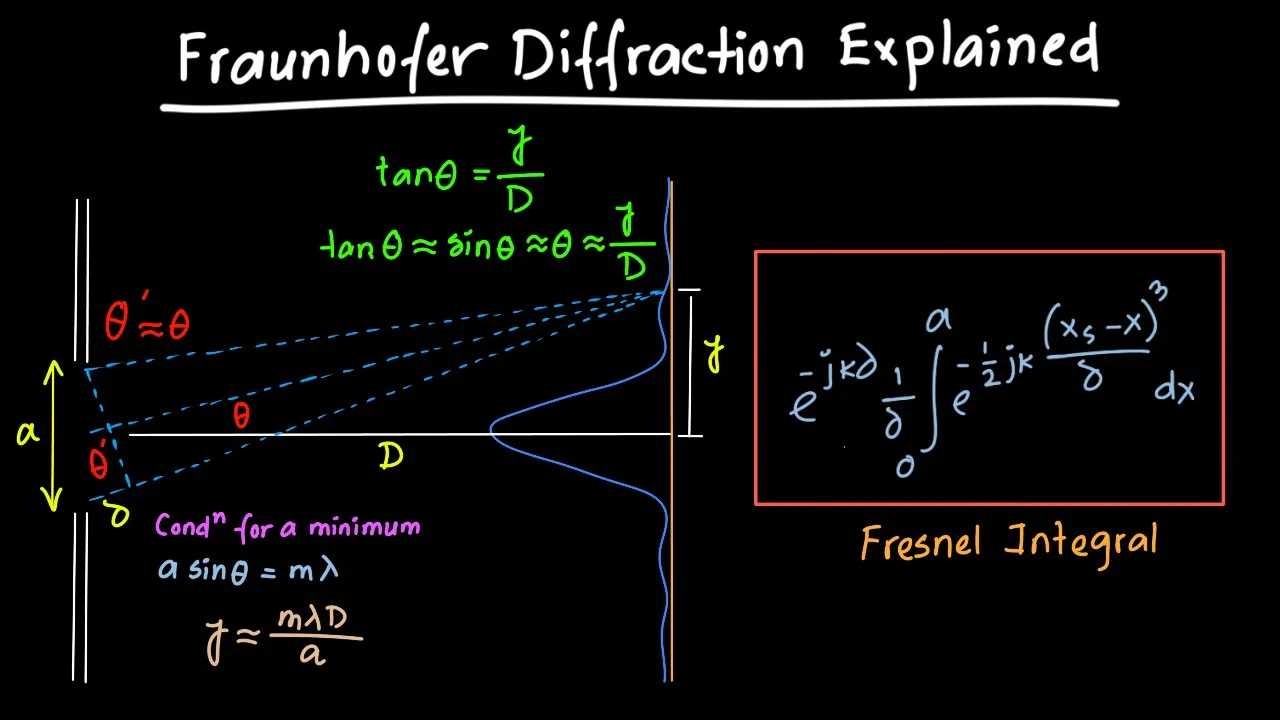
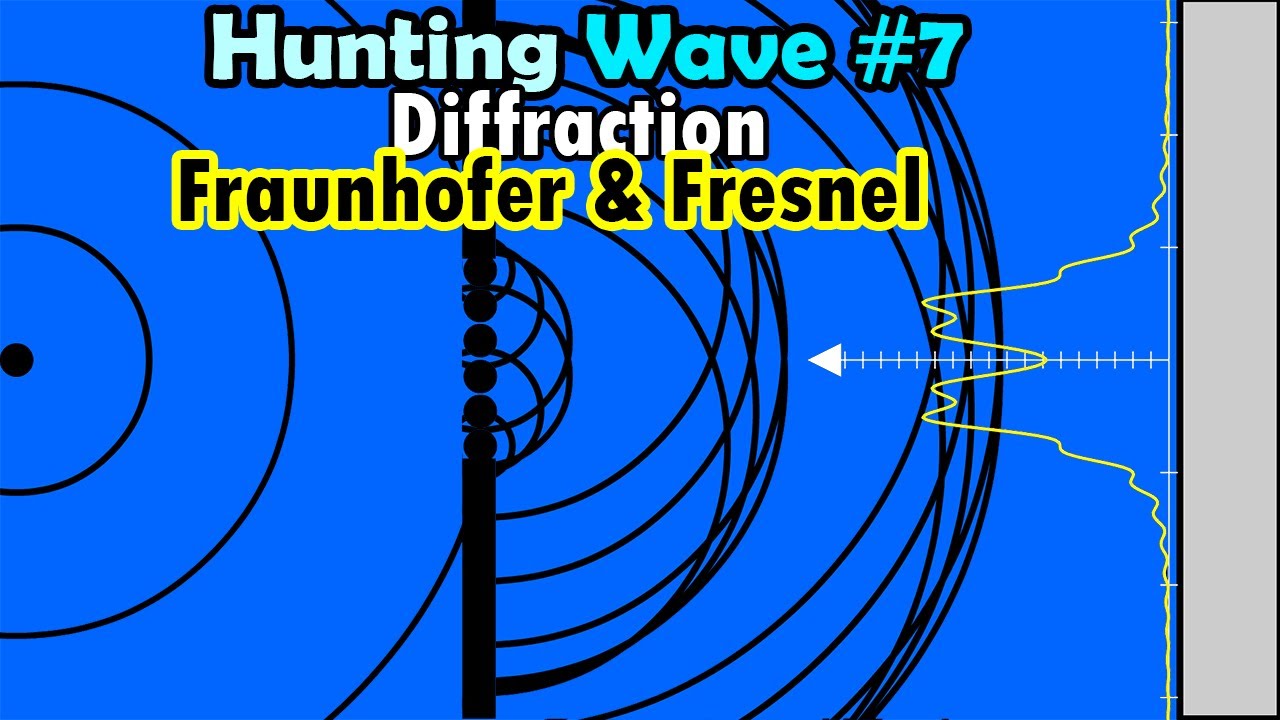
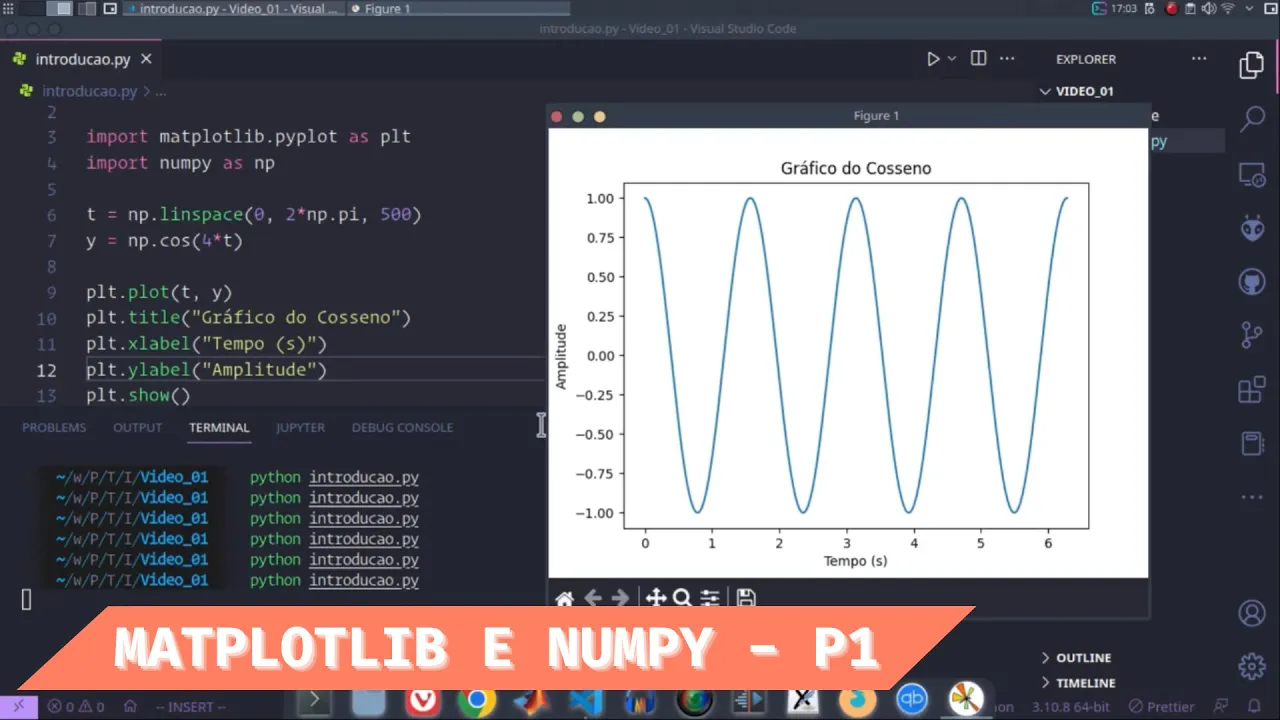
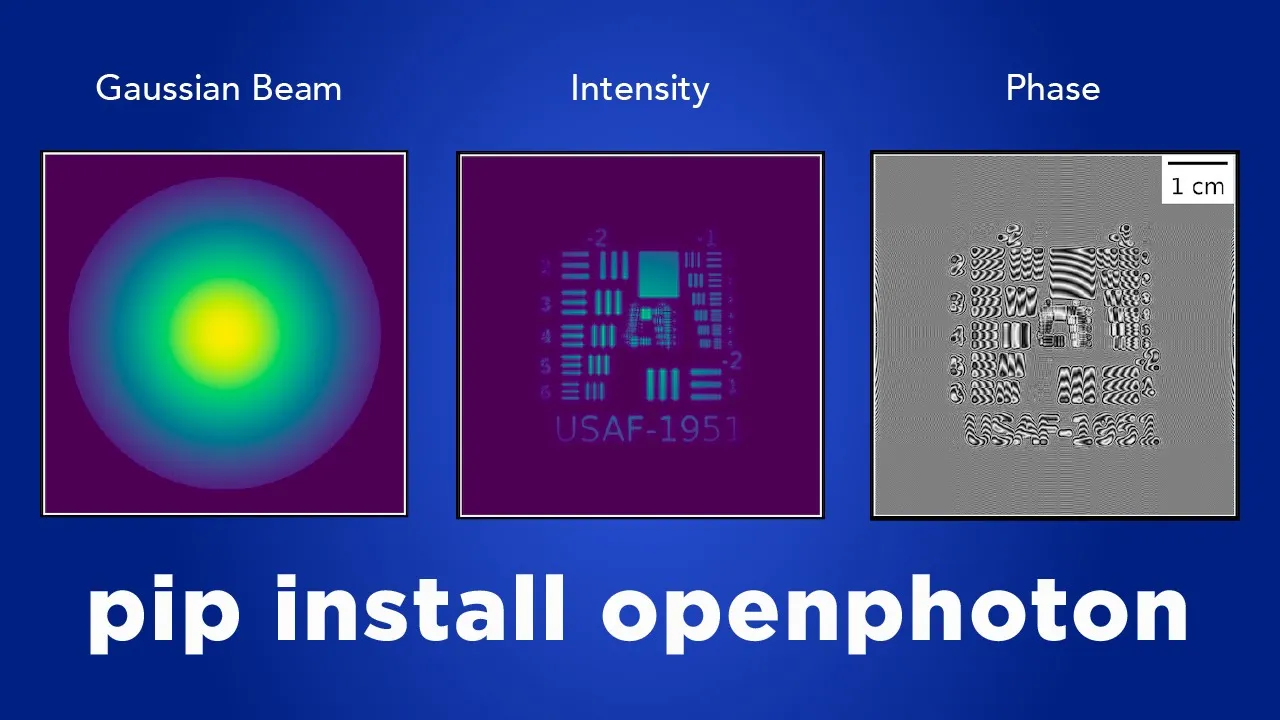
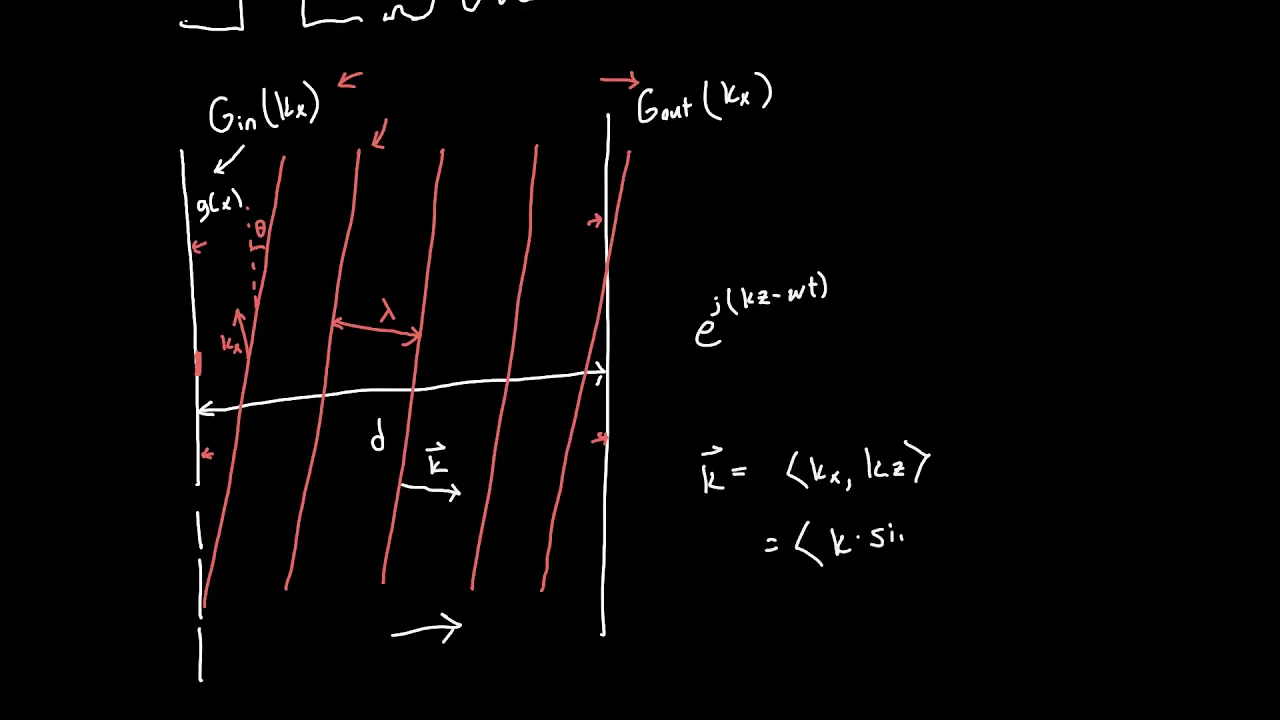
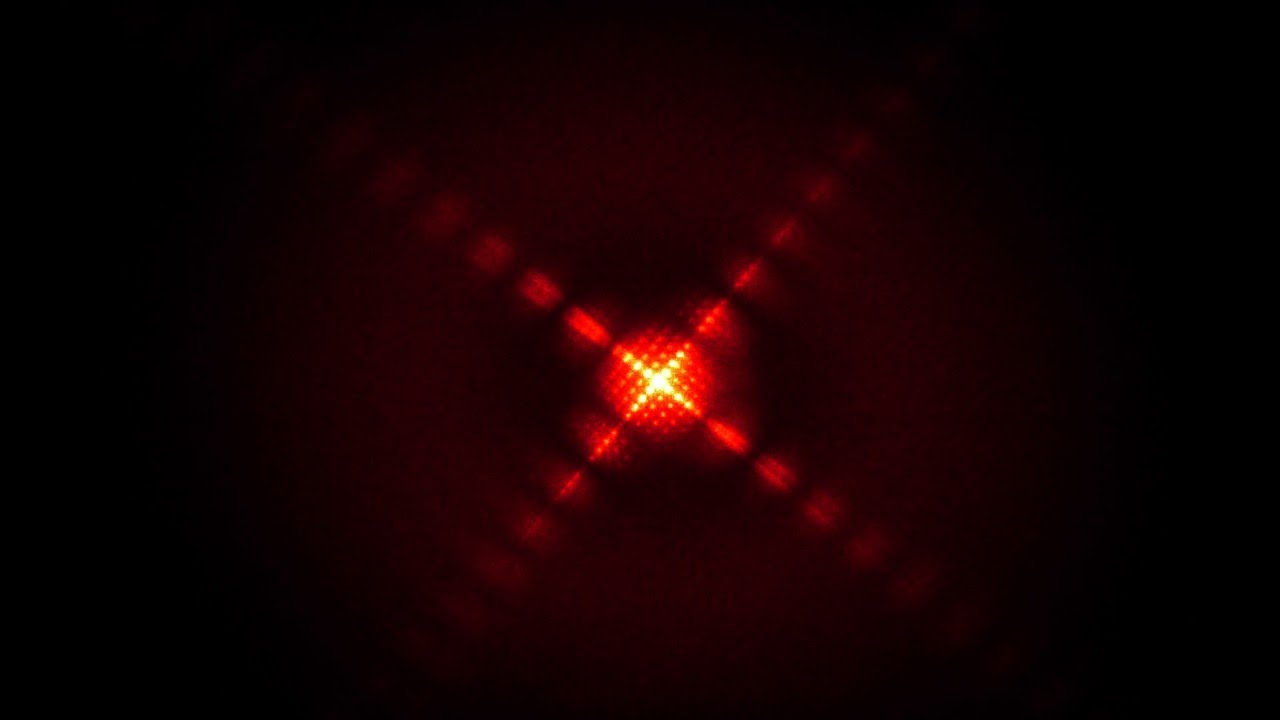
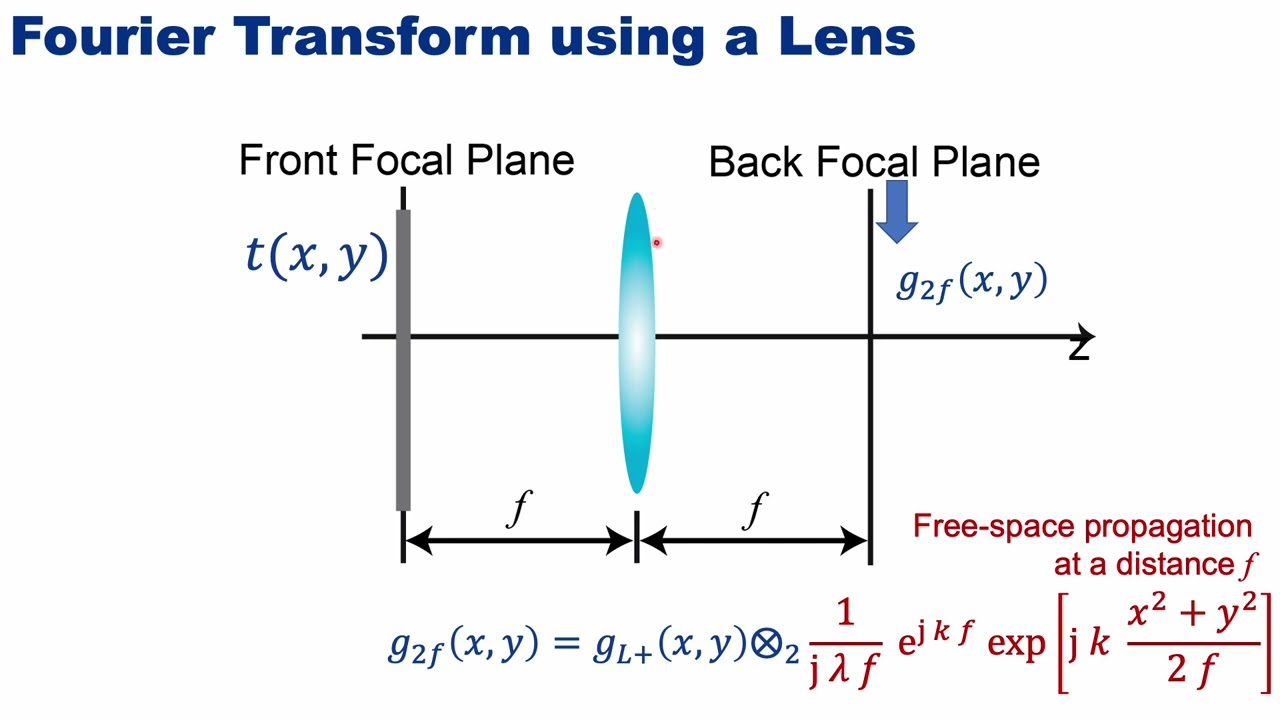
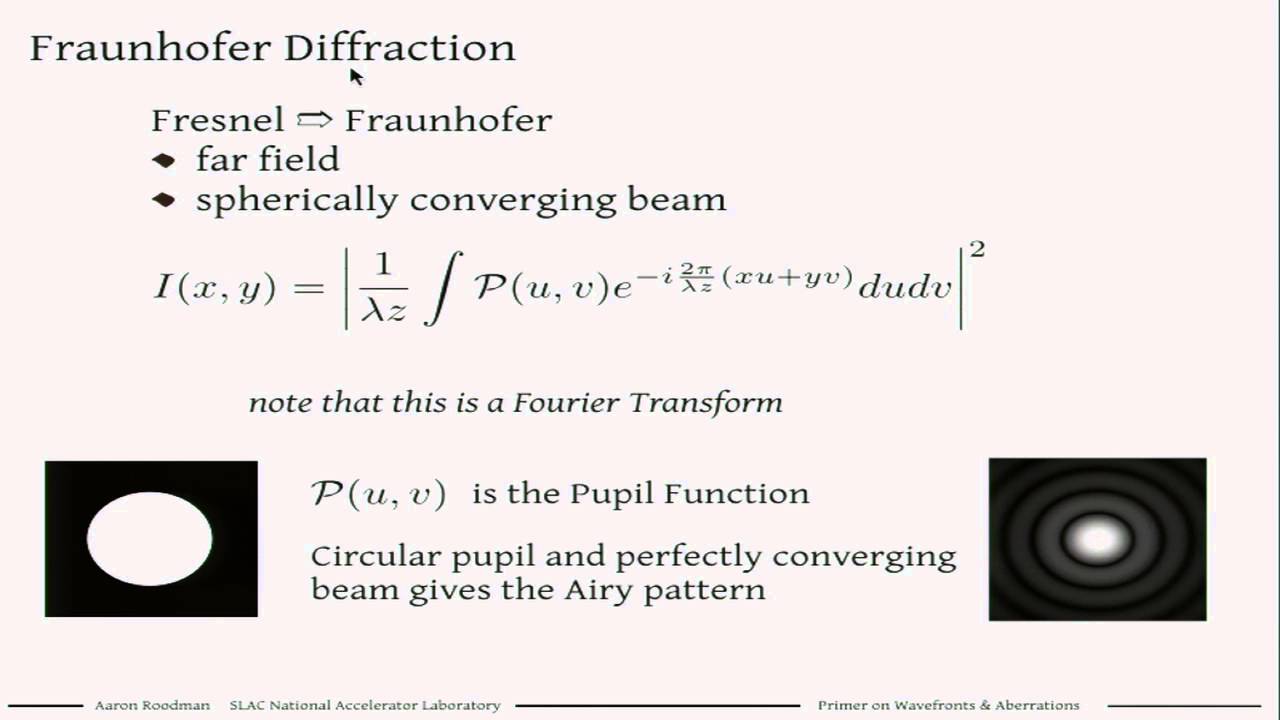
[Music] today we're looking at foyer optics in my opinion the only interesting part of optics the reason i say that is because it has huge computational potential and it asks really interesting questions for example suppose i'm shining a light and i put a screen in the middle of the light so it's hitting the screen so i know what the intensity looks like at that point fourier optics ask the question what does the intensity look like further down for example could go through lenses it could go through slits and the question is after all these instruments that the light goes through what does it look like at the end in this video i'm going to primarily deal with slits so the question is what is a slit well i know that a slit is a little cut out of something so i know that my light is zero everywhere but it's you know not zero at a particular place but the question is well for a diffraction pattern it needs to be a very particular type of slit for example if i just shine a flashlight through a hole and point it at a wall i'm not going to get a diffraction pattern i'm going to get just a little circle on the wall for a diffraction pattern to actually occur the slit has to be on the same order of magnitude as the wavelength of the light and then you start to see diffraction patterns as the name suggests everything about the computation that we do is related to fourier transforms so if i know my initial intensity of light for example zero everywhere except one in the slit then i just do a bunch of fourier transforms and i can compute what it looks like you know as i move my screen farther away the light goes through the slit it starts doing weird things in space i put a screen here and i get a weird diffraction pattern we're getting fairly close to 10 000 subscribers so if you enjoy this content please subscribe and leave a like also i've heard that subscribing to my channel has boosted people's iq by about 20 points so keep that in mind as well might come in handy for solving that difficult uh lagrangian mechanics problem so besides the typical numpy and scipy that we use i have a number of libraries here for taking two dimensional fourier transforms and then also inverse fourier transform these are these two functions here and then something called fft freak and fft shift what this will do is when i have a fourier transform of a function and i know what it is in like the spatial domain it will get me the corresponding frequencies in the fourier domain as well and fft shift you'll see will come in handy i have cv2 to open some images and then some matplotlib stuff to make animations another package i'm going to use in this video that i've never used before in past videos it's called pint at least that's how i import it and the way it works is that you can deal with units using this package and so because i'm going to be dealing with like wavelengths that are nanometers sort of slits that are millimeters things that are meters rather than keeping track of all these things this package actually helps do that for us so we don't need to be doing as many mental games as we're going through um and i sort of start it like this so there's pint.unit registry so i'll show you this so import the packages and the way that the pine thing works is i have this thing called u and i have for example different units so millimeter and i can go like two times millimeter two millimeter i can also go like np dot array one two times millimeter and it will actually form an array like this one two with units of millimeter so when i have a raise of different quantities and it will do math automatically it makes this really helpful so before i get into the coding stuff it's useful to talk about the theory of fourier optics or scalar fourier optics so scalar fourier optics considers a scalar function u of x y z t that satisfies the wave equation that i have written here and u squared is the intensity of the light so the question is what is this because we know that a light is an electromagnetic field that consists of vectors an electric field vector and a magnetic field vector so in some cases u can be thought of as like the dominant component of the electric or magnetic field so e x for plane waves but in other cases it's a little bit more difficult to interpret and it's sort of beyond the scope of this video and the main thing that you have to realize is that there's a quantity a scalar quantity that satisfies the wave equation and its square is equal to the intensity of the light and this exists at all points in space and time so i can you know look at a given time what does the distribution of this scalar quantity look like in space and as i square it then i get the intensity of light at all points in space now we have the wave equation here for a light of a given frequency i'm going to call it omega equals 2 pi f where f is the frequency omega is the angular frequency sort of use the same word frequency here so it's mono-energetic so you're sending light of a given wavelength somewhere you look for solutions of the form u is equal to little u as a function of space here e to the minus i omega t so we plug this into the wave equation here and you get the helmholtz equation that looks like this so if you substitute this in here and you sort of take the derivative and stuff you'll get this equation and k is equal to omega over c or 2 pi over lambda so these are all the equations that maybe you're used to so k is related to the wavelength of the light and so this is the helmholtz equation and so we can find solutions to this equation by looking for separable solutions so i say that my function u that solves it is a function of x times a function of y times a function of z now the true solution for our particular problem won't be separable but you can find a bunch of different separable solutions add them together and then you get your true solution so several separable solutions are almost like the unit vectors if you're considering a vector space and then you add up all the unit vectors in a combination to get your given vector so i have my separable solutions i get infinitely many of them and then i can sort of sum them together to get any solution that i want so i look for the separable solutions the gradient looks like this i plug u s which is this functions here into it and i get this equation here and this is a trick that you might see if you've taken a partial differential equation course in the past it's argued that each one of these must be a constant because if this is a function of x and i move everything on this side here to the left then i have a function of x equals something that's not a function of x so it has to be a constant so each one of these fractions here is a constant that gives me three equations that look like this by the way i'm going through this really quick this is something that's typically covered in like months in a course so i have a equation in x y and z for f x f y and f z i can solve these equations right these are equations that you can solve and it's just complex exponentials that's like one type of solution to this equation so it tells me that u s which is a product of f x f y and f z each that are complex exponentials looks like this and i know that the sum of these k's these are the constants that each of these are equal to is equal to k squared so i can take one of these k's and i can sort of write it in terms of the other two so i take kz and i write it as k squared minus k squared minus ky squared so that's my separable solution and so there's any number complex number a satisfies that equation so to get the general solution this is what our separable solution looks like that depends on k x k y and k z or just k x k y and k and so there'll be a separate k x and k y for each of these separable solutions and to get the general solution you take a linear combination of all these separable solutions and because there's infinitely many of them we take this in linear combination as an integral so my integral looks like this i sum over all the different values of kx and ky of us the separable solutions and so a will be different for each one of these solutions each solution is given by its kx and ky value so i can say that a is a function of kx and ky right because i can uniquely specify what a is for the given separable solution that is a certain value of kx and ky so my a i can just write it as a function of k x and k y and then i plug in my separable solution that i found up here right and if you note that if you put in z equals zero this is sort of the big trick behind all of this if i put z equals zero here i find that this a which is unknown to us before you might be wondering what the heck is a well a is the fourier transform of u of x y zero so if i'm shining light at something and i like take a cross section in z and i know what the intensity of the light is there i can find what my a is and then i can use that to propagate and find what happens after that point as well so this implies that a of k xk y is the fourier transform of u at z equals zero that's just what this formula literally says in two dimensions that a is the fourier transform so using f here i write a is the fourier transform of u of x y at z equals zero and so i plug this back into or rather i look at the original expression here that looks like this for any value of z this isn't z equals zero this is any value of z and you'll note that this itself is an inverse fourier transform of a kxky times this quantity here so this whole thing this is an inverse fourier transform because i'm taking the integral and i'm multiplying it by this so in general u of x y z is the fourier inverse of a of k x k y times this quantity here and a of k y x k y is just the fourier transform of u so it provides a really elegant way to find what u of x y z is i take the fourier transform at u at x equals zero so i take a cross section of my light right at z equals zero so for example this might be light going through a slit and i know that the light is confined to that slit so my cross section is zero everywhere and at the slit and then as z goes the question is what happens to the light after that point and so i can find what a of k x k y is and if i want to find what it is at any value of z so as i move sort of through the slit and beyond that i just take the inverse fourier transform of a which i solved up here times this quantity here and i choose the minus sign by the way because you'll note that i have a plus or minus i z i choose the minus sign here because we're considering waves moving through the slit in the positive z direction as opposed to backward because you'll note that if i just know the intensity through the slit the question is is it coming through the slit or is it going you know which way is it going so taking the negative cyanide sort of decide that convention that the wave is moving through the slit and so yeah these two boxed equations you can find the intensity of light at any point provided you know it at a given cross section instead and so the important things to note here the things that are unknown is k is related to the wavelength of the light k is equal to 2 pi over lambda uh up here and uh u of x y z equals zero is given by the distribution of light says the light is going through a slit so that's like it could be a little box of light right the intensity is here and then it's blocked by the screen and the question is what happens to the light after and so you might see now why it's called fourier optics because it's all related to fourier transforms and inverse fourier transforms so we'll do a few experiments just to confirm that what we're doing is indeed correct and then we'll do some cooler animation stuff so we'll start with the single slit experiment so the capital d here is the slit distance d is 0.1 millimeters and the wavelength i'm going to say is 660 nanometers so again this package is new in my videos but you'll see that it defines it specifically and it's got the uh unit as well so that you'll see how this will make things easier so i'm going to define the spatial grid and then i'm going to define the actual slit as well so x this is sort of the unit dimension it's going to be two dimensions right so there'll be an x-axis and y-axis they're both given by this uh it goes from negative two to two millimeters in 1600 steps all in units of millimeters and then i make a mesh grid of x so that i have sort of that 2d thing that i can plot so now i define what my intensity of light or rather the square root of the intensity because this thing squared is the intensity i define what this looks like at z equals zero so i say where x is less than d over 2 and y is less than 0.5 so my width is d over is d but the absolute value is less than d over 2 means it goes from negative d over 2 to d over 2. and then y goes from negative 0.5 to 0.5 so it's a one millimeter height slit and then d width of the slit and i turn this into floats because this of course is going to be boolean right because this is a boolean operation and so this turns it into float and you'll see exactly what i mean if i go like this it returns an array of boolean quantities here false and then there'll be a little bit of trues in the center where x is less than d over 2. and the same thing for y here this gives me all the y values and it will be equal to sort of one millimeter it will be true in the center so now that i have u i can plot what it looks like and i'm using my mesh grid that i created and i'm using the value of u that i have as well and so it'll plot and you'll see that my slit just looks like this so i have zero everywhere and then the light is shining through the slit at z equals zero so this is exactly what i want i want it equal to um you know some quantity here i think it's just equal to one because this was boolean so it's equal to one here and zero everywhere else right so that's what my light looks like initially at z equals zero the question is as i go through the slit and the light sort of propagates through what happens to it and as you know from first year physics you get a diffraction pattern on the screen and that's related to these two equations here so there's two equations that i mentioned above and the first thing we need to do is get a of kxky given by this boxed equation up here and for that i need the fourier transform of u so i take the 2d fourier transform of u naught that's z equals zero and then i get my fourier frequencies as well so what i do here this is a little bit confusing but you'll note that f of t freak this gives me my fourier frequencies and x is my sort of points in y right and so if i just look at this these are my frequencies in units of one over millimeter and i specify the length of x because however long however many points there are in x there's going to be that many fourier frequencies and i also give the spacing in x right i know that my spacing is 0.0025015 millimeter and that's how you can compute what the fourier frequencies that the computer is computing if you're confused about this i would highly recommend checking out my 4a series video that i have on my channel as well so this will give me the fourier frequencies and i need them in two dimensions oh and i need them in angular frequency because that's what we're considering this this gives it in true frequency multiplying by 2 pi gives it to you an angular frequency and then afterwards i create a mesh grid so that i can do some plotting so now that we've computed a kx and ky i can plot the fourier transform which is what i do here and you'll note that i'm doing an fft shift here and this is because in python when you take the fourier transform of something instead of dealing with only positive frequencies it does positive and negative frequencies if you only want to deal with positive frequencies and this is said very simply it's a little more complicated than that but if you only want to deal with positive frequencies you have to make sure that you use fft shift to shift everything so you're not dealing with positive and negative you're dealing with positive and positive this has to do with like sampling theories and things like the nyquist frequency and the fact that the fourier transform is repeated over and over it's a little complicated but just always use the fft shift especially when you're doing 2d transforms because otherwise the 2d thing that you plot doesn't really make much sense so this is why i imported this function so now that we have the fourier transform of our thing we need to write the function that returns u of x y z and of course that's given by this equation here so we have a of k x k y now we need to take the fourier inverse of this multiplied by this and i have kx and ky is a mesh grid so this is a two dimensional thing and because kx and ky are mesh grids they're each two dimensional as well so that i can plug in all my numpy arrays in here and i get a 2d array that i then take the inverse 2d fourier transform of so that's exactly what i do here i have my inverse two day fourier transform i have a which is what i found by taking the fourier transform of u naught i multiply this by that exponential of k squared minus kx squared minus ky squared all square rooted and then i also have z as well so i plug in whatever value of z i want so however far away the screen is from the slit that i'm doing the diffraction experiment on and k which is related to the wavelength of the light so this is a function to get u at any value of z and i can specify the distance of the slit to the screen z which is equal to d little d that's typically the convention that's used in the single slit experiment and k which is just 2 pi over lambda that i defined before so i have k and d and i can use this to get u here and by the way these little errors here these have to do with the units package and it's because it's stripping the unit sometimes and it's it's just something that shows up so i plot what u looks like and i indeed have my diffraction pattern here you can see that there's the central thing and then these things sort of going off like this and i want to confirm that the results are actually precise like i'm getting the right thing because it looks right the question is are the minimum where they supposed to be so for the single stud experiment the minimum of intensity occurs at angles theta such that d sine theta is m lambda that's something learned in first year and sine theta is equal to x over x squared plus d squared so x is the if the screen's like this x is the distance on the screen and d is the distance from the slit to the screen so i can find what theta is using x and this is the hypotenuse sine theta is equal to opposite over hypotenuse and then i can solve for x and i get my values of x like this so it's m lambda d over d squared minus m squared lambda squared so i plug in a value of m and it gives me all my different values of x's where the minimum should be and i know what lambda is i know what d is the distance from slit to screen i know what capital d is and i just give a bunch of different integers for lam for m and then i get all my positions of my minimum so here i have m from 1 to 5 and i get my values of x and i can plot vertical lines at these minimums so by the way i'm taking the magnitude of x because of course this is going to be unit full if i look at x min for my package that i have these are in units of millimeters so if i take just the magnitude it will sort of strip the units from it so that's really useful when plotting sometimes using this package so i have the positions of the minimum and i just give these dotted red lines and i plot x and u and you can see that my diffraction pattern by the way i take this value in the center so i'm just taking a central slice here of the diffraction pattern and you can see that my diffraction pattern looks like this what you would expect to see in the single slit experiment by the way if i want the actual intensity i would need to square this i sort of choose not to do this because you get rid of the bumps a little bit if i take the square root you can sort of see it a little more exaggerated and you can see that these dotted lines do indeed lie at the minimum so whatever we're doing here with fourier optics gives results that we expect and so for the future experiments i'm just going to write a function that does everything automatically it takes in your initial sl or initial intensity of light or the slit or whatever xp and yv which are the position it takes in the wavelength and it takes in the value of z sort of the distance from the screen to the slit and it just does everything that we've done automatically here so the next interesting experiment is the double slit experiment and this is a one of the most famous experiments ever in physics especially because of the quantum phenomenon that occurs in this experiment but this isn't what we're considering here we're just considering classical light mechanics here so here i define the distance between the slits little s so that's 0.2 millimeters the slit width capital d is 0.05 millimeters and i'm going to use that to get the initial field so i define my spatial mesh grid like i did before here it goes from negative four to four millimeters um 3200 different points i create my mesh grid and then what i do to get my twos i want two slits right next to each other and so i say where x minus s over two is less than d over two y v is less than two millimeters x plus s over two is less than d over two and y is less than two millimeters and so this gives me one slit and this gives me the other slit right so this gives me something that's centered at negative s over two and it's sort of a width d and then y is two millimeters and so i multiply these together so this is and you need this and this to be true i need this and this to be true for the other slit and then i take an or a plus is equal to an or when you're dealing with boolean stuff right remember that each of these is a boolean array so if i take y is less than two millimeters i get this boolean array that looks like that and so this is what my initial um i'm dealing with a boolean array for each four of these things and these are boolean operators then i convert it to float so each the value is one everywhere and i can show what the initial field looks like and i get something that looks like this i have my two thin slits right next to each other the question is what does the resulting field look like and so i use my compute function that i wrote before and i can plot what the diffraction pattern looks like and lo and behold you get the double slit pattern that you expect you get this sort of big bright intense pattern in the center and these lighter sort of things going off and then also within each sort of bright packet of light you get these um oscillating pattern as well so that's the classical double slit sort of thing that you expect so a little more obvious we can look at like a central slice to actually look at the magnitude of things so i'll take the central line sort of cutting right through here and i can plot what the field looks like and of course this is the double slit intensity so i have my main sort of lobe i forget what they call them in first year it's some sort of lobe or whatever and then you also have the little oscillating within each lobe and you can see a lobe here a lobe here a lobe here it's not like infinitely precise but it's doing sort of the right thing so you can see with fourier optics you have to be very careful with how you define things in order to get a result that looks decent because a lot of times if you create the dimensions wrong or whatever there's a lack of precision that occurs when you're dealing with these numerical fourier transforms so this is a particular case where it works well but it doesn't mean that it always gives the correct result so we can also do this for a circle here i'm just saying my radius of the circle is 0.1 millimeters i create my initial pattern like this and compute the value of u the question is if i have a little circle of light and i put a screen back what does the pattern of light look like far from the slit so i have a slit here the light shines through the slit and then i have a screen here it's a little circle that the light goes through what does the light look like when it hits the screen well you get the center portion here and then you get these sort of radial outward lobes i don't know if you can see that hopefully the video quality is good enough but it sort of oscillates like this so it's a weird thing it's a diffraction pattern as you shine light through because it interacts like a wave you get these sort of wave like things that appear on a screen so finally we can do an experiment with different wavelengths of light and we can ask what happens as i shine different wavelengths through a slit and so i'm going to shine it through a hexagon slit here and so i do a little bit of stuff here to interpolate the image and make it the correct size i want it sixteen hundred by sixteen hundred uh these three functions do this and then i get my initial intensity of light like this so for example if i just run these cells and i look what u naught looks like it's just a hexagon like this where it's one here and it's zero everything else and the diffraction pattern for this hexagon slit is really cool by the way so i can get rid of this and i run this cell i get my value of u naught i have four different wavelengths here of 400 500 600 700 nanometers these are all on the visible spectrum um and i create my spatial grid like i did before and i'm going to compute u for all these different wavelengths so i have four different wavelengths i have my slit the distance between the slit and the screen is six centimeters in all these cases here and then the question is what does the pattern look like on the screen for different wavelengths now i want to actually plot the right color here so i found this function online it's called wavelength to rbgb of course color on a computer is rgb that's like an array of three different values that gives a red value green value and a blue value and i don't know exactly how this works and again it's sort of beyond the scope of this video but what it does is it takes in a wavelength it's a function that takes in a wavelength it's got this adjustable parameter gamma here and it will return the value of r g and b for each wavelength and there's got a number of cases here for different wavelengths but i give you a value of a wavelength and it returns rgb that gives a color on the computer and so i can use this function then to create color maps for each one of those wavelengths that i have so i have four color maps here um i'm probably shouldn't call this custom red i could just call it custom for each one and uh it goes from zero zero zero so black up to the color rgb for that given wavelength so it takes my wavelength to rgb and i'm giving it the value of lambda and that's 256 values in this color map and i'm doing it for all four color maps here so this list that i'm defining here it's list comprehension i have for four different values of lambda and so i can index c maps to get my color map for each of the four wavelengths so i've solved for all my different values of u nu i have my color maps and i can plot what each of these looks like and now here's the interesting thing that you might notice for the smaller wavelength when the wavelength is small compared to the slit you get no diffraction as the wavelength becomes much much much much smaller than the slit you don't get any diffraction happening it's like shining a flashlight through a just you know a hole right you're not going to get a diffraction pattern on the screen the reason for that is because the wavelength the slit is much bigger than the wavelength so for 400 nanometers small wavelength you get some diffraction but not as much as 500 600 and 700 the larger the wavelength compared to the slit the more diffraction that you get this is how sort of light and waves work when they're passing through you know like a slit or something like that and it's really cool what it sort of looks like here and so i have some function here that can turn this into an animation and so it's really cool because you can make an animation of what happens is the screen becomes farther and farther away from the light and you can see it sort of diffracting as it gets farther and farther away of course initially it looks like just the slit and then it starts diffracting more and more as you get away so i'll show you that animation now so here you can see it starts as a hexagon and as it starts diffracting more and more you get this diffraction pattern coming out from the sides it starts doing a really cool sort of diffraction pattern in the center and of course as the time goes in this animation it's as if you're moving the screen further and further away from the slit so it starts normal it starts looking like it does in the slit and then as it gets farther and farther away you get this diffraction pattern that's occurring anyways i hope you enjoyed this video if you want to see more stuff in fourier optics please comment and let me know because there's a lot of cool paths that i could potentially take on this channel looking at various problems in fourier optics for example here we only did monochromatic light there's also the case well what happens if you shine a white light through a slit well then the different wavelengths diffract differently and you get really cool looking diffraction patterns that way so that's a possible option for a future video anyways i'll see you next time
Up Next
94:25
Non-Thermal Messengers from the Universe: Lecture I | Cosmic Rays
@GalileoGalileiInstituteGGI
188 views•2022-03-22

12:53
21cm Hyperfine Transition in Neutral Hydrogen: Radio Astronomy Basics
@AaronRobertParsons
12.4K views•2011-10-13

32:32
NMR Spin Physics I: Zeeman Effect, Resonance Condition & Larmor Frequency
@nptel-indianinstituteofsci8064
2.3K views•2024-01-17

27:14
Entropy and the Second Law of Thermodynamics Explained
@veritasium
27.5M views•2023-07-01
Related Study Plans & Knowledge Roadmaps
Structured learning paths in Physics
physics
Nuclear Physics (Decay, Fission & Reactors)
01Atomic Structure and the Binding Force
02Radioactive Decay and Half-Life
03Nuclear Fission Mechanics and Chain Reactions
+ 2 more learning modules
12h5 modules
Explore Roadmap
physics
Soft Matter (Polymers, Colloids & Rheology)
01Foundations of Soft Matter & Thermal Forces
02Polymer Physics and Macromolecules
03Colloids, Surfactants, and Self-Assembly
+ 2 more learning modules
38h5 modules
Explore Roadmap
physics
Analytical Mechanics: Lagrangian & Hamiltonian
01Mathematical Foundations: Calculus of Variations
02From Newtonian Mechanics to Constraint Dynamics
03The Principle of Least Action & Lagrangian Mechanics
+ 3 more learning modules
28h6 modules
Explore Roadmap
physics
General Relativity (Spacetime & Cosmology)
01Foundations of Relativity: Special Relativity
02The Geometry of Spacetime: Equivalence Principle & Curvature
03Einstein's Field Equations: The Mathematics of Gravity
+ 2 more learning modules
55h5 modules
Explore Roadmap