This video demonstrates a multi-sensor water quality monitoring system using Arduino Uno R3 that simultaneously measures and displays five key water parameters: pH (acidity/alkalinity), turbidity (water clarity), temperature, water level, and light intensity (using LDR). The system uses a 5V power supply, connects sensors to appropriate Arduino pins (analog for turbidity/LDR, digital for others), and displays all readings on a 16x2 LCD screen. The project showcases how different types of sensors can be integrated into a single microcontroller-based system for comprehensive environmental monitoring applications.
Arduino-Based Water Quality Monitoring with pH, Turbidity, Temperature, LDR, and Water Level Sensors
Added:Deep Dive
Basic C/C++ programming concepts for Arduino, including understanding the IDE, sketch structure (setup/loop), and managing external libraries.

Curso - Lenguaje de Programación Arduino - 01
80.7K
This tutorial introduces Arduino programming basics. The Arduino IDE is a multi-platform development environment available for Windows, Mac, and Linux. A 'sketch' is the source code file containing all program instructions for the Arduino board. Arduino sketches are structured around two essential functions: Setup() and Loop(). The Setup() function runs once at startup to initialize variables, configure pins as inputs or outputs, and include necessary libraries. The Loop() function runs continuously in an infinite loop, executing the main program logic throughout the board's operation. This two-function structure forms the foundation of all Arduino programs.
Click to watch →
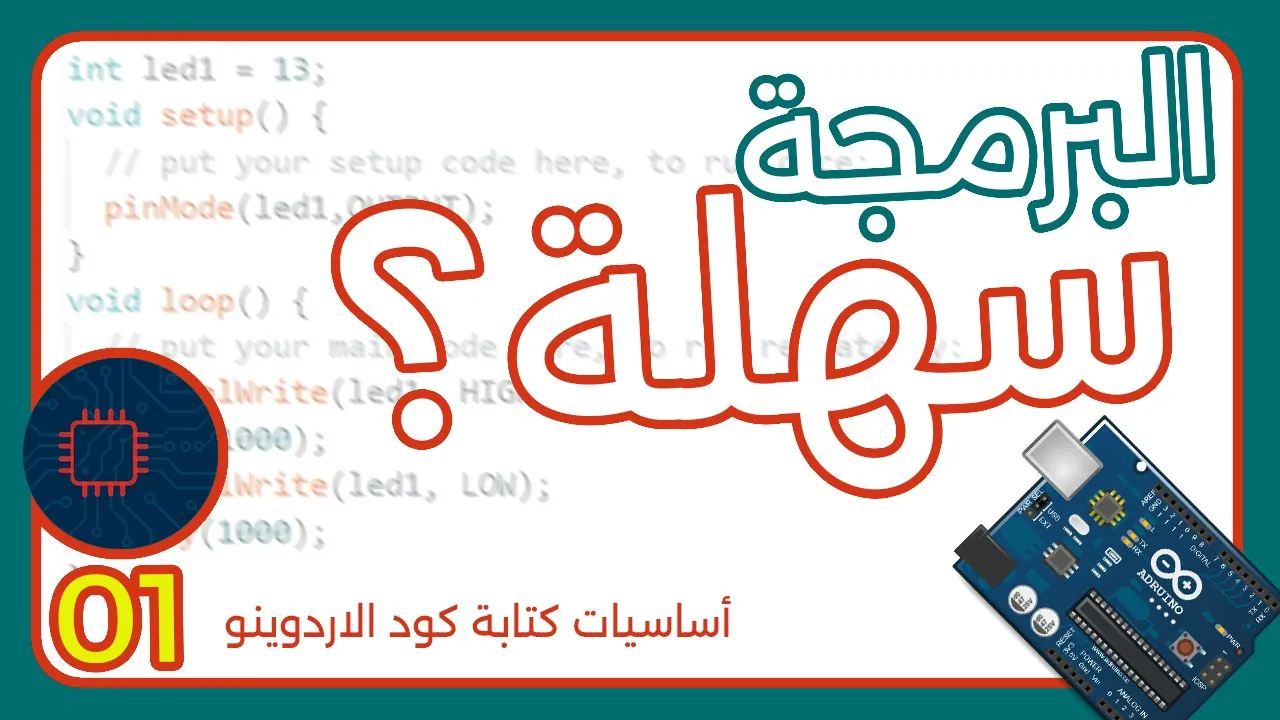
تعلم برمجة الاردوينو | أساسيات كتابة كود الاردوينو
7.6K
The Arduino IDE integrates three essential components: Code Editor for writing code, Compiler for converting C/C++ code to machine code (binary 1s and 0s), and Uploader for transferring code to the microcontroller. A new Arduino sketch is divided into three sections: the top section before setup() for defining variables and constants, the setup() function for initialization code, and the loop() function for continuous execution. Variables and constants are declared in the top section, with constants being global and usable anywhere in the code. Constants are defined by specifying type (like int for whole numbers), assigning a name, and setting a fixed value, with semicolons required at line ends.
Click to watch →

Get Started in Electronics #1 - Elegoo Arduino Uno Super Starter Kit
371.9K
This section covers the complete software setup process for Arduino development, including downloading and installing the Arduino IDE, understanding the role of libraries in simplifying component communication, and introducing fundamental programming concepts such as variables (labeled storage containers for data), pinMode for configuring pin modes, and digitalWrite for sending digital signals to control connected components.
Click to watch →

3. The Arduino IDE
42.9K
The Arduino IDE is based on the Wiring platform, similar to C/C++. Unlike standard C which requires main(), Arduino requires setup() and loop() functions. Setup runs once at startup for initialization; loop runs repeatedly for main logic. Both are void functions. The Arduino Language Reference (arduino.cc/reference) provides comprehensive documentation including function details, parameter types, and examples. A recommended free resource is the Seed Primer book (~800 pages) covering C programming fundamentals essential for Arduino development.
Click to watch →
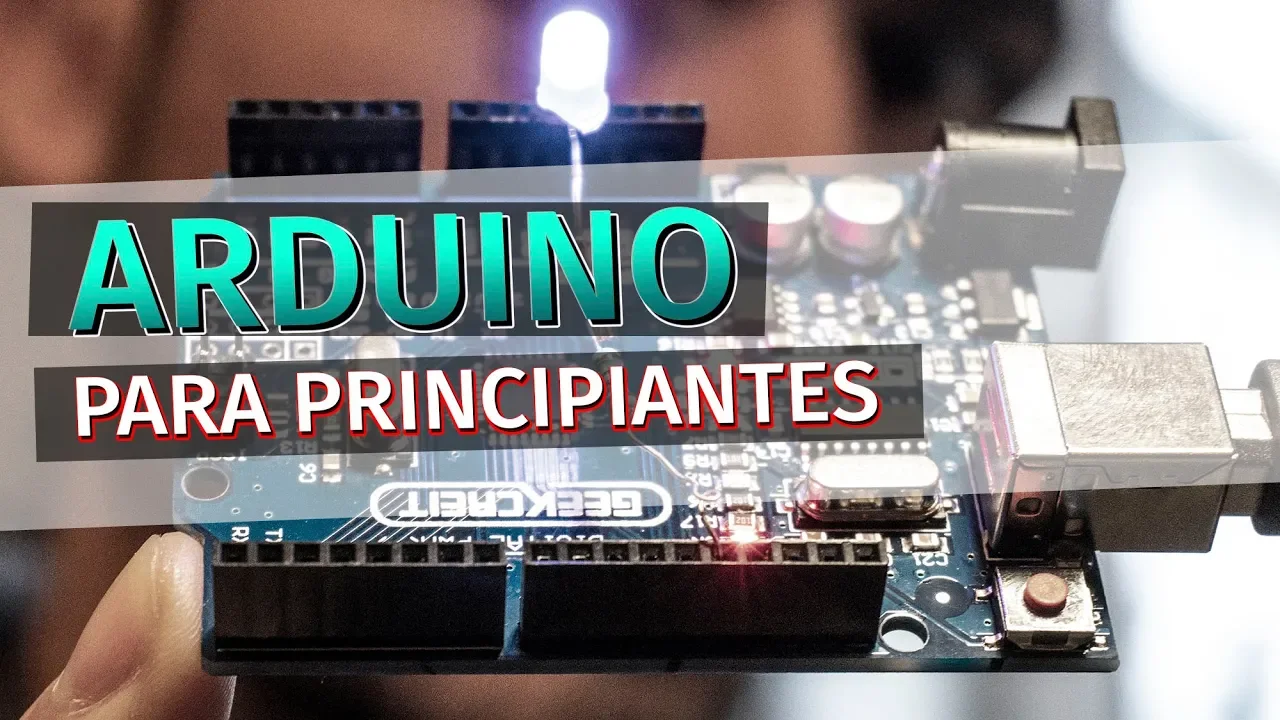
Arduino para principiantes | Instalar el IDE y comprender lo básico
340.7K
Arduino is a popular, economical electronics platform consisting of hardware (programmable boards with input/output ports) and software (Arduino IDE). The hardware is open-source, allowing users to create their own boards. The IDE runs on Windows, Mac, and Linux. Arduino uses a simplified C/C++ programming language, making it accessible to beginners. Applications include weather stations, automatic lighting systems, and various projects. To use Arduino, download the IDE from the official website and install it. The IDE provides access to code examples, documentation, and project ideas. Arduino programs consist of two main functions: void setup() (runs once at startup for configuration) and void loop() (runs continuously for main functionality). The Blink example demonstrates fundamental programming concepts including pinMode() for pin configuration, digitalWrite() for controlling outputs, and delay() for timing control.
Click to watch →
Deep Dive
Fundamental electrical engineering principles, specifically analog vs. digital signals, sensor wiring on a breadboard, and voltage division.
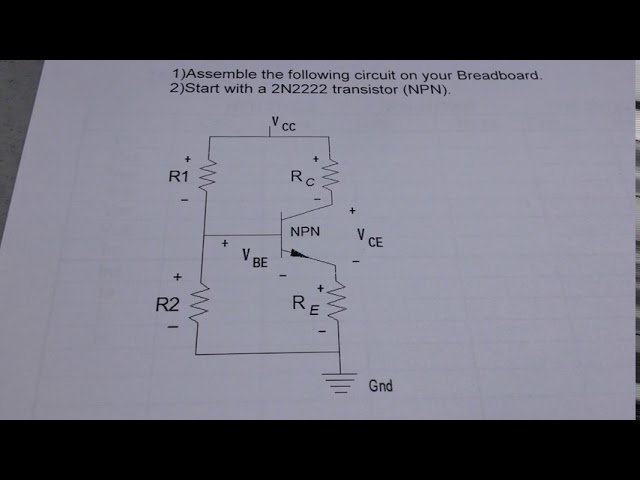
VOLTAGE DIVIDER
9.7K
This video demonstrates how to assemble a voltage divider circuit on a breadboard using a 2N2222 transistor, including proper identification of transistor pins (emitter, base, collector) based on the canister type (metal for 2N2222 with protruding part on left, plastic for 3904 with flat side), and correct wiring of resistors R1, R2, RC, and RE to VCC, ground, and transistor terminals.
Click to watch →

TechBits 13 - Analog and Digital Signals
210.6K
This section introduces the core concepts of analog and digital signals. Analog signals are continuous, varying smoothly between voltage rails (typically 0V to 5V), representing real-world phenomena like light intensity. Digital signals use only two states (on/off, 1/0) with defined threshold voltages to interpret inputs. The video explains how logic levels work, demonstrates light sensors as analog inputs, and shows how switches create digital signals. Understanding these fundamentals is essential for working with microcontrollers and electronic systems.
Click to watch →

Analog Signal vs Digital Signal in Hindi |Types of data converter| Learn EEE
19.5K
Analog and digital signals are fundamental concepts in electrical engineering. Digital signals are non-continuous electrical signals with discrete values (0 and 1), used in push buttons, limit switches, proximity sensors, and computer keyboards. Analog signals are continuous electrical signals that vary over time, used in temperature sensors, radio signals, solar panels, and human voice. Data converters (DAC and ADC) enable conversion between these signal types, allowing digital devices to interface with analog sensors and vice versa. The choice between signal types depends on application requirements for discrete control versus continuous monitoring.
Click to watch →

I built a $200 Digital Dash instead of buying a $2000 one.
68.7K
This section covers wiring analog sensors (pressure and temperature) to the Arduino using a power distribution board. Three-pin pressure sensors connect ground to distribution board ground, power to 5V section, and signal to designated analog pins (A0 for oil pressure, A1 for fuel pressure). Two-pin temperature sensors require pull-up resistor networks with 1k ohm resistors between signal and 5V. The presenter demonstrates proper soldering techniques for reliable connections and explains how the distribution board simplifies wiring multiple components requiring 5V or ground.
Click to watch →
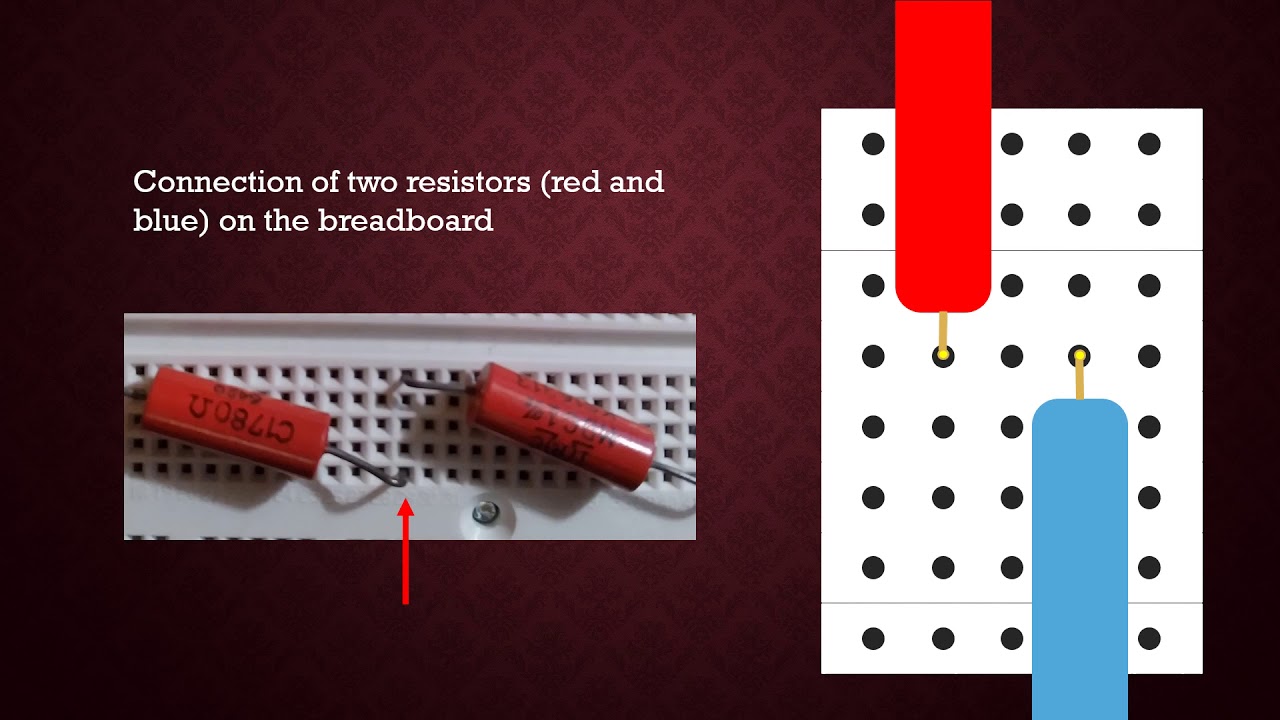
IA SA21 Lab 1, Part 2 Video
102
A voltage divider circuit divides an input voltage proportionally across series resistors based on their resistance values, where the voltage drop across each resistor equals the total current multiplied by its resistance (V = IR). In this demonstration, four resistors in series on a breadboard (totaling 6367 ohms) with 631mV applied show voltage drops of 177mV, 177mV, 100mV, and 177mV respectively, confirming that voltage divides proportionally across resistive stages.
Click to watch →
Deep Dive
Core scientific concepts of water quality parameters, such as the pH scale, turbidity (suspended solids), and how temperature affects water chemistry.
UGC NET Paper 1 Environment Marathon | Top 100 PYQs Marathon | All Important Topics | By Shiv Sir
56.1K
Water quality parameters include: 1) pH (chemical parameter measuring hydrogen ion concentration, acidic if <5.6, basic if >5.6), 2) Hardness (chemical parameter caused by calcium and magnesium ions), 3) Dissolved Oxygen (DO) (chemical parameter measuring oxygen content), and 4) Biochemical Oxygen Demand (BOD) (chemical parameter measuring organic pollution). Turbidity is a physical parameter measuring water clarity, not a chemical parameter.
Click to watch →

Day 2 | Environmental Engg | Quality Parameters of Water| SSC JE 2023 PAPER 1 | SANDEEP JYANI CIVIL
27.6K
Physical water quality parameters include suspended solids, turbidity, color, odor, and temperature. Suspended solids should not exceed 30 mg/L as they may contain biologically active agents. Turbidity measures cloudiness and is measured in NTU (Nephelometric Turbidity Units). Color indicates the presence of dissolved or suspended substances and can be carcinogenic. Odor is measured in Odor Units (OU) and should be between 1-3 OU. Temperature affects chemical and biological reactions in water and should be between 10-25°C for drinking water.
Click to watch →

PEOPLE DEVELOPMENT & ENVIRONMENT JAN 2025 PYQ | UGC NET JUNE 2025 Paper 1 | Sheemal Bhagi #ugcnet
6.8K
Water quality parameters are divided into physical, chemical, and biological categories: (1) Physical parameters - temperature, turbidity (cloudiness from suspended particles), total suspended solids (TSS); (2) Chemical parameters - pH (acidity/alkalinity), hardness (calcium and magnesium content), dissolved oxygen (DO), biochemical oxygen demand (BOD), chemical oxygen demand (COD), nitrates, phosphates, heavy metals; (3) Biological parameters - bacteria, algae, viruses, and bioindicators. Turbidity measures water clarity and is measured using Jackson turbidity units, Nephelometric turbidity units (NTU), or Formazin turbidity units. High turbidity indicates high suspended particle content and can affect water treatment and aquatic life.
Click to watch →

WATER QUALITY PARAMETER !! RSPCB JSO JEE #schoolofenvironmentalsciences #ugcnet
299
Water quality parameters are classified into Physical, Chemical, and Biological categories. Physical parameters include suspended solids (measured by gravimetric method at 104°C, limit 30 ppm), turbidity (measured by photometric/nephelometric method, limit 5 NTU), color (caused by dissolved organics, iron, manganese; limit 5 TCU), taste and odor (threshold odor number 1-3), and temperature (desirable range 10-25°C). Turbidity is measured using Turbidity Rod (5-10 JTU), Jackson Turbidity Meter (for turbidity >25 JTU), and Nephelometer (NTU units). Color testing should be performed within 72 hours of sample collection to prevent biological alteration.
Click to watch →

UPPSC AE 2020 | Theory with Visuals Quality of Water Part - II | Jaspal Singh
46.1K
Water quality parameters are classified into Physical (observable through senses), Chemical (composition-based), and Biological (microbial indicators). Suspended solids, the first physical parameter, are particles 1-1000 nanometers from organic (plant leaves) and inorganic (clay, glass) sources. They create psychological impact, discourage consumption, and interfere with treatment by shielding microorganisms from disinfection. Turbidity measures light scattering by suspended particles, reported in mg/L, ppm, or JTU. Turbidity and suspended solids concentration do not have a direct relationship - smaller particles cause more scattering. High turbidity blocks sunlight, reducing photosynthesis in aquatic plants. The Jackson Turbidity Unit method uses a platinum needle and graduated tube with silica dioxide (5 mg/L) as reference standard.
Click to watch →
Deep Dive
How to interface and display data on basic visual outputs like character LCDs using parallel or I2C communication protocols.

LCD1602 - это очень просто!
174.2K
The LCD display interface uses a data bus (D0-D7) for transmitting information, with RS determining command vs. data mode, RW controlling read/write direction, and E triggering data exchange. ASCII encoding (32-126) maps characters to binary values sent through the data pins. The initialization sequence configures the display mode and prepares it for data reception. Characters are displayed by converting ASCII values to binary, setting RS=1 (command mode), RW=0 (write mode), and sending a brief E pulse. The display is universal and independent of specific microcontroller architectures.
Click to watch →
![[Arduino] #5 - Wyświetlacz LCD i moduł I2C](https://i.ytimg.com/vi/kX2CVWNHJR4/maxresdefault.jpg)
[Arduino] #5 - Wyświetlacz LCD i moduł I2C
69K
This tutorial demonstrates how to connect and program an LCD display module with Arduino using the I2C communication protocol. The module includes an 8574 expander chip, contrast potentiometer, and jumper wires for address configuration. The video covers basic wiring (VCC, GND, SDA, SCL), contrast adjustment, and programming with the LiquidCrystal library to display text, read temperature sensors, and accept serial input.
Click to watch →
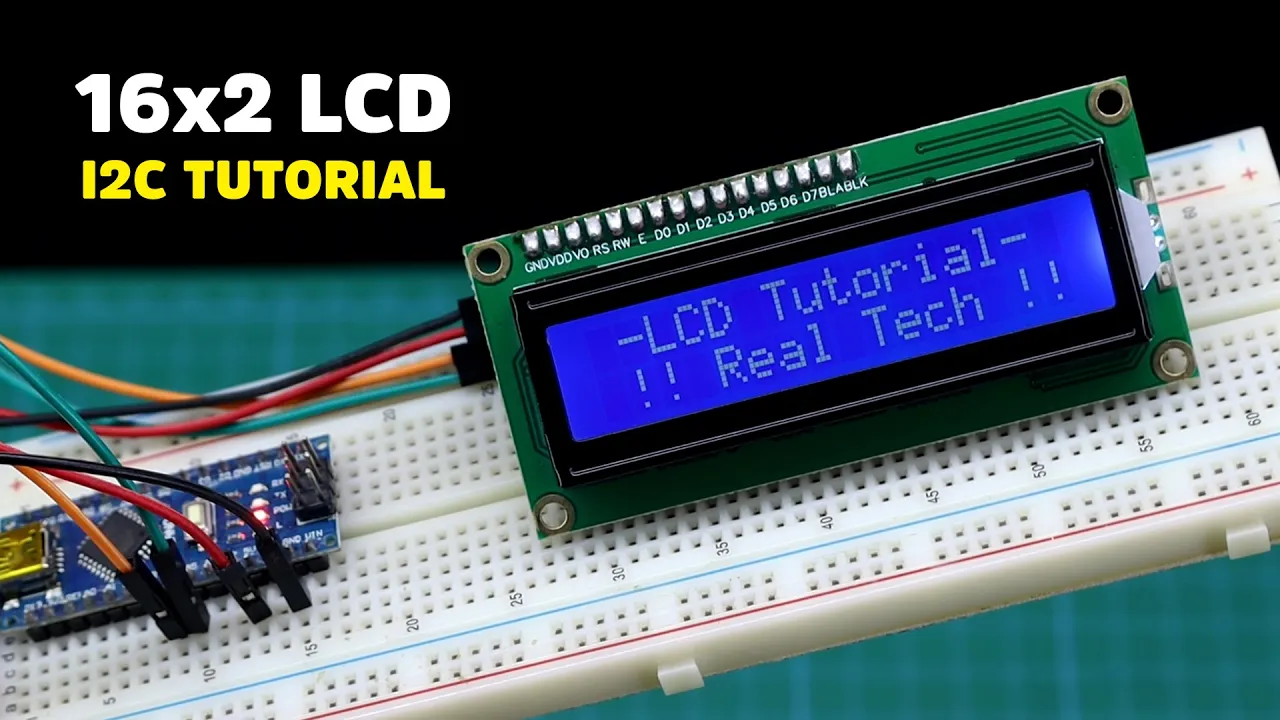
16x2 LCD with I2C for Arduino | Step-by-Step Guide for Beginners
28K
A 16x2 LCD display can show 16 characters per line across two lines, totaling 32 characters, and can be connected to an Arduino using either the traditional 4-bit mode (requiring 12 pins) or an I2C adapter (requiring only 4 pins including power). The I2C method uses the I2C communication protocol, which allows multiple devices to communicate using just two pins (SDA and SCL), making it ideal for projects with limited pin availability. To use I2C, install the LiquidCrystal_I2C library, connect VCC to 5V, GND to ground, SDA to Arduino A4, and SCL to Arduino A5, then use the I2C scanner code to find the module's address if needed.
Click to watch →
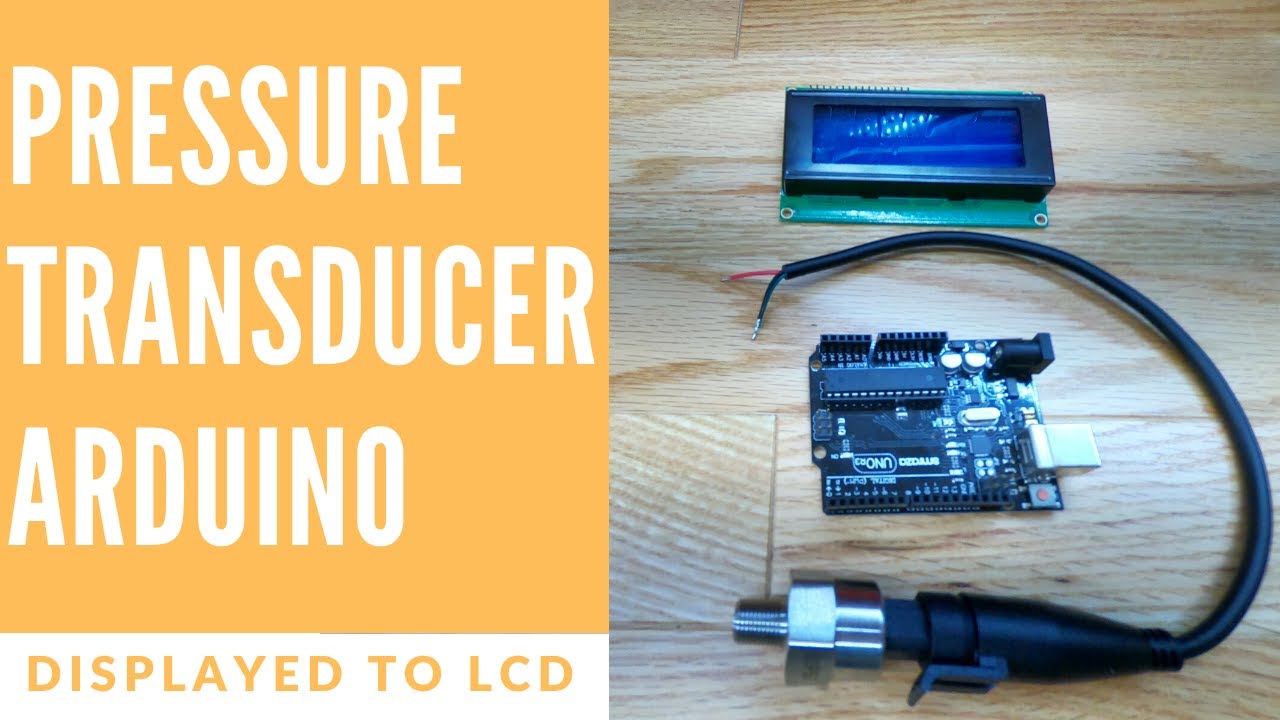
Pressure Sensor - Arduino
225.6K
The I2C (Inter-Integrated Circuit) communication protocol allows for simple connection between microcontrollers and LCD displays using only four pins: ground, 5V power, SDA (data line), and SCL (clock line). This is significantly simpler than using multiple pins required for standard parallel interface LCDs. For smaller 2x16 LCD screens, specialized backpack adapters can be attached to enable I2C communication, eliminating the need to use most Arduino pins directly.
Click to watch →
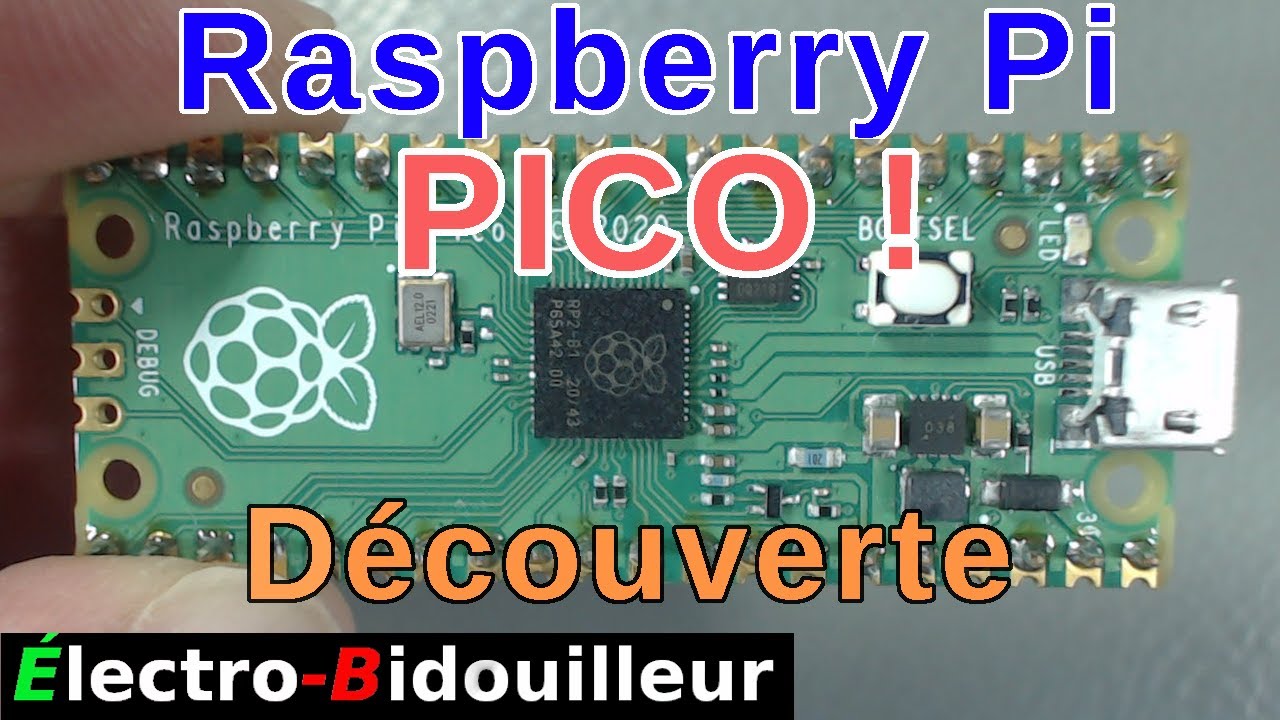
EB_#471 Découverte - Le Raspberry Pi Pico
34.7K
The Raspberry Pi Pico can interface with I2C LCD displays using the PCF8574 I2C-to-parallel converter chip. The display backpack module simplifies connection by converting I2C signals to parallel signals required by the LCD. Sample code from GitHub demonstrates initializing the display and showing text, including features like displaying time, date, and adjusting contrast and backlight settings.
Click to watch →
Prerequisite Knowledge
- Concept 01Basic C/C++ programming concepts for Arduino, including understanding the IDE, sketch structure (setup/loop), and managing external libraries.
- Concept 02Fundamental electrical engineering principles, specifically analog vs. digital signals, sensor wiring on a breadboard, and voltage division.
- Concept 03Core scientific concepts of water quality parameters, such as the pH scale, turbidity (suspended solids), and how temperature affects water chemistry.
- Concept 04How to interface and display data on basic visual outputs like character LCDs using parallel or I2C communication protocols.
Subsequent Learning
- Step 01IoT integration and wireless data logging to send sensor readings to cloud platforms (e.g., ThingSpeak, Adafruit IO) using Wi-Fi modules like the ESP8266 or ESP32.
- Step 02Advanced calibration techniques and mathematical data-filtering algorithms (such as moving average filters) to handle sensor noise and drift over time.
- Step 03Designing low-power, field-ready environmental monitoring systems, including battery management, solar charging circuits, and leveraging microcontroller sleep modes.
- Step 04Developing closed-loop automated water treatment systems that trigger physical actuators (like pumps, aerators, or chemical dosing valves) based on real-time sensor thresholds.
System Overview
Live Demo
Final Display
System Overview
0:02Playing Section
- 1
Detailed block diagram of water monitoring system with sensor connections.
- 2
Lists components: power supply, Arduino, pH, LDR, LM35, turbidity, and LCD.
- 3
Explains wiring and pin mapping for LCD and analog sensor inputs.
Limitations of Low-Cost DIY Sensors in Professional Environmental Monitoring
While Arduino-based water quality monitoring systems are excellent educational tools and cost-effective prototypes, they face significant criticism regarding their reliability, accuracy, and long-term viability in professional environmental science. Low-cost consumer sensors, particularly cheap pH and turbidity probes, suffer from rapid calibration drift, high sensitivity to biofouling, and a lack of robust temperature compensation, leading to inaccurate data over time. Professional environmental monitoring demands rigorous quality assurance, industrial-grade housing to withstand harsh environments, and regular automated calibration, which basic DIY microcontroller setups cannot easily sustain. Consequently, relying on such hobbyist systems for critical regulatory compliance, scientific research, or public safety decisions is highly discouraged by environmental scientists and engineers.
Deep Dive
IoT integration and wireless data logging to send sensor readings to cloud platforms (e.g., ThingSpeak, Adafruit IO) using Wi-Fi modules like the ESP8266 or ESP32.
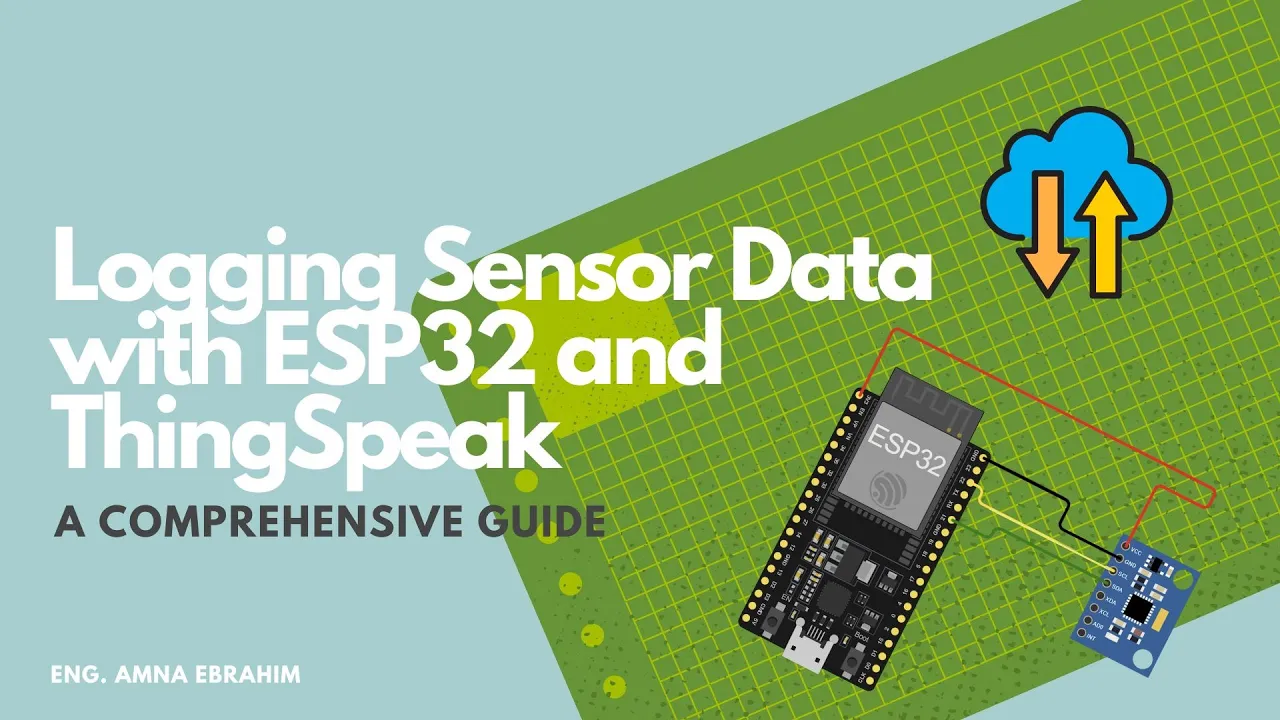
Sensor Data Logging with ESP32 & Thingspeak
812
This section covers the technical implementation of sensor data acquisition and wireless communication. Topics include: modifying Adafruit MPU6050 example sketch to integrate with cloud services; adding Wi-Fi library and ThingSpeak library dependencies; configuring Wi-Fi credentials (SSID and password) for internet connectivity; defining channel number and API key for authentication; implementing a dedicated Wi-Fi connection function that displays connection status through serial output; and initializing the ESP client for subsequent HTTP communications. The integration demonstrates how to extend basic sensor reading examples into connected IoT applications.
Click to watch →

20 Dollar 20 Minute Wifi Weather Station with ESP8266 & Thingspeak
143K
In the ESP Easy web interface, configure the data sending protocol to 'Thingspeak'. Enter the API key and the Thingspeak hostname (api.thingspeak.com). Set the update frequency (e.g., every 6 seconds). The ESP Easy firmware will send sensor readings to Thingspeak as data points. The Thingspeak private view will display the incoming data.
Click to watch →

Arduino with ThinkSpeak | Monitoring IoT data over ThingSpeak | ThingSpeak with esp8266 | 2024
70.4K
This comprehensive workflow covers sending sensor data from Arduino Uno to ThingSpeak using ESP8266 WiFi module. The process involves: (1) Creating a ThingSpeak account and setting up a channel with defined fields for monitoring variables like temperature, humidity, and light intensity; (2) Configuring WiFi credentials and API keys in Arduino code; (3) Setting up SoftwareSerial for ESP8266 communication using pins 2 and 3; (4) Writing code to generate or read sensor data, format it as a string with API key and field values, and transmit it to api.thingspeak.com on port 80. The system successfully sends data to the cloud where it appears graphically on the ThingSpeak dashboard.
Click to watch →

$3 Wifi module part 2: ThingSpeak Demo
11.6K
The ESP8266 is a $3 Wi-Fi module that enables Arduino-based devices to connect to the internet using AT commands (such as AT+CIPSTART for Wi-Fi connection and AT+CIPSEND for data transmission), allowing users to send sensor data to cloud platforms like ThingSpeak for visualization and analysis.
Click to watch →

ESP8266 with Adafruit IoT Platform, Adafruit IO, Adafruit MQTT ESP8266 IoT Project
15.5K
This tutorial demonstrates how to create an IoT sensor monitoring system using the Nodemcu ESP8266 WiFi module and Adafruit IO platform. The project connects a DHT11 temperature and humidity sensor to the ESP8266, which reads sensor data and transmits it to the Adafruit IO cloud platform via MQTT protocol. The Adafruit IO dashboard displays real-time sensor readings through gauge visualizations. The system also includes an OLED display for local monitoring and a buzzer that triggers when temperature exceeds 40°C. The tutorial covers creating an Adafruit IO account, setting up dashboards and feeds, installing necessary Arduino libraries (Adafruit MQTT, DHT, SSD1306), and writing code to read sensors, connect to WiFi, and send data to the cloud platform.
Click to watch →
Deep Dive
Advanced calibration techniques and mathematical data-filtering algorithms (such as moving average filters) to handle sensor noise and drift over time.

Filtrage Numérique avec TIA Portal S7-1200 / 1500 - Moyenne mobile, équation de récurrence
5.7K
Digital filtering eliminates noise from sensor signals or smooths trends. Moving average calculates input averages over time intervals: fixed averages compute results after collecting N points, while dynamic averages recalculate at each sample by including new and excluding oldest points. A key trade-off exists: more points improve smoothing but increase delay. Memory requirements grow with window size, potentially causing resource issues.
Click to watch →
Agetech 센서융합개론 - 1장
956
The average filter demonstration shows raw noisy data (red) and filtered data (blue) converging to the true value (14.4). This demonstrates how recursive average filtering removes noise while tracking the underlying signal. Moving average filter extends simple average by maintaining a fixed window size. Unlike simple average which considers all data, moving average only considers the most recent N data points. When new data arrives, the oldest data point is discarded to maintain constant window size. The formula is: X_k = (1/N) * Σ_{i=0}^{N-1} X_{k-i}. This allows tracking changing signals while reducing noise, making it suitable for applications where the underlying signal changes over time, such as stock market analysis.
Click to watch →

Lec 12 Kalman filtering Technique
2.6K
This section establishes the foundational motivation for Kalman filtering in autonomous systems. Raw sensors suffer from noise, bias, and drift—GPS errors range from 1-10m depending on conditions, while IMUs accumulate bias over time. Single sensors cannot observe all state variables, and nonlinear sensors add complexity. The Kalman filter provides a statistically optimal recursive solution to estimate hidden states by combining multiple noisy sensor measurements with system models. For linear systems, the mathematical framework consists of the process equation x_dot = Ax + Bu and measurement equation z = Hx, discretized as x_k = Ax_{k-1} + Bu_{k-1} + w_k and z_k = Hx_k + v_k, where w_k and v_k represent zero-mean Gaussian process and measurement noise with covariances Q and R respectively.
Click to watch →

Russia Will Never Forget This Ukrainian Drone Attack
147.6K
Navigation sensors accumulate small errors over time. A gyroscope measuring 0.01 degrees per second when the drone is actually flying straight adds up to 36 degrees of phantom rotation over an hour. An accelerometer with a tiny bias of 0.001g accumulates as phantom velocity and then phantom distance. The navigation computer uses a Kalman filter to minimize these errors by continuously weighing each sensor's reliability against others and calculating the most probable position. However, even the best filters cannot eliminate drift entirely—position uncertainty can grow to 5-8 km over 90 minutes of autonomous flight.
Click to watch →
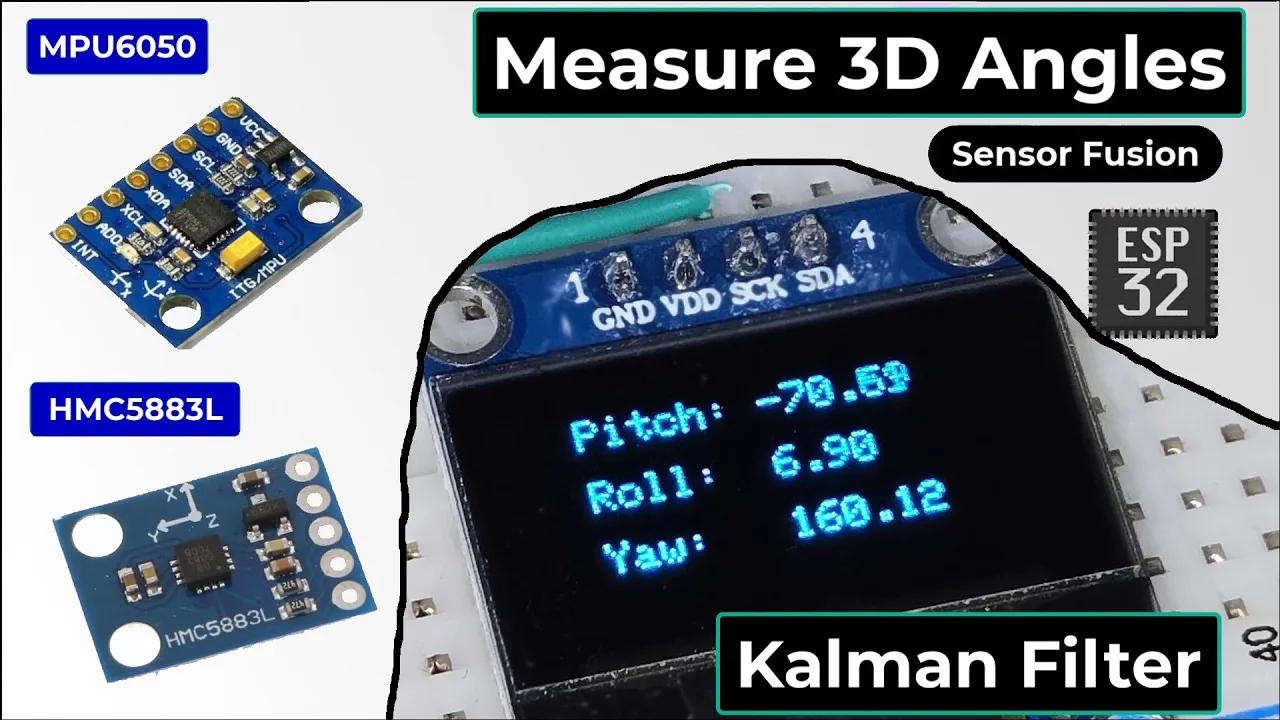
Sensor Fusion (MPU6050 + HMC5883L) || Kalman Filter || Measure Pitch, Roll, Yaw Accurately
35.3K
This tutorial demonstrates how to combine data from MPU6050 accelerometer-gyroscope and HMC5883L magnetometer sensors using sensor fusion and Kalman filter algorithms to accurately measure 3D orientation angles (pitch, roll, and yaw) on an ESP32 microcontroller, overcoming individual sensor limitations such as noise, drift, and magnetic interference through mathematical filtering techniques.
Click to watch →
Deep Dive
Designing low-power, field-ready environmental monitoring systems, including battery management, solar charging circuits, and leveraging microcontroller sleep modes.

BitBastelei #630 - Abgelegene Sensorschaltungen per Solar versorgen
7.7K
Microcontrollers like ESP32 feature built-in DeepSleep modes that dramatically reduce power consumption from milliamperes to microamperes. For maximum efficiency, the Power LED should be disconnected during sleep. For even greater power savings, external RTC (Real-Time Clock) circuits can wake the system at predetermined intervals, allowing the entire microcontroller and voltage regulation circuitry to remain in sleep mode until needed. This approach is particularly valuable when minimizing battery size or maximizing deployment duration is critical.
Click to watch →
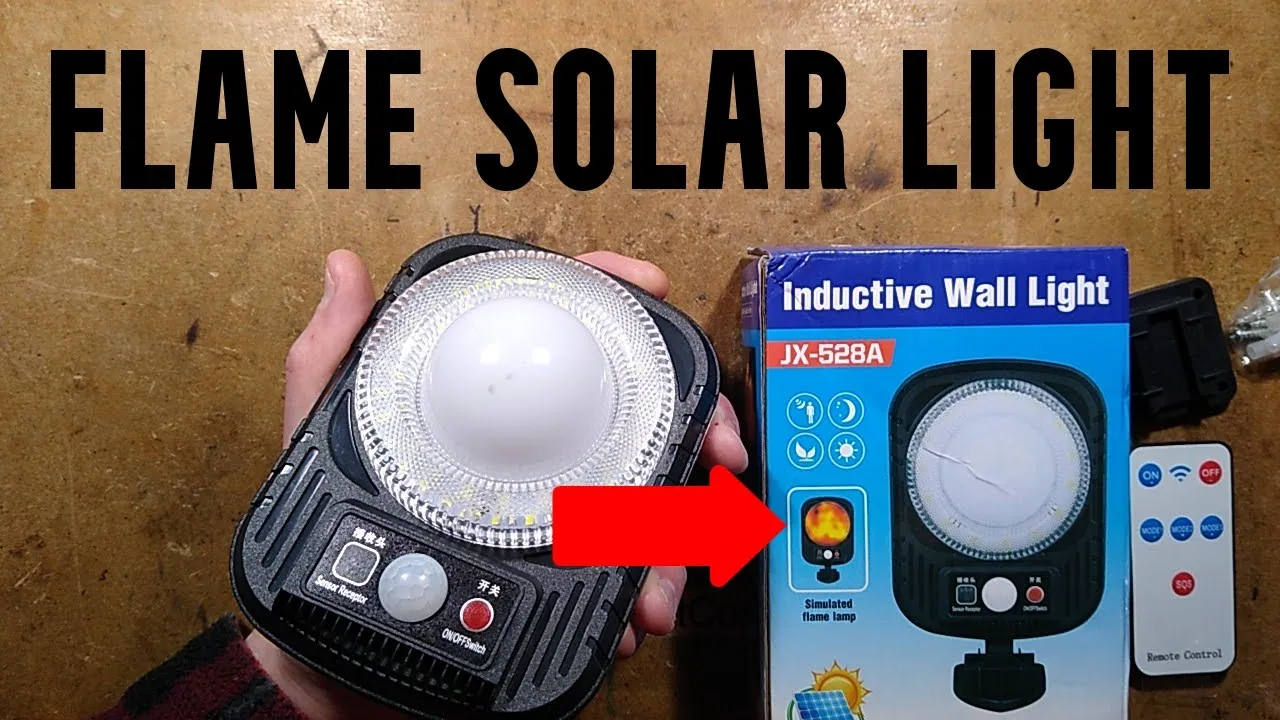
6000W solar flame light - with schematic
71.7K
Solar-powered devices implement sophisticated power management strategies. The microcontroller controls power distribution to sensors, LEDs, and the battery. Lithium batteries cannot be charged below freezing temperatures, as lithium ions cannot intercalate properly and form damaging layers. The solar panel generates 5.5 volts through 11 sections, fed through a 100 ohm resistor to an NPN transistor for voltage regulation. The microcontroller monitors voltage through a 100K resistor divider to detect dusk and manage charging. When the cell reaches 4.2 volts, the microcontroller shunts the voltage down and turns off charging. This demonstrates how embedded systems implement environmental sensing and power management for efficient operation.
Click to watch →
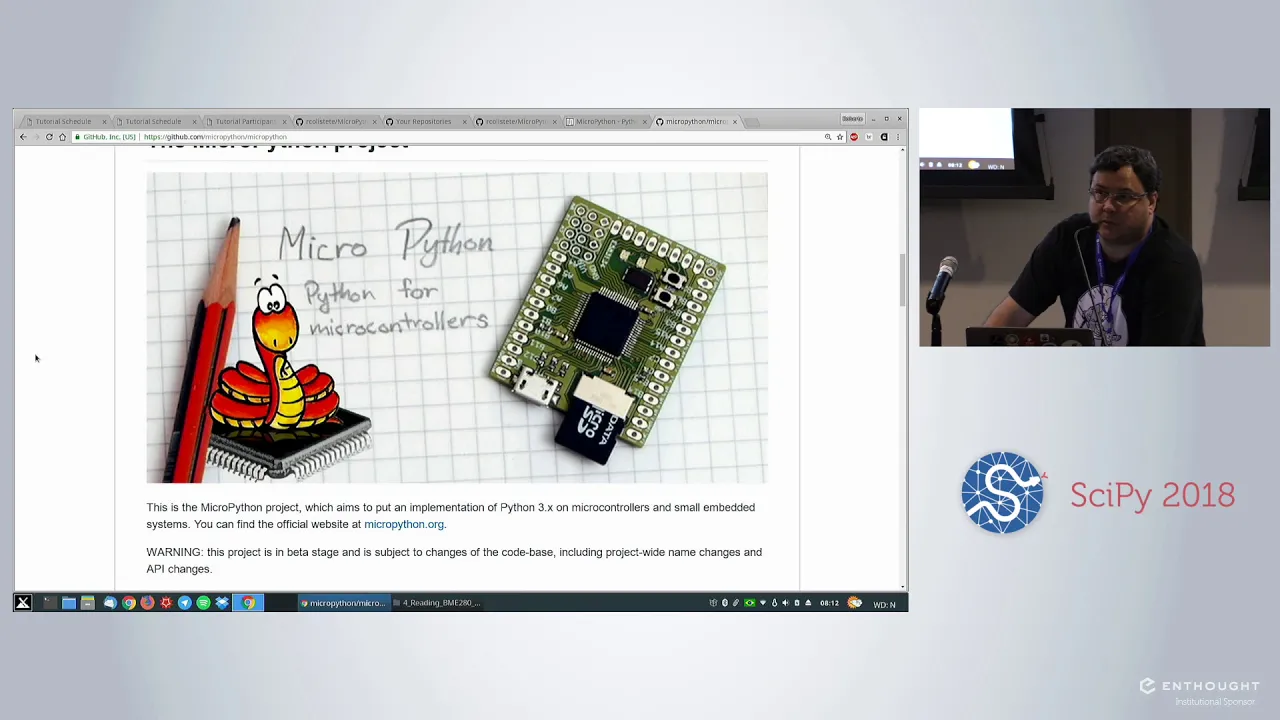
Scientific MicroPython on Microcontrollers | SciPy 2018 Tutorial | Roberto Colistete Jr
2.6K
Microcontroller power management enables years-long battery operation through multiple sleep modes: light sleep, deep sleep, and hibernation. Deep sleep can reduce power to microampere levels, achieving 7-10 year battery life in properly designed systems. Edge computing principles recommend preliminary data processing at the sensor level to minimize communication overhead. Power transitions between sleep modes require timing optimization—applications waking from deep sleep must account for transition delays when scheduling measurements.
Click to watch →
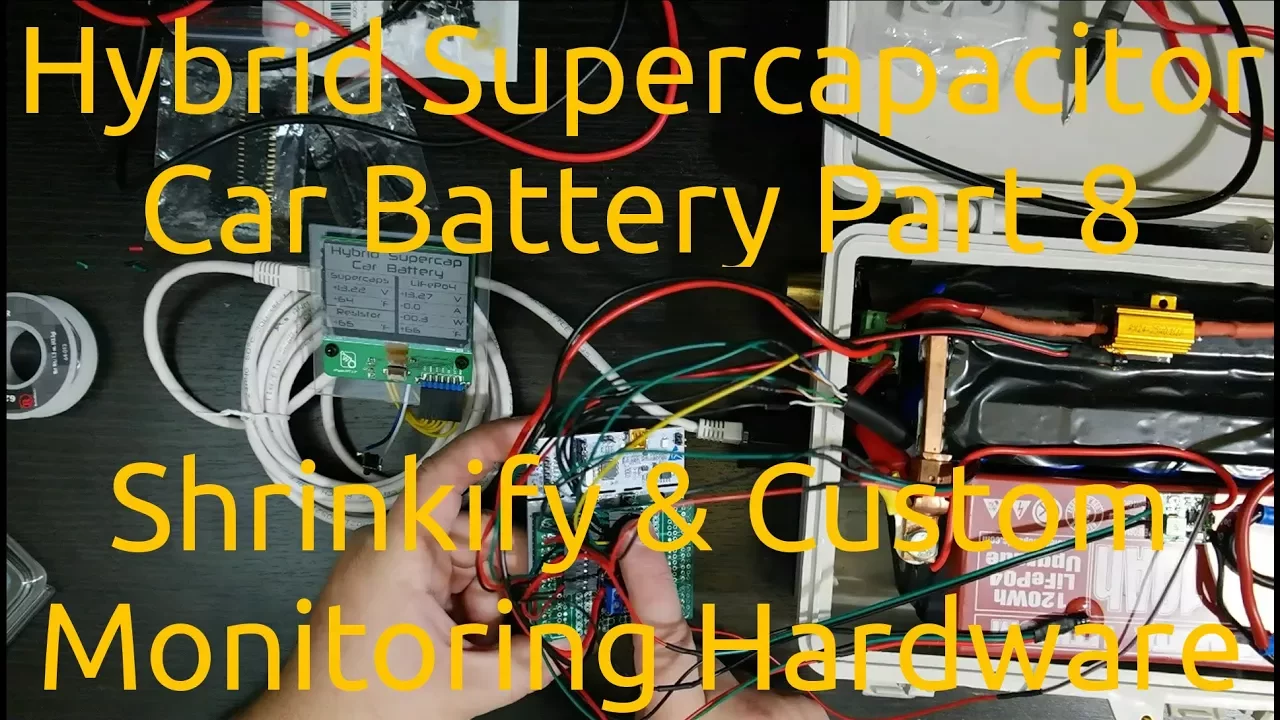
Hybrid Supercapacitor Car Battery Part 8 - Shrinkify & Custom Monitoring Hardware
28.3K
This extensive demonstration covers the complete process of designing an embedded monitoring system for battery applications. The project uses an STM32 L073 microcontroller (Cortex-M0+ at 32MHz, 192KB flash, 20KB SRAM) as the central processing unit, demonstrating how to select appropriate microcontrollers based on application requirements. Key topics include: hardware integration of multiple sensors (INA219 for current/voltage, TMP36 for temperature, and Sharp memory LCD for display), power optimization techniques including voltage regulation and sleep modes, and system-level power analysis comparing custom solutions against commercial alternatives. The project demonstrates achieving approximately 0.34W active power consumption and near-zero sleep mode consumption, representing approximately 4x improvement over commercial modules.
Click to watch →
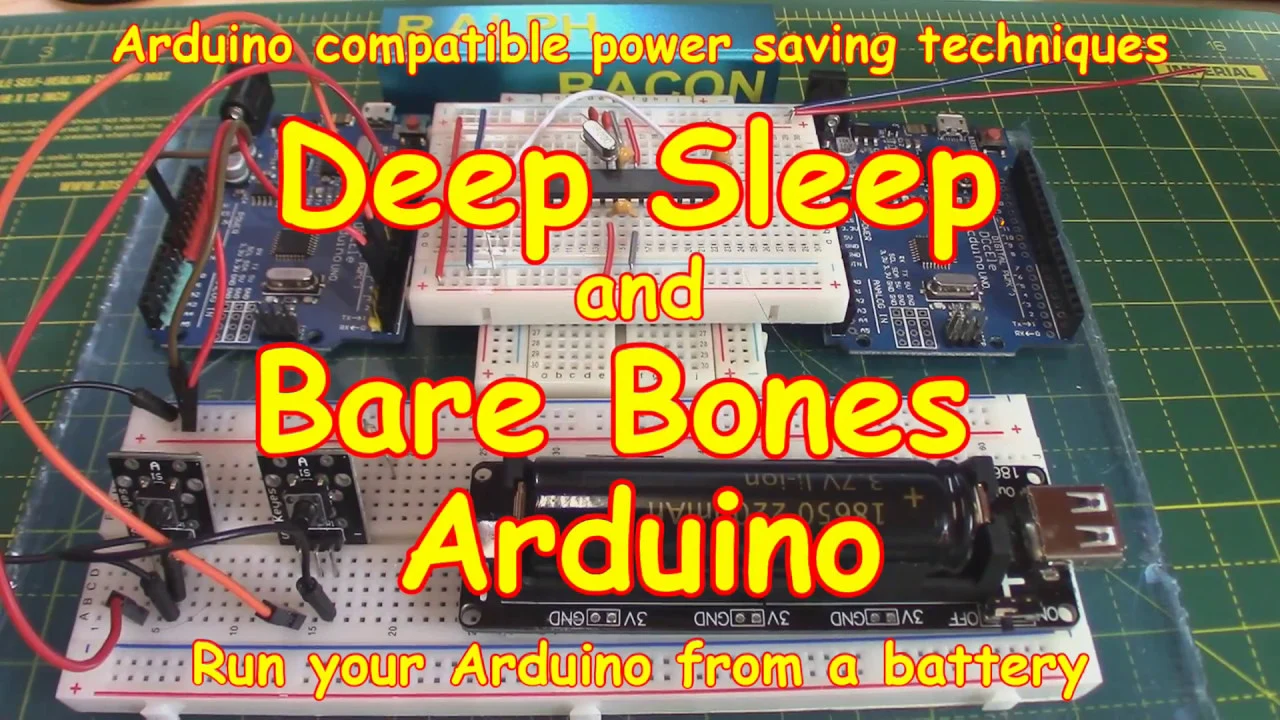
#116 Deep Sleep 💤 Bare-Bones Arduino (using wake up ⏱️ TIMER)
18.2K
A properly configured microcontroller in sleep mode can consume as little as 25 microamps. This extremely low power consumption is achieved by disabling most peripheral functions and allowing the watchdog timer to handle wake-up. At this power level, a typical battery can power the device for many weeks, making it suitable for long-term battery-powered applications.
Click to watch →
Deep Dive
Developing closed-loop automated water treatment systems that trigger physical actuators (like pumps, aerators, or chemical dosing valves) based on real-time sensor thresholds.
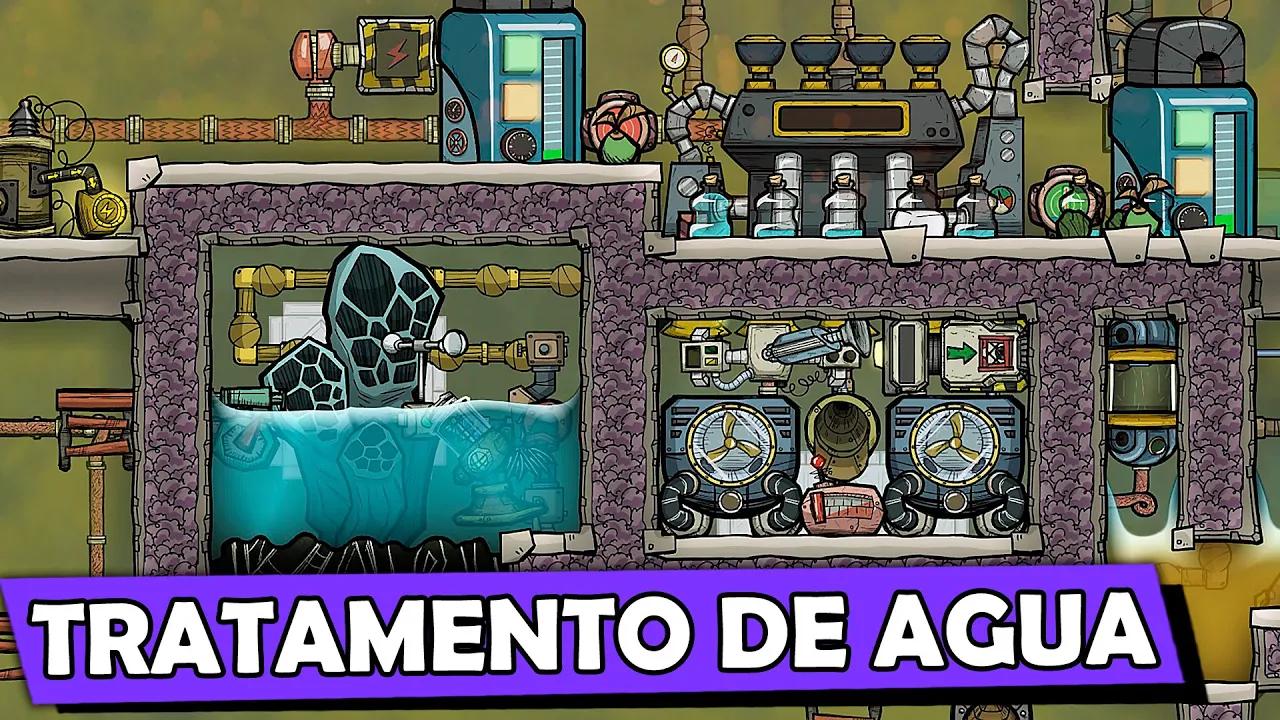
SISTEMA de TRATAMENTO de AGUA POLUIDA em LIMPA!! - Oxygen Not Included #14
22.9K
In Oxygen Not Included, temperature sensors can trigger automated valve systems. The player sets a 50°C threshold: when temperature exceeds 50°C, the valve closes and the cooler activates; when below 50°C, the valve opens and the cooler deactivates. This creates an automated temperature regulation loop. The player also explains liquid priority systems (pontes de líquido) that determine which water flows first through junctions, ensuring turbine water has priority to flow through the cooling system.
Click to watch →

New Automation Surprise & First look at the basics - Timberborn | Spillage Map | Hard #8
268
Three sensors manage water: flow sensor measures water flow, death sensor measures water death, and contamination sensor measures contamination levels. The valve (formerly snooze) can be combined with contamination sensors to automatically close when contamination exceeds thresholds like 5%. The death sensor can automate fluid dumps based on water levels, with players setting thresholds (like 0.4 meters) to trigger actions when levels fall below. This enables automated irrigation and water management systems.
Click to watch →
03 | Bienvenido al curso arduino | Sensores y Actuadores
4.2K
Sensors are devices that detect physical changes in the environment (such as light, temperature, or sound) and send this information to a processor like Arduino, which then makes decisions and triggers actuators—devices that convert electrical energy into physical actions (such as motors, pumps, or valves)—to automate processes and create interactive systems.
Click to watch →

TIMBERBORN 1.0 - Comment on a traversé 35 jours d'eau toxique (sur 43 jours) #8
149
Automation systems can be configured to trigger actions when values fall below or exceed specific thresholds. For example, a pump can be activated when water depth is less than 1 unit, and irrigation can be controlled when depth is less than 5 units. This threshold-based approach allows for precise control over automated systems based on real-time measurements.
Click to watch →
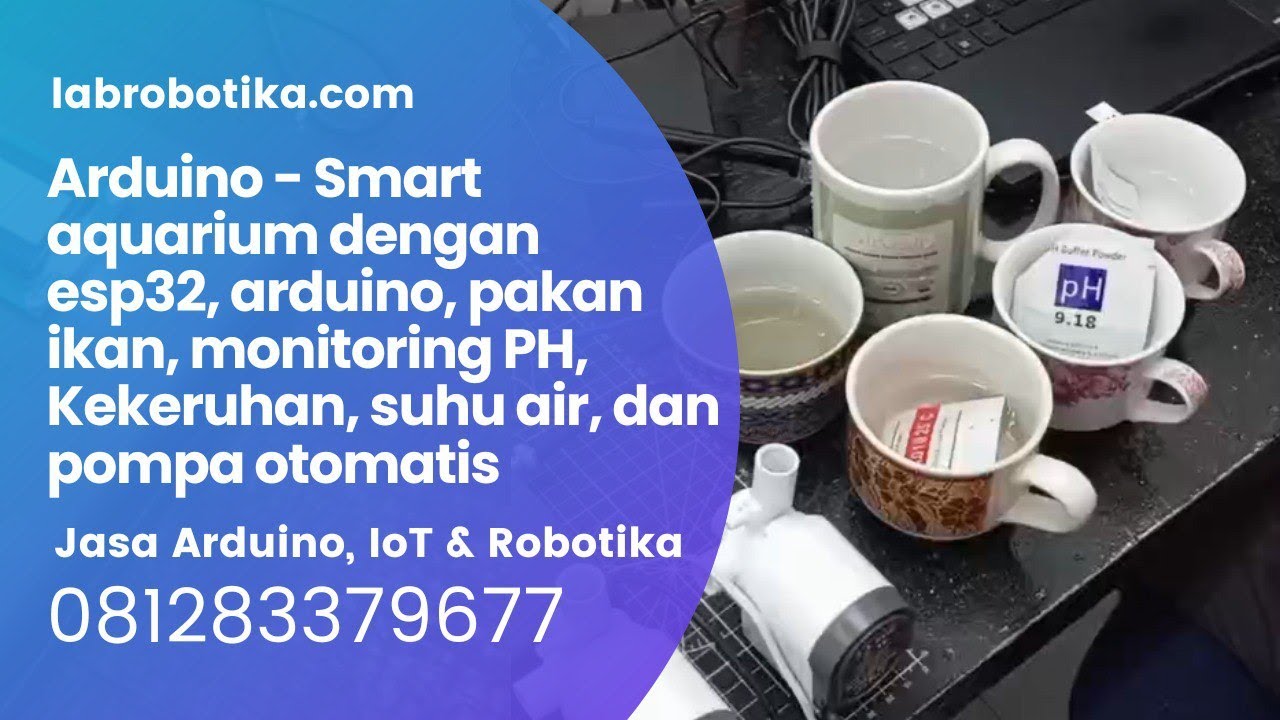
Arduino Smart aquarium dengan esp32, arduino, pakan ikan, monitoring PH, Kekeruhan, suhu air, dan
111
Automated water quality control systems use sensor-based feedback loops to maintain optimal aquatic conditions. The system implements tiered responses based on turbidity readings: clear water (0-20 NTU) requires no pump activation, moderately cloudy water (21-50 NTU) triggers 5-minute pump cycles, and very cloudy water (>50 NTU) activates 10-minute pump cycles. Similarly, pH control uses threshold-based logic where pumps activate when readings fall below or exceed optimal ranges, creating closed-loop control systems that automatically respond to environmental changes without human intervention.
Click to watch →
System Overview
Live Demo
Final Display
System Overview
0:02- 1
Detailed block diagram of water monitoring system with sensor connections.
- 2
Lists components: power supply, Arduino, pH, LDR, LM35, turbidity, and LCD.
- 3
Explains wiring and pin mapping for LCD and analog sensor inputs.
Limitations of Low-Cost DIY Sensors in Professional Environmental Monitoring
While Arduino-based water quality monitoring systems are excellent educational tools and cost-effective prototypes, they face significant criticism regarding their reliability, accuracy, and long-term viability in professional environmental science. Low-cost consumer sensors, particularly cheap pH and turbidity probes, suffer from rapid calibration drift, high sensitivity to biofouling, and a lack of robust temperature compensation, leading to inaccurate data over time. Professional environmental monitoring demands rigorous quality assurance, industrial-grade housing to withstand harsh environments, and regular automated calibration, which basic DIY microcontroller setups cannot easily sustain. Consequently, relying on such hobbyist systems for critical regulatory compliance, scientific research, or public safety decisions is highly discouraged by environmental scientists and engineers.
Basic C/C++ programming concepts for Arduino, including understanding the IDE, sketch structure (setup/loop), and managing external libraries.
Fundamental electrical engineering principles, specifically analog vs. digital signals, sensor wiring on a breadboard, and voltage division.
Core scientific concepts of water quality parameters, such as the pH scale, turbidity (suspended solids), and how temperature affects water chemistry.
How to interface and display data on basic visual outputs like character LCDs using parallel or I2C communication protocols.
IoT integration and wireless data logging to send sensor readings to cloud platforms (e.g., ThingSpeak, Adafruit IO) using Wi-Fi modules like the ESP8266 or ESP32.
Advanced calibration techniques and mathematical data-filtering algorithms (such as moving average filters) to handle sensor noise and drift over time.
Designing low-power, field-ready environmental monitoring systems, including battery management, solar charging circuits, and leveraging microcontroller sleep modes.
Developing closed-loop automated water treatment systems that trigger physical actuators (like pumps, aerators, or chemical dosing valves) based on real-time sensor thresholds.
18.8K views279likes4:43@svskitsOriginal Release: 2023-11-07
yeah hi water level monitoring system water level quality monitoring system so in this project we are using an turbidity sensor and pH sensor along with water level detection and ldr sensor and temperature sensor so in this project let us go first block diagram so water quality monitoring using pH ldr lm35 turbidity and water level so power supply module 5 Vols power supply Ado you know R3 and one pH ldr combination sensor temperature combination sensor 16 Cross 4 LCD display RS enabl D4 D5 D6 D7 8 9 10 11 12 13 pin numbers turbidity sensor it is connected to the a z analog zero pin so it can detect the normal water some dust water and mud water okay three combinations so 230 input Step Down Transformer 9 Vols output AC Bridge rectifier filter capacitor 780 regulator 1 LED power supply board adreno Uno R3 reset button 8 9 10 11 12 13 LCD PIN numbers so here TX is sending the data to RX of adreno Uno LCD display and turity sensor so water quality monitoring system turbidity pH water quality temperature okay now I'm giving the temperature increment okay temperature is increased so ldr I'm going to dark okay ldr should be zero so l l is equal zero so now I'm going for the turity sensor now 10 n normal water so I'm displaying okay normal water so now I'm going to mud water okay so now I'm going for the P sensor okay so P sensor is going to deep onto the water after third count third second or third count it will display the value okay pH value displayed so if you're are going to increase the temperature temperature value is also increasing pH W1 L for ldr okay so now I'm going to insert onto the water dust water okay so now okay mud water okay so maybe any water goes onto the sensor it will detect the value only okay pH water level ldr and the temperature sensor ldr sensor if you're closing this the value should be goes to zero okay power supply board T sensor and terity mod sensor this is the sensor and the calibration and 16 cross2 LC display ADR Uno R3 16 Cross 4 LCD okay and the PS sensor thank you so normal water quality monitoring pH ldr lm35 turbidity water level detection all the values should be displayed on the 16 cross2 LC 16 CR 4 LCD display only only monitoring the sensors data onto the LCD display
Up Next

32:52
Arduino Data Logging with SD Cards: Complete Tutorial
@sciguy14
340.6K views•2011-04-05
30:32
Ultrasonic Transducers: Resonant Frequency Measurement and Horn Design
@imajeenyus42
229.9K views•2017-02-22
54:16
Polymer Environmental Degradation: Mechanisms & Stabilization
@iit
1.8K views•2012-07-10
33:39
How a Student's Question Saved a NYC Skyscraper from Collapse
@veritasium
22.8M views•2025-04-26
Related Study Plans & Knowledge Roadmaps
Structured learning paths in Engineering
engineering
Building Acoustic Levitators: Physics & Arduino
01The Physics of Sound and Standing Waves
02Piezoelectric Transducers and H-Bridge Drivers
03Arduino Programming: Generating 40 kHz Signals
+ 2 more learning modules
14h5 modules
Explore Roadmap
engineering
Building Peltier Cloud Chambers: Particle Tracks
01Cosmic Rays & Cloud Chamber Physics
02Thermoelectric Cooling (TEC) Fundamentals
03Custom Liquid-Cooling Loop Design
+ 2 more learning modules
18h5 modules
Explore Roadmap
engineering
Yagi-Uda Antennas: Modeling, Build & VNA Test
01Introduction to RF and Antenna Fundamentals
02Yagi-Uda Antenna Design Principles
03Antenna Modeling and Simulation in 4NEC2
+ 2 more learning modules
18h5 modules
Explore Roadmap
engineering
ECG Monitor Design: Op-Amps, Filters & Noise
01Electronics & Breadboard Basics
02Op-Amps and Instrumentation Amplifiers
03Bioelectricity and ECG Fundamentals
+ 2 more learning modules
18h5 modules
Explore Roadmap