Praat is an open-source phonetics software with two main windows: the Objects window displaying audio files and the Picture window showing visualizations; the Sound Editor window contains a waveform, spectrogram, duration bars, and zoom buttons for analyzing sound files, allowing users to select sections and analyze formants, pitch, and intensity.
Praat Tutorial: Getting Started with the Interface (2025)
Added:Deep Dive
Basic concepts of acoustic phonetics, including sound waves, frequency, amplitude, and duration.
Introduction To Acoustic Phonetics
13.6K
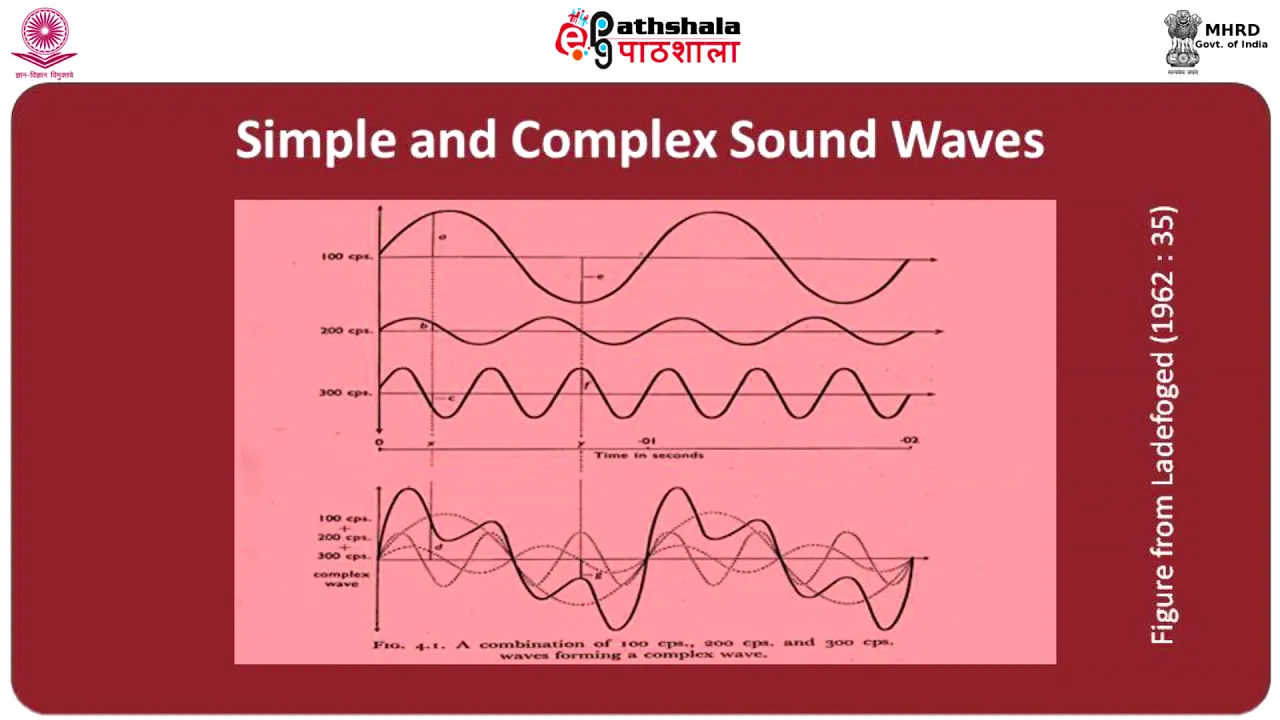
Acoustic phonetics is one of three interconnected branches of phonetics, alongside articulatory phonetics (production) and auditory phonetics (perception). A complete description of speech sounds requires understanding all three aspects together. Sound waves have three fundamental properties: time (x-axis), amplitude (maximum deviation from rest position, y-axis), and frequency (number of cycles per second). One complete cycle represents the wavelength. Sound production requires two essential preconditions: a source of energy/disturbance and a medium for transmission. In speech, the larynx serves as the primary source through vocal cord vibration, creating phonated airstream that travels through the oropharyngeal chamber. Sound waves are classified as periodic (regular, repeating patterns at consistent intervals) or aperiodic (irregular, changing unpredictably). When multiple periodic sine waves combine, the resulting wave remains periodic with a frequency equal to the highest common denominator of its constituents. From an auditory perspective, periodic waves are perceived as musical and pleasant, while aperiodic waves are considered non-musical or noise.
Click to watch →
MASTER CADRE| ENGLISH| MASTER CADRE ENGLISH | punjab teacher elegibility test 2026
104
Acoustic phonetics is the study of the physical properties of speech sounds, including frequency (pitch), intensity (loudness/amplitude), and duration. This branch analyzes the acoustic characteristics of speech sounds, such as how high or low a pitch is, how loud a sound is, and how long a sound lasts. These physical properties determine how speech sounds are perceived.
Click to watch →

Phonetics and Phonology: Understanding the Sounds of Speech #maenglishliterature #secondsemester
513
Acoustic phonetics studies the transmission of speech sounds and their physical properties. Sound waves have three main properties: (1) Amplitude - maximum displacement from mean position, measured as height from center to crest or trough; (2) Frequency - number of vibrations passing a fixed point per unit time, measured in Hertz; (3) Wavelength - distance between two identical points (crest to crest or trough to trough), measured in meters. Pitch is higher when frequency is higher. The fundamental frequency (F0) is the lowest frequency component of the waveform, representing the basic pitch of a speaker's voice.
Click to watch →

Phonetics & Phonology Basic Definitions HEC based Syllabus Lecture No 1
652
Acoustic phonetics is the second branch of phonetics. It studies the physical properties of speech sounds and how they are transmitted from the mouth to the ear. The important characteristics of sounds studied under this branch include amplitude (intensity, which is the power of sound), frequency (the repetition rate), and duration (the time period of sound production). This branch is objective in nature as it deals with measurable physical properties of sound waves.
Click to watch →
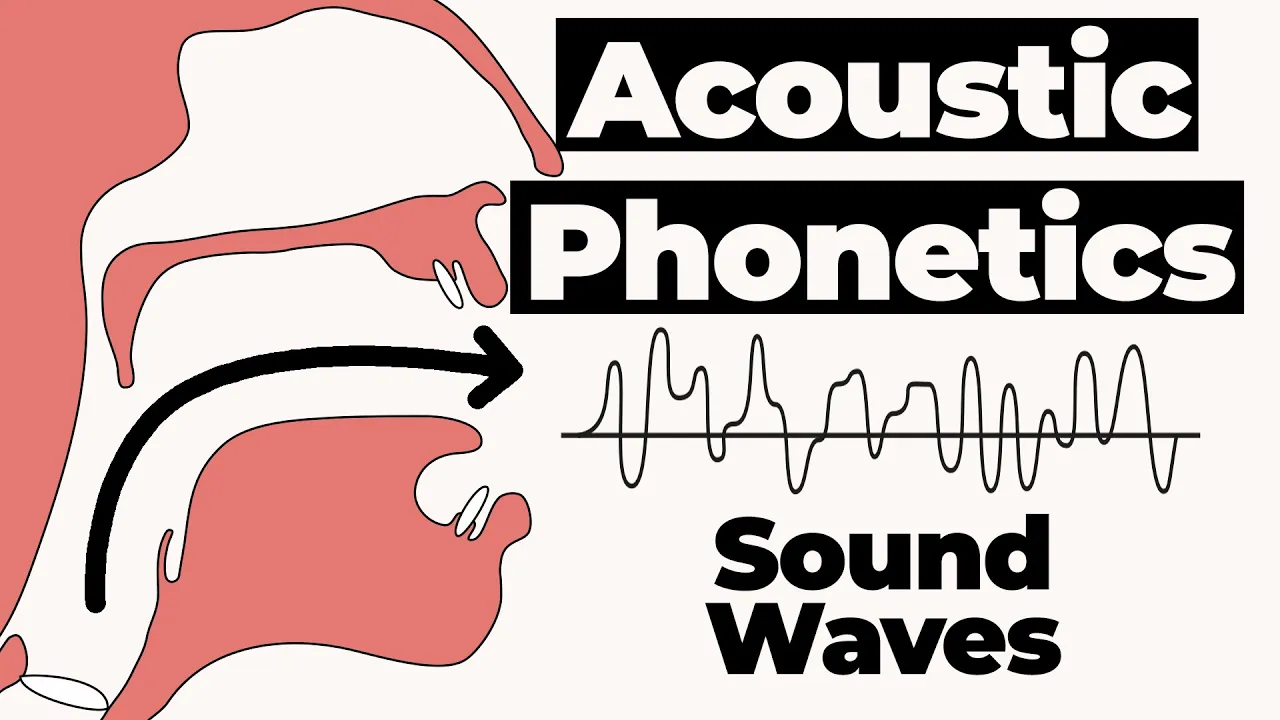
Understanding the Basics of Acoustic Phonetics and Sound Waves
7.7K
Acoustic phonetics studies the acoustic properties of speech sounds, focusing on sound waves characterized by three key properties: frequency (measured in hertz, representing the number of cycles per second), amplitude (maximum displacement from the rest point determining loudness), and duration; these properties are essential for understanding how speech sounds are produced and perceived across different branches of phonetics.
Click to watch →
Deep Dive
Fundamentals of digital audio, such as standard audio file formats (e.g., WAV) and the concept of sampling rate.

Dateiformate für digitales Audio - Workshop/Tutorial (The Soundphile)
8.5K
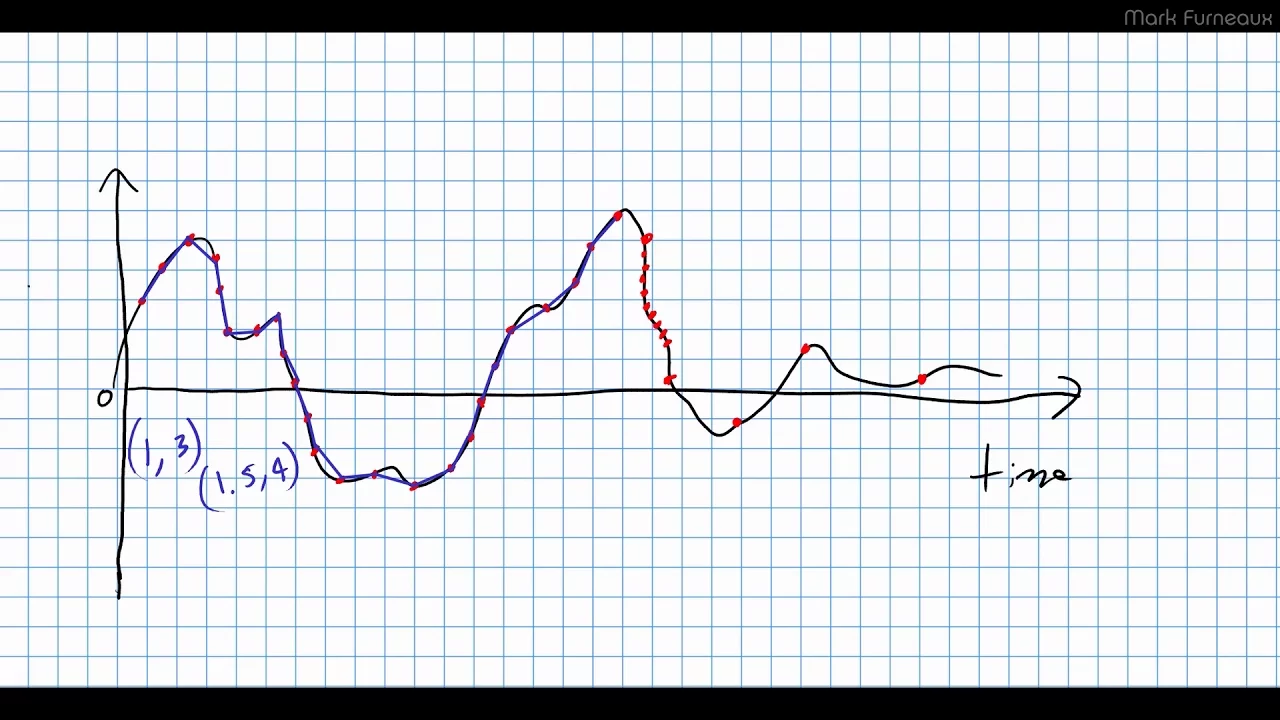
Digital audio converts continuous sound waves into discrete data points through sampling. The sampling rate (44.1 kHz, 48 kHz, 96 kHz, 192 kHz) determines the highest reproducible frequency (Nyquist frequency). Uncompressed formats like WAV and AIFF store data exactly as captured, while compressed formats like MP3 use psychoacoustic models to remove imperceptible data, reducing file sizes by up to 90%. MP3 bitrate (kbps) differs from uncompressed bit depth (bits per sample). Sample rate selection depends on target medium: 44.1 kHz for CD, 48 kHz for video, 96-192 kHz for high-resolution audio.
Click to watch →
Digital Audio: The Basics
21.9K
Sound is a longitudinal wave consisting of compressions and rarefactions that propagate through air. A speaker converts electrical signals into sound through a voice coil (electromagnet) suspended in a permanent magnetic field. Waveform characteristics include frequency (cycles per second, measured in Hertz), period (time for one complete cycle), and amplitude (measured from peak to zero point). The Nyquist sampling theorem states that the sampling rate must be at least twice the maximum frequency to accurately reproduce a signal. Common sample rates are 44.1 kHz (CD standard) and 48 kHz, which can represent frequencies up to 22.05 kHz and 24 kHz respectively. Quantization converts continuous analog values into discrete digital values, with bit depth determining amplitude resolution: 8 bits provides ~48 dB, 16 bits provides ~96 dB, and 24 bits provides ~144 dB. The CD standard uses 44.1 kHz and 16-bit depth with Pulse Code Modulation (PCM) format. Lossless compression (FLAC) reduces file size without data loss, while lossy compression (MP3) permanently removes data for greater compression.
Click to watch →

Digital Audio
103
Digital audio is created through sampling, where continuous sound waves are captured at regular intervals to create digital representations; the Nyquist theorem states that to accurately reproduce sound, the sampling rate must be at least twice the highest frequency (20,000 Hz for human hearing), requiring a minimum of 40,000 samples per second, with consumer audio typically using 44.1 kHz and video audio using 48 kHz. Bit depth determines the number of amplitude values per sample, affecting dynamic range and audio quality. Audio formats include mono (single channel), stereo (two channels), and surround sound (5.1, 7.1, and spatial audio like Dolby Atmos). File formats are categorized as lossy (MP3, AAC, OGG - smaller file size but reduced quality), lossless (FLAC, ALAC - larger but no quality loss), and uncompressed (WAV - highest quality).
Click to watch →
TERNYATA INI CARA SUPAYA MIXINGANMU LEBAR SON !!! ILMU TURUNAN RAJA TERAKHIR
25.1K
Digital audio uses sampling rates (44.1 kHz for CD, 96 kHz for DVD) based on Nyquist Theorem (sampling rate must be twice the highest frequency). Higher rates capture more harmonics for better detail. MIDI records musical data, not audio, while DAWs record actual audio. File formats like WAV and MP3 store digital audio data. Understanding these fundamentals is essential for proper audio production and mastering.
Click to watch →
What Is Audio Sample Rate and How Does It Work? (feat. Ian Stewart) | Inside The Mix #203
550
Digital audio recording involves measuring an analog voltage signal at discrete intervals and storing those measurements as digital numbers. The Nyquist-Shannon Sampling Theorem, developed by Harry Nyquist in the 1930s, establishes that at least two samples per cycle are needed to accurately capture any frequency. Since humans hear up to approximately 20 kHz, the minimum sampling rate should be 40 kHz. However, practical implementation required adding extra bandwidth for filter roll-off, resulting in the 44.1 kHz standard used for CDs. This rate allows for a gentle filter slope that sufficiently attenuates frequencies above 20 kHz while preserving audio quality.
Click to watch →
Deep Dive
Familiarity with the concept of a spectrogram and how it visually represents speech sounds over time.

Spectrogram Demo with Lingthusiasm! Watch and hear sounds /s, f, a, i, u/ explained in real time
2.9K
This video demonstrates how spectrograms make speech sounds visually observable, allowing listeners to move beyond linguistic perception and analyze sounds as pure acoustic signals. When people hear /s/ and /f/ sounds, their brains automatically interpret them as distinct phonemes, which hinders detailed acoustic analysis. The spectrogram provides a visual representation that temporarily disables this linguistic processing, enabling viewers to observe the physical differences between similar sounds. The excerpt shows real-time spectrograms of the sounds /s/, /f/, /a/, /i/, and /u/, revealing their unique frequency patterns over time. This technique helps linguists and learners identify subtle acoustic distinctions that are otherwise imperceptible by ear alone. The video credits ScienceMusic.org for providing a real-time spectrogram tool that users can interact with to see how their own voice produces these sounds. It encourages viewers to explore the tool independently to gain hands-on experience with speech visualization. The video is a short excerpt from Lingthusiasm Episode 64, which focuses on making speech visible through spectrographic analysis, and directs viewers to additional resources for audio-only versions and further reading.
Click to watch →

CSD3084 Spectrogram Basics
22.9K
A spectrogram is a three-dimensional visualization tool that displays speech signals with time on the x-axis, frequency on the y-axis, and darkness (or color) representing amplitude on a dB scale; periodic sounds like voiced speech appear as vertical striations, noise sounds appear as white or light gray areas, and transients appear as brief vertical stripes, with the trade-off between time and frequency resolution determined by the window size used in spectrogram creation.
Click to watch →

Phonetics & Phonology: An Overview (2)
194
A spectrogram is a visual representation of speech signals that displays frequency (vertical axis) and time (horizontal axis), where formants (F1, F2, F3, F4) are peaks of energy that reveal articulatory information: F1 indicates mouth openness (low when mouth is closed, high when open), while F2 indicates tongue advancement (high for front vowels, low for back vowels); vowels show periodic resonances with higher amplitude than consonants, while voiceless consonants appear as noise without formants.
Click to watch →
Step by step through a spectrogram
85.9K
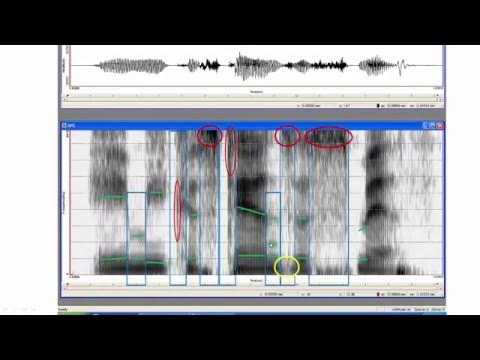
This video demonstrates how to analyze a spectrogram by identifying key acoustic features: formants (dark horizontal bands) indicate vowel quality with F1 representing tongue height and F2 representing tongue advancement; 'crappy formants' (weak, poorly defined bands) indicate sonorant consonants like nasals and laterals; burst releases with energy centered around 2000 Hz indicate velar stops, while energy concentrated above 4000 Hz indicates alveolar fricatives; and even noisy energy distribution across frequencies suggests non-sibilant fricatives like [f] or [θ]. By systematically mapping these acoustic landmarks, one can identify individual speech sounds and reconstruct spoken words from spectrographic data.
Click to watch →

Жуткие Послания Скрытые в Песнях из Мультиков (и не только из мультиков) ► коваленко трунь | Реакция
163.4K
A spectrogram visualizes sound by showing frequency (vertical axis) against time (horizontal axis), with color indicating loudness. Higher resolution captures frequencies beyond human hearing. Any sound can be converted to an image, and any image can be converted back to sound. Artists have used this technology to embed hidden messages in music, creating visual representations of audio that reveal information not audible to the human ear.
Click to watch →
Deep Dive
The general purpose of phonetic transcription and why researchers use specialized software for speech visualization.

REET MAINS 2026 || ENGLISH LITERATURE || PHONETIC TRANSCRIPTION ||BY RAVI ACHARYA SIR
1.4K
Phonetic transcription is studied for three main purposes: (1) Pronunciation - to learn how to correctly pronounce words, (2) Articulation - to understand how to form sounds properly, and (3) Intonation - to learn the rise and fall of voice in speech. It helps learners understand where to pause, how to stress certain words, and how to stretch or shorten certain sounds in English.
Click to watch →
![[Introduction to Linguistics] Phonetics and Basics of Transcription](https://i.ytimg.com/vi/-FHQJEo38Vk/maxresdefault.jpg)
[Introduction to Linguistics] Phonetics and Basics of Transcription
134.2K
Phonetic transcription is necessary because English orthography poorly maps letters to sounds (e.g., 'EA' in 'threat' vs 'meat' makes different sounds). The International Phonetic Alphabet provides unique symbols for each sound that remain consistent across languages. This universal system allows anyone who knows the phonetic alphabet to pronounce any language accurately, solving the problem of inconsistent spelling-to-sound relationships in English.
Click to watch →
Phonetics and Phonology: Introduction
244.3K
Phonetics aims to make speech sounds visible and practical to write down and print. This involves developing systems to describe sounds empirically in scholarly settings, allowing researchers to record, analyze, and share precise information about how sounds are produced and perceived across different languages and speakers.
Click to watch →
How to learn phonetic transcription (with practice! ✏️)
687.7K
The British phonemic chart organizes all vowel and consonant sounds used in British English pronunciation, including monophthongs (single vowel sounds like /e/, /ɑː/, /iː/) and diphthongs (two vowel sounds combined like /eɪ/, /əʊ/, /ɔɪ/). The chart distinguishes voiced sounds (black-and-white) from voiceless sounds (gray) by whether vocal cords vibrate during production. All vowels in English are voiced, meaning there are no voiceless vowel sounds. Phonetic transcription uses specialized symbols enclosed in brackets [ ] to represent spoken sounds. Single-syllable words like 'cat' are transcribed as [kɑːt], while multi-syllable words require stress indicators (ˈ) to show which syllable receives emphasis. Long words with silent letters should be transcribed based on actual sounds, not spelling—for example, 'neighborhood' becomes [ˈneɪbəhʊd].
Click to watch →
AVML 2012: Tyler Kendall -Transcripts Beyond Text: Tools and Techniques for Visualizing
272
Transcription is the primary representation of speech in non-audio format, but it is not theory-neutral—every transcription decision is an active analysis dependent on the transcriber's theories about language and speech. This includes decisions about text layout and encoding nonverbal elements like pauses and overlaps. The presentation introduces visualization methods as a way to re-examine and reimagine transcription, moving beyond text to explore quantitative approaches to discourse analysis and language variation.
Click to watch →
Prerequisite Knowledge
- Concept 01Basic concepts of acoustic phonetics, including sound waves, frequency, amplitude, and duration.
- Concept 02Fundamentals of digital audio, such as standard audio file formats (e.g., WAV) and the concept of sampling rate.
- Concept 03Familiarity with the concept of a spectrogram and how it visually represents speech sounds over time.
- Concept 04The general purpose of phonetic transcription and why researchers use specialized software for speech visualization.
Subsequent Learning
- Step 01How to record, import, and export audio files within the Praat environment.
- Step 02Creating and utilizing TextGrids for phonetic segmentation, annotation, and labeling of speech boundaries.
- Step 03Performing basic acoustic measurements, such as tracking fundamental frequency (pitch/F0), formants, and intensity.
- Step 04Utilizing the Praat Picture window to draw, customize, and export high-quality, publication-ready spectrograms and waveforms.
- Step 05An introduction to basic Praat scripting for automating repetitive acoustic analysis tasks across multiple audio files.
Interface Overview
Editor Features
Playback Method
Section Analysis
Visual Data
Interface Overview
0:04Playing Section
- 1
Pratt opens with two windows: object list and picture window.
- 2
New sound files appear in the objects list with dynamic menus.
Programmatic Workflows and Modern UI Alternatives in Speech Analysis
While Praat is a foundational tool in phonetics, its graphical user interface (GUI) is frequently criticized for being outdated, unintuitive, and encouraging manual, non-reproducible workflows. Critics and modern researchers increasingly advocate for programmatic alternatives, such as using Python (via libraries like Parselmouth or librosa) and R (such as emuR or wrassp). These code-based approaches allow for automated, reproducible, and scalable batch-processing pipelines—scientific standards that are difficult to achieve through Praat's manual point-and-click interface. Additionally, contemporary web-based speech annotation and visualization tools offer superior collaboration and user experiences, suggesting that learning Praat's legacy interface may not be the most efficient path for modern data science-aligned linguistic research.
Deep Dive
How to record, import, and export audio files within the Praat environment.
Video 1 - Como grabar y guardar audio en Praat
269
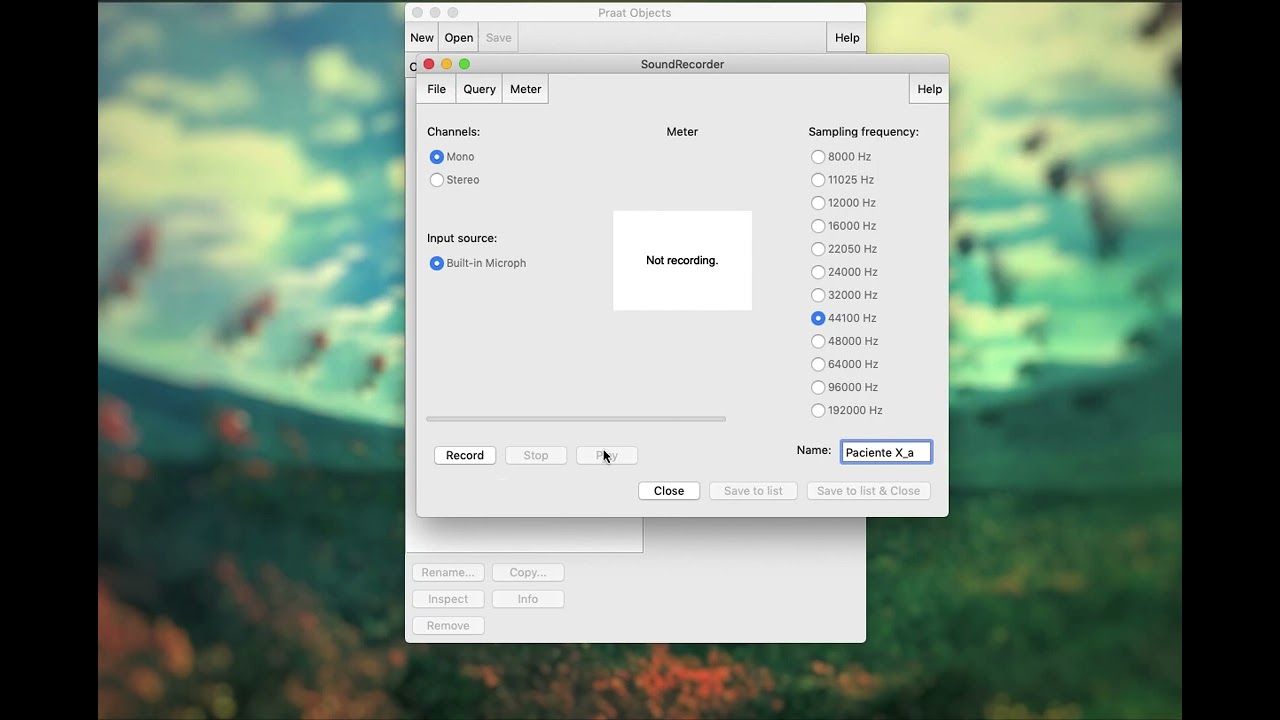
To record audio in Praat, open the program, click the icon to access the recording window, select 'Record Mono' with mono channel and 44,100 Hz sampling frequency, name the sample with patient and sample information, start recording before the patient produces sound and stop after they finish to avoid false attack/release artifacts, then save the file as a WAV format in a dedicated patient folder for later analysis.
Click to watch →

Spectrogram Analysis and Vowel Formants in Praat Tutorial
237.2K
Praat is free and open-source software designed for phonetic analysis that can create spectrograms by loading audio files or recording directly through the program. The interface consists of two main windows: a control panel on the left listing recordings and a viewing/printing window on the right. To record, go to 'New' > 'Record mono sound' with a default sampling rate of 44,100 Hz. After recording, save the file and click 'View and edit' to display the waveform and spectrogram.
Click to watch →

Praat zur Stimmanalyse in der Logopädie/Sprachtherapie - Teil 1: Basics
1.4K
This comprehensive section covers the entire process of downloading, installing, and using Praat for audio recording and management. First, visit praat.dutch-linguistics.org and navigate to the Download section. For Mac users, click Macintosh to access the download page; for Windows users, click Windows and select the 64-bit edition. After downloading, extract the ZIP file by double-clicking or using Extract All, then launch Praat. The interface consists of the Object Window (left) for recording and loading files, and the Display Window (right) for visualizations. Before recording, adjust buffer size under Preferences: 60MB for 2 minutes, 200MB for 20 minutes, 400MB for 40 minutes. To record, select New > Record Monosound, choose Mono or Stereo, set sampling frequency, and click Record. During recording, level indicators show green (good), yellow (borderline), or red (oversteering). Stop recording with Stop, play with Play, and name the file. Save recordings by clicking Save to List, then use the Save tab to save as Wav File (non-compressed, compatible with other programs). To open existing files, use Open > Read from File (Praat cannot open MP3 files). Manage files using Rename, Copy, and Remove buttons.
Click to watch →
Praat functions - #1-10
9.4K
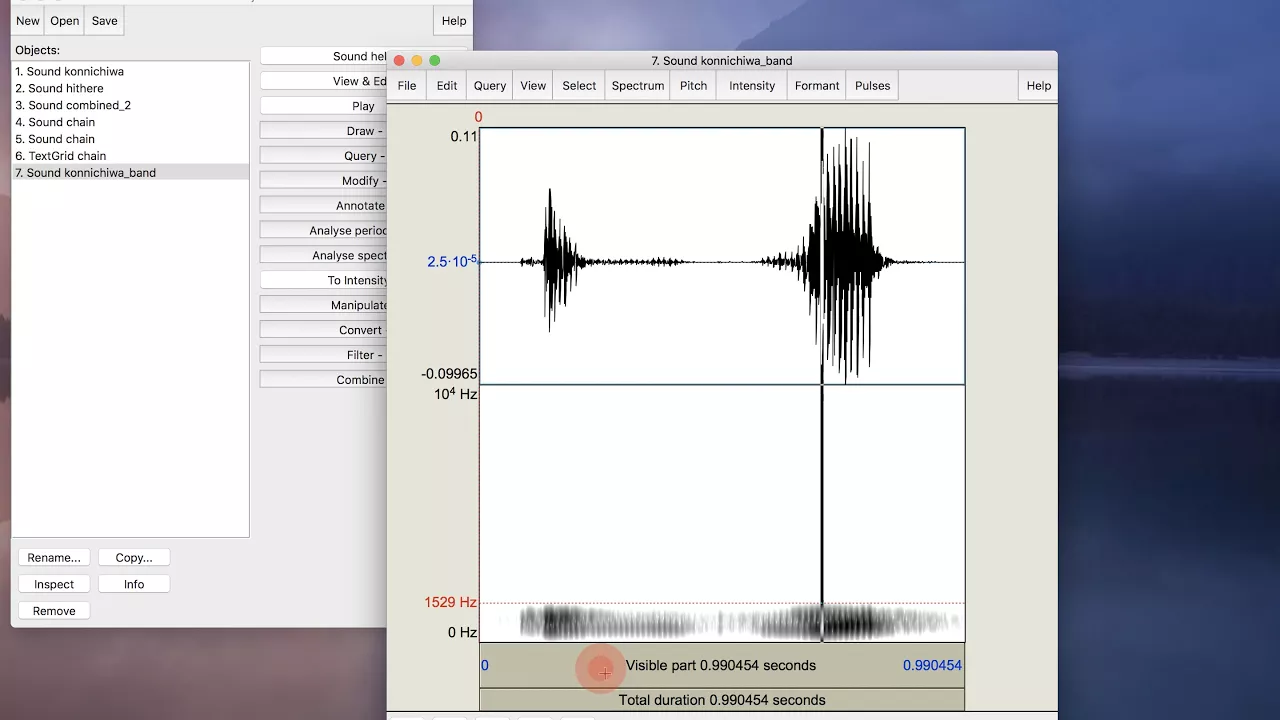
This section covers fundamental audio operations in Praat: recording mono sounds, renaming files, trimming silent parts using Edit menu or command X, combining sounds to stereo (placing each sound in separate channels), and concatenating files in timeline fashion. The recoverable concatenate option creates both sound and text grid objects for editing. These operations form the foundation for audio processing workflows.
Click to watch →

Tutoriel Praat: prof V.Delvaux
3K
Praat is a free, open-source speech analysis software available for Windows and Mac. The interface consists of two main windows: the left 'Praat Objects' window manages audio files and objects, while the right 'Praat Pictures' window displays visualizations. To record audio, click 'New' then 'New Sound', select 'Mono' for single-track recording, choose the appropriate audio source, and monitor the level meter during recording to prevent saturation. Existing audio files can be opened using the 'Open' function. Audio objects can be manipulated through filtering, noise reduction, and various modifications. To visualize audio, select a sound object and click 'View' then 'Show Waveform'. The waveform window displays time on the horizontal axis and amplitude on the vertical axis. The bottom panel shows the spectrogram, displaying frequency content over time. Users can zoom in/out, select portions of the signal, and play different parts by clicking on the waveform. Spectrogram settings can be adjusted through the Settings menu, including frequency range, contrast levels, and color mapping. The Pitch menu displays fundamental frequency (F0) in blue, adjustable to show different frequency ranges. The Intensity menu displays loudness in yellow, which is highest during vowels and lower during consonants. The Formant menu displays the first four formants (F1-F4) representing vocal tract resonances. The Voice Report feature detects glottal pulses (vertical blue bars) representing cycles of fundamental frequency, enabling calculation of voice quality measures including jitter and shimmer. TextGrid is Praat's annotation system for creating layered linguistic annotations overlaid on audio files. Each layer (called a 'tier') can contain intervals marked by boundaries. Users can create multiple tiers for different annotation types such as words, phonemes, or other linguistic categories. Praat scripts are text files containing commands that automate sequences of operations in Praat. They are designed for advanced users who need to perform repetitive analyses efficiently. Scripts can automate measurements, data extraction, and analysis procedures by combining multiple operations.
Click to watch →
Deep Dive
Creating and utilizing TextGrids for phonetic segmentation, annotation, and labeling of speech boundaries.
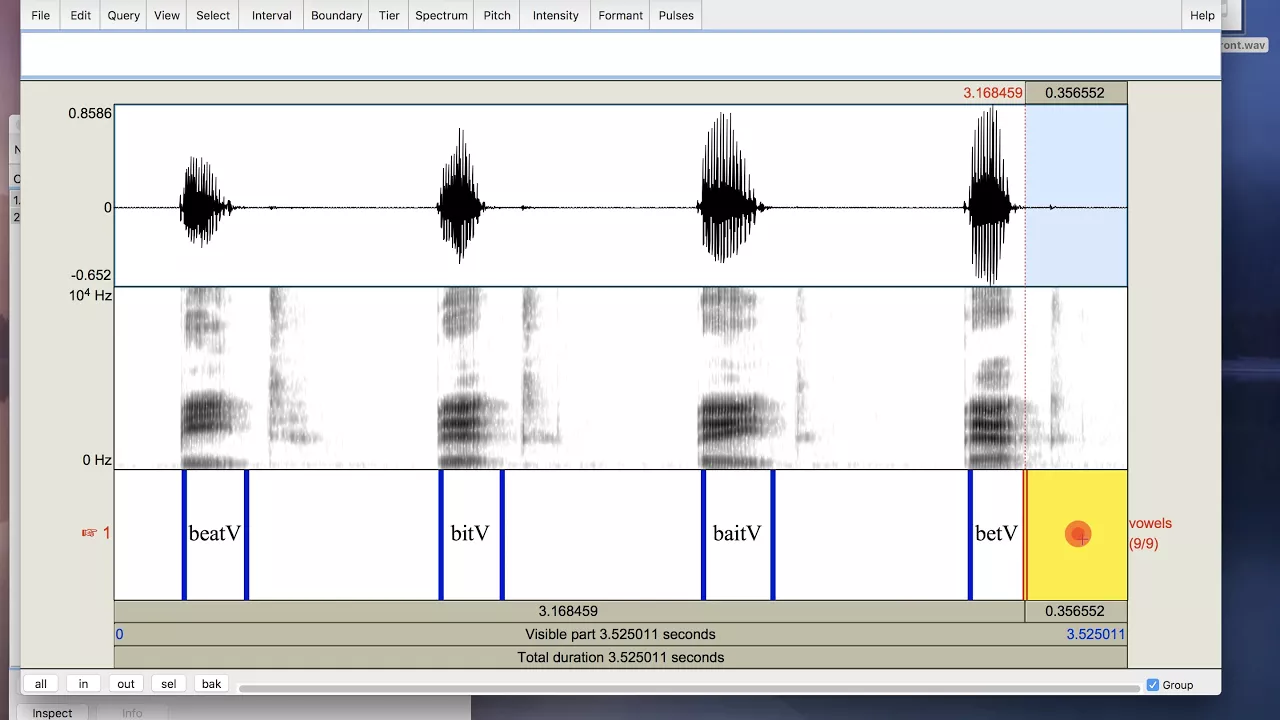
TextGrid_Script
2K
This tutorial demonstrates how to create and annotate TextGrids in Praat for phonetic analysis, including setting up tiers (such as a 'vowels' tier), adding boundaries to define intervals, labeling sound segments, and saving the annotation as a .textgrid file that can be queried programmatically to extract timing and labeling information.
Click to watch →
Praat Tutorial: 3. Annotations
29.9K
In Praat, text grid objects enable phonetic annotation through two tier types: interval tiers for time periods and point tiers for single points; to create one, select the sound file and text grid sample together, then use the view/edit function to set boundaries by clicking on gray circles at interval start/end or selecting audio sections, with IPA symbols accessible via the help menu for precise phonetic labeling.
Click to watch →

PRAAT textgrid demo
29.6K
This video tutorial demonstrates how to create TextGrids in PRAAT software for annotating phonetic data, covering the essential steps including configuring Praat settings (spectral range 0-5000 Hz, dynamic range 50 dB, pitch range 70-250 Hz, intensity range 40-100 dB), setting up three tiers for word, gloss, and phonetic transcription annotations, creating boundaries by clicking on waveform positions, and adding IPA symbols including primary stress marks using command codes; the complete workflow involves opening sound files, configuring analysis settings, creating text grid tiers, placing boundary markers at word boundaries, and entering annotations in each tier before saving the file.
Click to watch →

Create Textgrid Using Praat Script - HKBUPhonLab.Ep.14
2.7K
This tutorial demonstrates how to use Praat scripts to efficiently annotate multiple sound files by creating textgrids with tier structures, allowing users to mark phonetic boundaries (such as consonant-vowel divisions) and save annotations while supporting resumption of work if interrupted.
Click to watch →

Praat: Text grid and IPA
8K
This tutorial demonstrates how to create a text grid in Praat software, select audio segments, add intervals, and label sounds using IPA (International Phonetic Alphabet) characters, then save the annotated spectrogram and sound file for publication on a WordPress blog.
Click to watch →
Deep Dive
Performing basic acoustic measurements, such as tracking fundamental frequency (pitch/F0), formants, and intensity.
![[음성학] 기본주파수 측정(Fundamental frequency measurement) PRAAT](https://i.ytimg.com/vi_webp/pHQfoPOUZ1o/maxresdefault.webp)
[음성학] 기본주파수 측정(Fundamental frequency measurement) PRAAT
3.5K
Fundamental frequency (F0) is the primary acoustic correlate of pitch, measured as the number of vocal fold vibrations per second (in Hz), where adult males typically range from 75-300 Hz, adult females from 100-500 Hz, and children from 200-600 Hz; this measurement can be performed using PRAAT software by loading audio files, converting stereo to mono, setting appropriate pitch range parameters, and applying cross-correlation analysis to extract the pitch contour and calculate statistical measures such as median, mean, and standard deviation.
Click to watch →
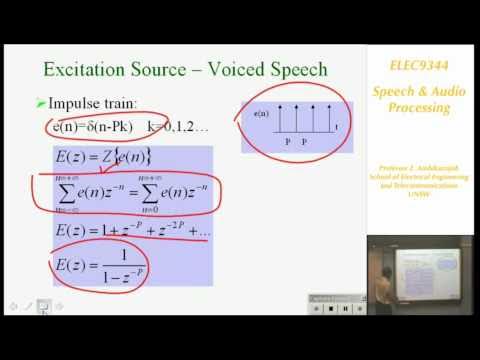
Speech and Audio Processing 1: Introduction to Speech Processing - Professor E. Ambikairajah
140.6K
Pitch period is the time between vocal cord closures; fundamental frequency (F0 = 1/T) distinguishes speakers: males 50-200 Hz, females 150-300 Hz, children higher. Formants are resonant frequencies of the vocal tract, appearing as spectral peaks below 4 kHz (typically 3-4 formants). Voiced spectra show harmonic structures with low-frequency energy; unvoiced spectra display flat or rising characteristics with enhanced high frequencies. Telephone systems limit bandwidth to 0-4 kHz, sufficient for intelligibility since critical formants fall within this range. These acoustic features enable the brain to identify phonemes and understand speech.
Click to watch →
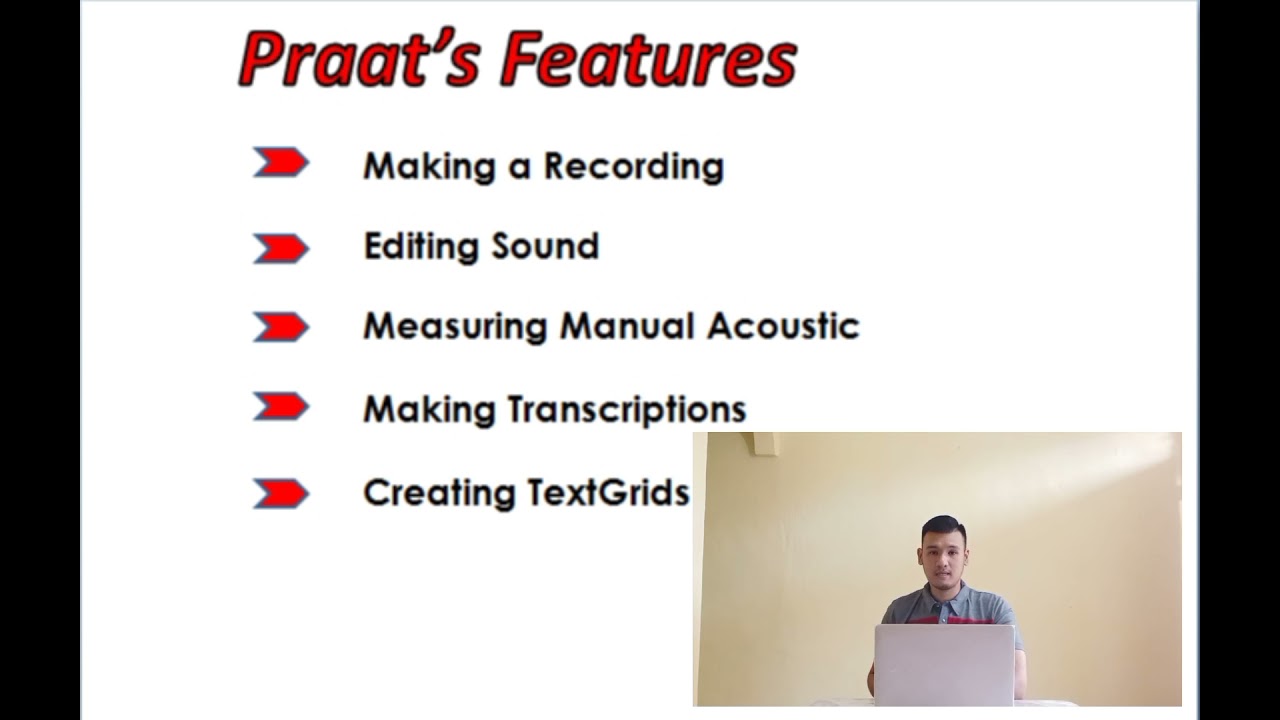
Introducing Praat: Doing Phonetics via Computer
574
Praat enables manual acoustic measurements of three key phonetic characteristics within the sound editor window: (1) Pitch - the fundamental frequency of the voice; (2) Intensity - representing amplitude, volume, and loudness levels; (3) Formants - frequencies that resonate particularly strongly due to the tongue's position in the mouth, creating resonating chambers. These measurements allow researchers to quantitatively analyze speech sounds and their acoustic properties.
Click to watch →
Spectrogram Analysis and Vowel Formants in Praat Tutorial
237.2K
There are two common ways to measure formant frequencies in Praat. Method 1: Click on a formant to draw a horizontal line at the cursor location and mark the frequency value. Method 2: Turn on the formant tracker by going to Format > Show Formants, highlight the vowel portion you want to measure, then go to Formant > Get First Formant (or press F1 key) for F1 values and similarly for F2 values. The formant tracker method is more accurate than clicking manually.
Click to watch →

PRAAT 4 Getting help with formants and f0
9.7K
PRAAT's pitch tracking feature displays blue lines over what it identifies as voice sections of the speech signal and plots the fundamental frequency (F0) values. When users click on specific points along the pitch trace, PRAAT displays the estimated F0 value in Hertz on the right-hand side. For example, clicking on different points might show readings such as 118 Hz, 104 Hz, or higher values depending on the pitch contour of the speech segment.
Click to watch →
Deep Dive
Utilizing the Praat Picture window to draw, customize, and export high-quality, publication-ready spectrograms and waveforms.

PRAAT 8 Saving pictures 1
4.8K
This video tutorial demonstrates how to create professional spectrogram and waveform images in PRAAT software for linguistic analysis. The process involves creating spectrogram objects through Spectrum > Spectrogram, adding them to the PRAAT picture window, customizing frame shapes, and adding frequency markers (e.g., 1000 Hz intervals) and time markers (e.g., 0.1 second intervals). Users can add waveforms below spectrograms, draw dotted lines at specific frequencies, and save the final image as a PDF file for inclusion in documents. This method provides greater control over image appearance compared to simple screenshots.
Click to watch →

Drawing Images in Praat - HKBUPhonLab.Ep.13
327
This tutorial demonstrates how to draw audio visualizations in Praat software, including waveforms (by selecting a sound and clicking Draw), spectrograms (by extracting visible spectrogram and painting it), and combined waveform with annotation (by selecting both sound and text grid together), with options to save images as PNG files and adjust their size and shape.
Click to watch →
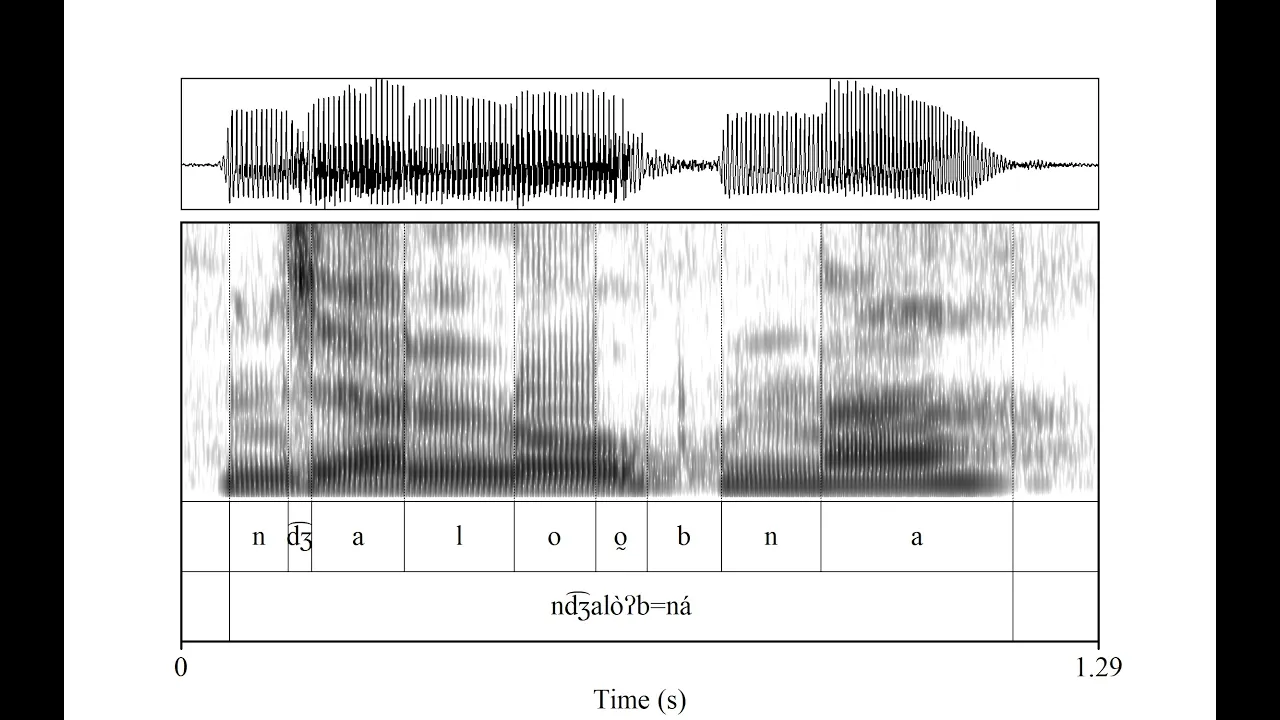
Cómo hacer espectrogramas presentables en PRAAT
1.7K
This tutorial demonstrates how to create professional-looking spectrograms in Praat software by configuring display settings, drawing precise regions with specific dimensions (8 units long, 2 units high), applying spectrogram parameters (1-8 Hz frequency range, 4.5-5.5 dB amplitude range), and exporting the final image as a PNG file for inclusion in academic documents.
Click to watch →
Spectrogram Analysis and Vowel Formants in Praat Tutorial
237.2K
Praat is free and open-source software designed for phonetic analysis that can create spectrograms by loading audio files or recording directly through the program. The interface consists of two main windows: a control panel on the left listing recordings and a viewing/printing window on the right. To record, go to 'New' > 'Record mono sound' with a default sampling rate of 44,100 Hz. After recording, save the file and click 'View and edit' to display the waveform and spectrogram.
Click to watch →

Praat 21 - Draw spectrogram in R (using Praat output)
3.1K
This tutorial demonstrates how to export spectrograms from Praat as text files and visualize them using R with ggplot2, providing fine control over image aesthetics, coloring, labeling, and resolution for scientific publications. Key steps include configuring Praat spectrogram settings (window length, time step, frequency step), pre-emphasizing the spectrogram to enhance high-frequency visibility, constraining dynamic range, and applying logarithmic frequency scaling for perceptual accuracy. The workflow enables researchers to create publication-quality spectrograms with phoneme-specific color coding and customizable color schemes.
Click to watch →
Deep Dive
An introduction to basic Praat scripting for automating repetitive acoustic analysis tasks across multiple audio files.

Prep06: Praat scripting
541
Praat scripting enables efficient batch processing of multiple audio files by recording GUI operations into scripts, allowing users to automate repetitive tasks like pitch analysis across entire corpora; scripts can be created interactively by recording mouse actions, saved with .praat extensions, and executed either within Praat's GUI or from the command line, with Praat's scripting language supporting basic programming constructs such as loops, conditionals, and variable handling for processing operations on sound and pitch objects.
Click to watch →
إزاي تبدأ البرمجة في Praat؟ أول سكريبت ليك خطوة بخطوة | مقدمة للمبتدئين
378
Praat Script is an automated tool that performs the same audio analysis functions as manual Praat software, offering significant advantages including time efficiency when processing multiple files, consistent and accurate results without human error, and accessibility for beginners without programming experience. The video demonstrates how to write a simple Praat script that displays 'Hello Praat!' using the Info Line command, explaining that text strings must be enclosed in quotes and that the Run Selection command allows executing only selected portions of code.
Click to watch →

E1: What is Praat? (Beginner’s Guide to Acoustic Analysis for Speech & Voice)
278
Praat is a free software program that converts audio signals into visual representations (waveforms and spectrograms), enabling linguists and clinicians to measure acoustic properties like pitch, loudness, and formants to analyze speech patterns, identify voice disorders, and study phonetic variations across languages.
Click to watch →

SLHS 1301 class (10/20) - getting started with praat
5.8K
Praat is a widely-used software for speech and sound acoustics analysis across Linguistics, Phonetics, Hearing Sciences, Music Science, Psychology, and Computer Science. Students must download it from pr.org, selecting their operating system (Windows, Mac, or Linux). Audio files for Praat exercises are available in the course Canvas portal under the 'Pro' folder. Students should download all audio files simultaneously by holding Shift key while clicking to select multiple files, then using the download button. Standardized audio files ensure consistent analysis across all students, enabling meaningful cross-comparison of results without voice-specific variations that could confound interpretations.
Click to watch →

Praat script: How to write comments and declare variables - كيفية كتابة التعليقات وتعريف المتغيرات
124
In Praat scripting, comments are written using the hash symbol (#) at the beginning of a line to indicate that the code should be skipped during execution, while variables are containers for storing data with two main types: numeric variables (storing numbers) and string variables (storing text), where variable names must start with a lowercase letter and string variables must end with a dollar sign ($) and be enclosed in double quotes.
Click to watch →
Interface Overview
Editor Features
Playback Method
Section Analysis
Visual Data
Interface Overview
0:04- 1
Pratt opens with two windows: object list and picture window.
- 2
New sound files appear in the objects list with dynamic menus.
Programmatic Workflows and Modern UI Alternatives in Speech Analysis
While Praat is a foundational tool in phonetics, its graphical user interface (GUI) is frequently criticized for being outdated, unintuitive, and encouraging manual, non-reproducible workflows. Critics and modern researchers increasingly advocate for programmatic alternatives, such as using Python (via libraries like Parselmouth or librosa) and R (such as emuR or wrassp). These code-based approaches allow for automated, reproducible, and scalable batch-processing pipelines—scientific standards that are difficult to achieve through Praat's manual point-and-click interface. Additionally, contemporary web-based speech annotation and visualization tools offer superior collaboration and user experiences, suggesting that learning Praat's legacy interface may not be the most efficient path for modern data science-aligned linguistic research.
Basic concepts of acoustic phonetics, including sound waves, frequency, amplitude, and duration.
Fundamentals of digital audio, such as standard audio file formats (e.g., WAV) and the concept of sampling rate.
Familiarity with the concept of a spectrogram and how it visually represents speech sounds over time.
The general purpose of phonetic transcription and why researchers use specialized software for speech visualization.
How to record, import, and export audio files within the Praat environment.
Creating and utilizing TextGrids for phonetic segmentation, annotation, and labeling of speech boundaries.
Performing basic acoustic measurements, such as tracking fundamental frequency (pitch/F0), formants, and intensity.
Utilizing the Praat Picture window to draw, customize, and export high-quality, publication-ready spectrograms and waveforms.
An introduction to basic Praat scripting for automating repetitive acoustic analysis tasks across multiple audio files.
60.7K views506likes1:39@linguistiklaboralbert-ludw3514Original Release: 2019-01-30
when we open Pratt will see two windows the main object window and the picture window when we open or record a new sound file we will see it in the objects list and we will also find the dynamic menu if we click the view and edit button Pratt will open this sound editor window in the sound editor window we find the menu bar the waveform of the audio we just opened the spectrogram the plate duration bars and the zoom buttons to hear the sound we can click at the beginning of the webform and press tab or click one of the plate duration bars please count Stella ask her to bring these things with her from the store in order to analyze a section of the sound we can select the desired area and click on the selection button please count them Pratt can give us visual information such as formant pitch and intensity
Up Next
8:57
Gimbal vs Handheld: Mastering Cinematic Camera Movement
@jacques_crafford
375.4K views•2023-02-28

12:54
Triumph of Orthodoxy Icon: Byzantine Art & History Explained
@BenCallan
2.1K views•2024-08-06

9:49
FastAPI vs Flask vs Django: Choosing the Right Python Web Framework
@TechWithTim
302.5K views•2024-05-26

1:42
Game of Thrones Opening Credits: A Cinematic Analysis
@gameofthrones
46.3M views•2011-04-18
Related Study Plans & Knowledge Roadmaps
Structured learning paths in General & Interdisciplinary Studies
general-studies
Elevator Engineering: History, Physics & Cities
01From Hoists to Safety Brakes: The Dawn of Vertical Lift
02Hydraulic vs. Traction: The Engineering Physics of Elevators
03Modern Speed, Safety, and Algorithms
+ 2 more learning modules
12h5 modules
Explore Roadmap
general-studies
Rubber: Material Science, History & Geopolitics
01Origins of Natural Rubber & Mesoamerican History
02The Chemistry of Natural Rubber & Vulcanization
03The Geopolitics of the Rubber Boom & Colonization
+ 2 more learning modules
12h5 modules
Explore Roadmap
general-studies
Containerization: Evolution, Logistics & Trade
01Ancient Trade & Bulk Cargo: Amphorae to Barrels
02The Industrial Revolution & Cardboard Packaging
03The Containerization Revolution: Malcom McLean
+ 2 more learning modules
12h5 modules
Explore Roadmap
general-studies
Textile Tech: Evolution, Labor & Global Impact
01Pre-Industrial Textiles: Handloom & Cottage Industry
02Mechanization: The Spinning Jenny to the Power Loom
03The Factory System & Global Labor Transformation
+ 2 more learning modules
10h5 modules
Explore Roadmap