










![[APCTP LECTURE] Delta N formalism in cosmological perturbation theory (2) |Prof. Misao Sasaki](https://i.ytimg.com/vi/pyTpsbDNHnI/maxresdefault.jpg)







The gravitational wave background from supermassive black hole binaries is determined by the black hole mass function, which follows a power-law distribution with a peak around 3×10^9 solar masses; the energy density of gravitational waves emitted by these binaries scales with mass to the 5/3 power, creating a characteristic spectrum that can be constrained by pulsar timing array observations and compared against astrophysical predictions derived from galaxy counts and the M-sigma relation.
Gravitational Wave Sources: Signals from Supermassive Black Holes & Inflation | IAS School
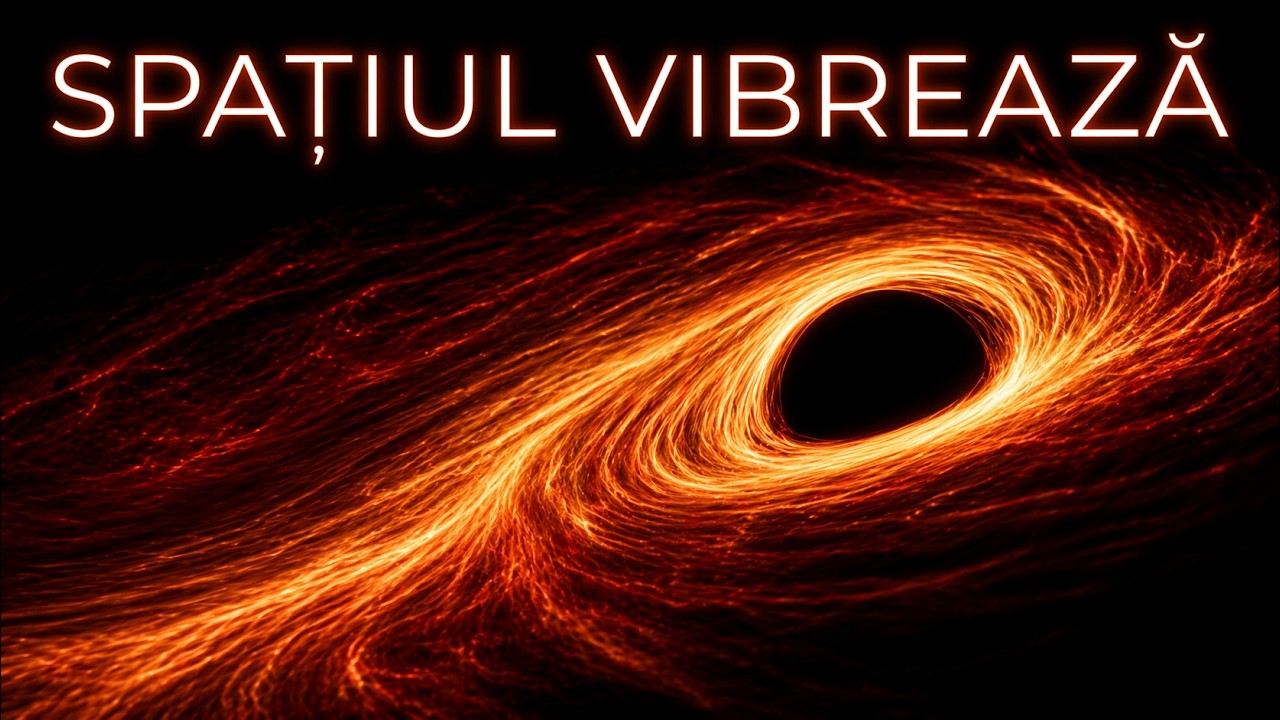
Added:Basic principles of General Relativity, specifically how mass-energy deforms spacetime and generates gravitational radiation.
The physics of cosmic inflation and the origin and characteristics of the Cosmic Microwave Background (CMB).
Fundamentals of observational astrophysics, including how pulsars function as highly stable celestial clocks.
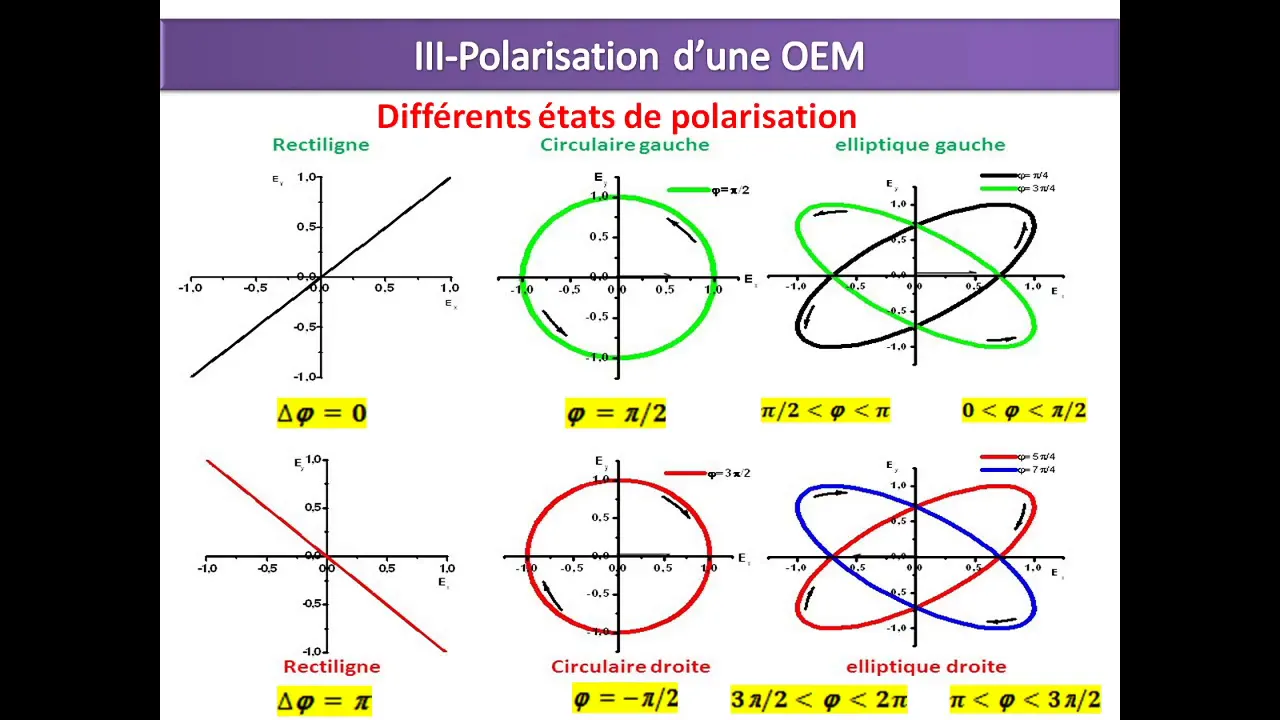
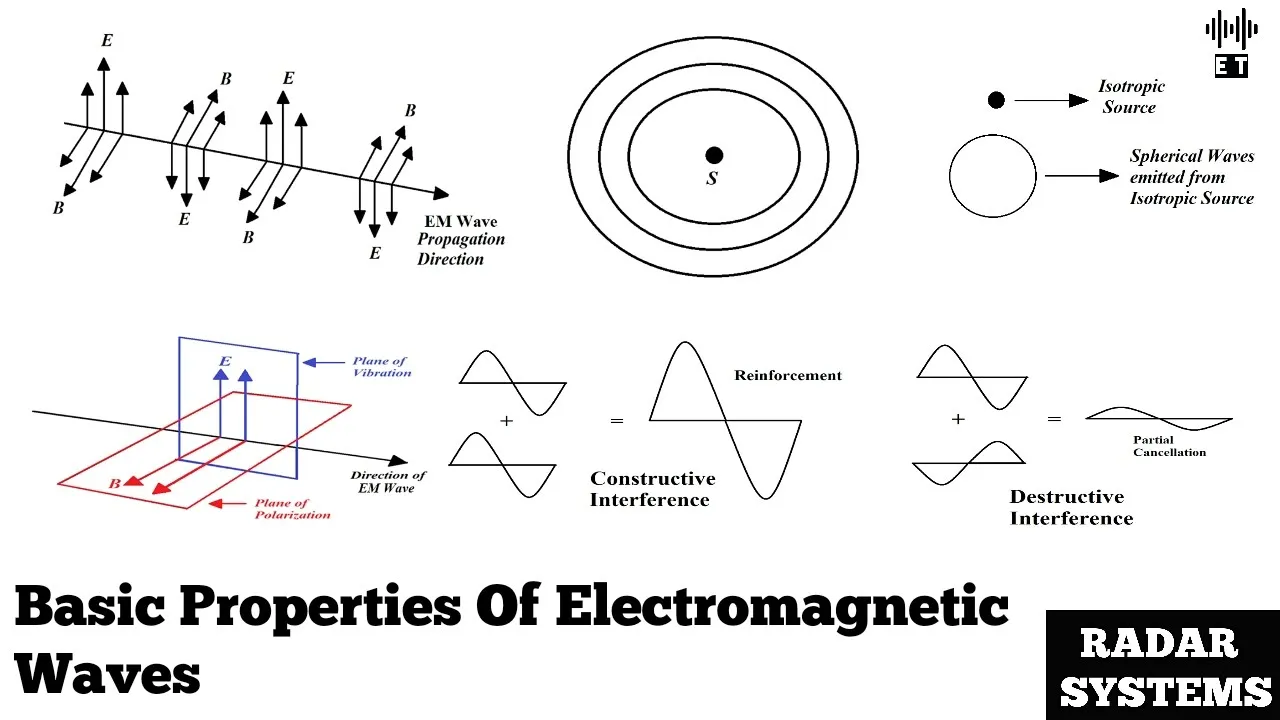
Concepts of wave polarization, particularly how it applies to electromagnetic radiation and cosmic background radiation.
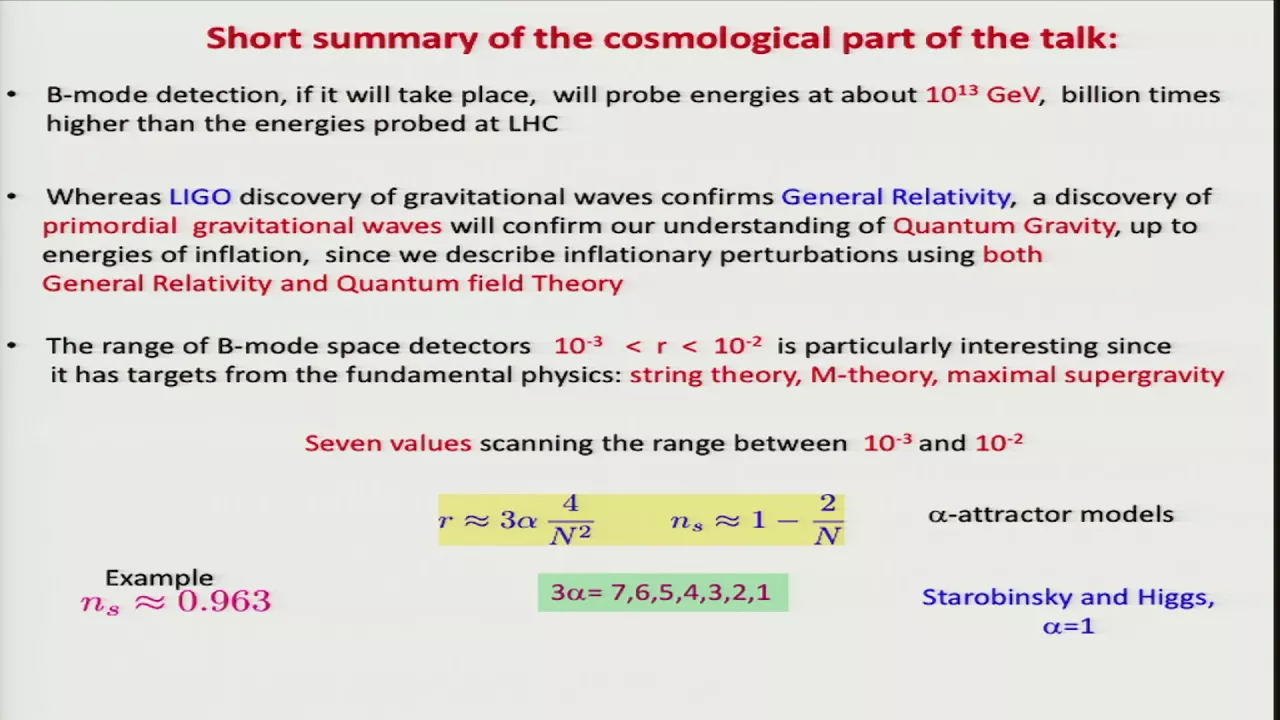
Advanced analysis of CMB B-mode polarization data from experiments like CMB-S4, LiteBIRD, and BICEP/Keck to constrain inflationary models.
Theoretical modeling of the Stochastic Gravitational Wave Background (SGWB) generated by supermassive black hole binaries.
Multi-messenger astrophysics, focusing on the synergy between pulsar timing arrays (PTAs) and electromagnetic observations of active galactic nuclei.
High-energy physics and string theory implications on early-universe cosmology and primordial gravitational wave generation.
501 views13likes1:30:18Original Release: 2025-07-16
Okay. So yesterday I was uh talking to you a little bit about uh what one might expect astrophysically from um u as the source of uh the background that PTAs have observed. And so uh that's the that's the subject of one of the problems that uh associated with my lectures. And so um what I want to do first is to recap a little bit uh what I said before and also highlight some of the things that you will be asked to do in this problem so that uh you know when you do it if if you care to do so you you you pick on the on those things.
Okay. Why why those are interesting and why we were asking you to do those. So what I said was that um um last time was that a good way to get an estimate of what you might expect for the background of gravitational waves as to look at the black super massive black holes in galaxies. try to count them and because the amplitude of the gravitational wave background or I was I think using um the energy density in the gravitational wave background in some frequency range there's some estimate that you can do by counting the number of black holes of a given mass then the amount of energy being put out in a given so this is the number density of black holes number black holes per moving mega part parse per per mass. Um and the amount of gravitational waves that on average that these binaries put out as they cross a given frequency range is proportional to the mass to the 5/3.
I mean there are some factors of the of the mass ratio of the binary and so on but um that's uh it's proportional to this. Similarly the mass density obviously of black holes that's just given by some integral uh same kind of integral just with the mass here. Okay.
And to get this estimate, a a good way to do so uh was to just count galaxies, associate the black holes, uh the mass of the black holes in those galaxies by um using the m sigma relation and then assume that at some point in the history of the universe, those black holes merged at least once and that gives you a good uh an estimate along these lines for the background. Okay. So um so if you look at this um okay you can uh use some canonical uh numbers for this uh black hole mass function. This fi uh of m black hole is called the black hole mass function.
Um and it will look something like this. Um this is uh some sort of log plot and the reason it will look like something like this is that um this is basically one to one mapping with the count of the number of galaxies as a function of their velocity dispersion or something like that. Uh and uh you know there's some sort of power law in the distribution of galaxies in one of these properties. But then by the time you get to very big galaxies uh event which have very high velocity dispersion and as a result very big black holes there are not that many of them in the universe structure forms hierarchically. So smaller things from first and there's the mag the biggest things that have been able to form in the history of the universe until this point and so there's a big cut off in the number of galaxies as a function of their sizes and those are the ones that host the biggest black holes and so the black hole mass function will look something like that and uh if you are interested in one of those integrals like this um the integrant how much gravitational wave energy you get from a given black hole uh black holes of a given mass range it will be given by this multiply by say m to the 5/3 if you want to the gravitational wave background. So this curve either of them will both will look like that for the integrant for black hole mass or the gravitational wave background here. So this again m of the black hole and here's the integrant.
So that tells you when uh integr whatever uh it will look something like this. Here the the contribution will be very small from very very heavy black holes because they are extremely rare.
They have there there hasn't been enough time in the universe to form big galaxies that could host those black holes um if they follow this migma relation. And here because even though there might be a lot of galaxies, smaller galaxies are more numerous that uh uh increase in the density is not so rapid that would uh compete with this m to the 5/3. So the smaller binaries emit much much less energy in a given frequency band. And so um and so this will kill this part of the internet. Okay. So >> yeah, what's the power of this?
The u the power law of the of the um of the mass function of galaxies is sigma to the um so five the number density of sigma maybe sigma to the minus one or something like this. Um so it's very very kind of constant and um yeah d log sigma is the same as d log m so it's very very flat.
Yeah, something like this.
only uh no five * m goes so I'm usually maybe I want to plot d log m and then it becomes uh this is really um the inte it's a log plot so um anyway in the lo log plot it looks like this very much uh uh so this integrated dlog m it looks like Um okay.
Um and the and this uh peak for the integrant of uh the gravitational wave background is something like 3 * 10^ the 9 solar masses.
Okay. Um um blah blah blah. What else do I want to say? Okay. So uh um so maybe I mean I'm I'm saying like this but we usually are doing like this and uh maybe so all of these things are in log log plots. So um that's more more useful. Um okay so um what else do I want to say about this?
Um so um for the most part in any astrophysical scenario like this what you what you are trying to then uh what what may be the first thing that you would try to learn from these observations is how many black so we can count them some way and then we want to see if from the gravitational wave measurements we can get a consistency check or make some uh determination also about this black hole mass function.
Okay. Um to try to learn about the origin of these black holes for example.
Um and so the the low if you want to describe this basically there's some sort of normalization of this curve that you want to know about like how many black holes there are. And then there might also be a location of this break.
What is the the place of this peak?
Okay, those are the two lowest uh order things that you might want to um use to describe what's going on here. Um and uh you know you could then try to um and another parameter would be the width of this thing and so on. At the moment the with the data that we have that's not uh something you can say very much about for um so let's just stick for the for these lectures to trying to describe something about the normalization and where this peak is okay um so or equivalently you want to say maybe I want to uh use as two parameters to describe this the mass density in black holes which we maybe we can estimate some other way using the zultan argument and the peak mass. Well, one the peak mass and instead of a normalization for this five some sort of you know five star normalization just row of the black holes. How much mass density in black holes there are and uh and um what is the peak the peak contribution of these black holes? Uh what is it? I mean if you put canonical numbers is 10 to the 9 but perhaps the answer is slightly different. Okay. So um so maybe your model will be that there is some peak mass that contributes and there is the row of the black hole and as I was saying the canonical numbers um would give you something like this. Let me divide by some raw black holes star which is whatever I get when I plug in the canonical numbers the the density of of galaxies from Sloan and the n sigma relation just the standard one that people like to use so here is one okay and here is like 3 * 10^ the 9 and this will be some sort of log log plot this is kind of the prediction astrophysical prediction if everything is the canonical and the error of the size of the ellipses from some sort of canonical guesstimate just from whatever the observations are of the counting of galaxies and the m sigma relation what dominates the size of those things is uncertainties in the m sigma relation now um if uh I try to if I convert the black hole uh the measurements from the PTA into um into this one kind quantity I have some estimate from the gravitational background of something like this okay of this quantity with the correct prefactors and so on so um so there's a measurement of that and um this in terms of these two parameters I could get the same background of gravitational wave by changing the peak ma if I fix this I can change the peak mass to change the amp answer because they depend on different powers of the m black hole. So if I shift the the up and down both if I shift five up and down both of them go up together but if I shift the uh peak mass uh the shape of this so that the peak contribution changes those two things will change in different ways. So um there is some line here where you get always you get the same uh amplitude of gravitational waves if you um you can um you can dec you get the same amplitude of gravitational wave as you follow this line because for example you you decrease the as you follow this line you decrease the row black holes but so let's say the normalization you decrease this part this integral goes down but you are making the peak move like that and because this one gets a higher power of the peak you recover the same gravitational wave background. So there's in in this parameter space the constraints from PTAs are some sort of line like that. So if you live anywhere here um you satisfy the measured value of the background and what I was saying the other day is that if you put the naive numbers and you take this at face value and everything here there is some sort of factor of four difference okay and you can account for this factor of four um maybe what's happening is that this is off and you can try to say, "Oh, maybe the black hole uh total mass density of black hole is not so is not bad, but I I've screwed up the peak. So the the black holes are a little bit heavier and I get to here or I have more density in black holes that I thought at this um at this and here would be a factor of four. If you make if you want to make the black holes much lighter than this, then you need much more than a factor of four difference because the black holes are emit less, right? And so you need more of them. So another way of saying if this is somehow miss if this is all taken at face value, I've counted this black holes in the galaxy. I'm missing some what mass I could put them.
If I make them much heavier than this, I don't need so many of them. I don't need to add much more density in black holes because each of them are heavy and they produce a lot of energy. Um and um however, if I want to make them much lighter than this, I need many more. And so in total because this power is lower than this power I'll end up with a much a much more density in black holes. And then remember this I can try to compare with the quazars or something like that.
Okay. So that's the game. That's what I was saying the other day for the for the problem. So let me just flash the problem what it is. Yeah. Any questions about this? Yeah.
>> Yeah. So you can say I've learned about the radiative efficiency. So I go and compare with direct estimates of the radiative efficiency or I uh you know exactly yeah this is all to learn about uh for in the in the case if you go compared with quasers there's actually two things that you can learn one is this radative efficiency and also something called the Edington ratio uh which is the ratio of the luminosity of the quazars to this Edington luminosity that I didn't introduce that is um for a given luminosity of quazars trying to assign a mass to it.
Um so those are two things that people interested in accretion and and so on care about and those directly translate for a given luminosity of function of quazars into a row black holes and an M peak. So if you want you can translate this plot if you care about that into constraints of the radiative efficiency and the Edington ratio. And again these are constraints um constraints um you know for the average population. There's going to be sc a lot of scatter uh between them. Um um what am I going to say? So I think you know just what's interesting is that uh there's various ways to try to get so we see these quazars we see the black holes in the centers of galaxies and so on. There's now a new way of uh uh of trying to get a sense or information about those those masses and uh number density of those black holes. different from the canonical way that we have been doing it so far which is by looking at quazars or counting galaxies counting the black holes in galaxies directly that you know can be put more or less in the same plane and then we can try to understand all of the same things that we were trying to measure before properties of accretions of quazars and the like um we now have a separate route to try to uh um get at them so um I am not Um, so I'm not here to to tell you, look, there's a factor of four. It's time to include some gravitational waves from the early universe, primordial black holes. I don't know what. No, I'm not talking about that. I'm just saying that, you know, good agreement, you could say, and also little something is off. So, let's try to understand what is off. That's the people that care about this uh will try to do it. But it's another avenue to put uh measurements on the same plot. So uh this would be one plane. The other one would be radative efficiency and uh this Edington ratio lambda for the more astrophysics of you.
Uh any other questions?
No.
And so the final thing the now I would just advertise the the exercise which is the following. So this is a constraint what you would learn from uh from the amplitude of the PTA measurement. It would be something like this. Okay. Um and you don't know where to put the you know you don't know if the sol the solution of you don't know the peak. You just know this combination that keeps the gravitational background the same.
uh but there's so in addition to the amplitude there's the shape of the spectrum in the PTA so the PTA has measured the gravitational wave background in many frequencies okay and so the idea of the exercise is the following or the um so to derive this I did it the easiest way which is I thought of a region of the universe as a box I thought of the gravitational wave background's energy density in that and so I just needed to count the number of sources how much energy each source produced and that's in the box and that's all I needed to do. I didn't have to do very much. However, you can go around it in a different way. You can say each source if I know the mass and the mass ratio and the distance produces a given strain on the earth. Okay. So also uh something like this you can get it by summing the contributions from all the sources. Okay. Um now if you want to do that what you need to know you would need to know the or or get in your model the number density of these sources and then their the strain that they produce on earth which depends on their distance. And so for that you will to try to integrate the effect of all the sources uh you would need to understand like cosmological distances to a given red shift the volume and so on. And in addition to that any given source spends only a fraction of their life in in a given frequency band. Right? So you'll have to take that into account. But once you know that how much uh um how much time the source spends in a given frequency band and how what's the volume to a given red shift and if you have a model for the number density of of say these black holes in the universe you can write another integral which will give you the same answer uh but uh of for the background but also you can have you can compute something else which would be in a given frequency band the number of sources you effect that have a given let's say strain squared. Okay. So like some sort of luminosity function as a function of the uh strain of the sources. So how many sources that are very bright compared to less bright and so on. This uh kind of number of sources per strain could be like the similar to the number of sources per luminosity in the optical you can compute as some sort of integral along these lines. And that's part of the exercise. And um the exercise what you'll make you discover is that um because of this effect um that uh the sources spend a different amount of time in different uh frequency bands and so on. Um the num the typical if you for these astrophysically interesting models the the num the typical number of sources that you might expect in a given frequency band is very different um scales very fast with the frequency okay so even within the just the f something like frequency to the 113 I think let me just make sure I don't screw up and tell you uh but it's part of your of your exercise. It's very it's a very um yeah frequency to the minus 113 the number of the typical number of sources. So um as a function of frequency. So this means that uh and not only that it scales very fast uh with frequency which means that even though the pulsar timing arrays have measured the spectrum only over let's say a decade in frequency not so much still this very large uh there's a very large change in the expected number of sources that you should see in the different bins in frequency or the expected number of the sources. Okay. Um and furthermore when you plug in the canonical numbers this type of canonical numbers what you expect from astrophysics that number goes through one more or less somewhere there in this band. Okay it's not that it changes a lot but is a huge number all the time or a minuscule number all the time. Okay.
So it goes through one and um the um um the nature of what you expect to see in a situation where um where the typical number of sources in the given frequency beam is very large compared to the time where the the typical number of sources of these say 10 to the nine the ones that are supposed to contribute the most are a small number okay is radically different. Okay. And so um it will the exercise will ask you to um to compute some sort of distribution for the strain squared uh that you might expect for different frequencies and um and use that to say that if this peak mass so remember in when when we if we are trying to constrain this when the peak mass gets large we need to to make the same background of uh of uh gravitational waves fewer number of black holes because each of them each binary emits more. Okay. And so if you start increasing this, you get this problem that the number the typical number that you expect starts to become very small. And you will see that this dramatically maybe changes your expectation for the for the spectrum because the typical the the source that in this calculation is kind of the average energy. But in any given realization you might not expect to see in this frequency band any source because they're getting very rare and for typical astrophysical numbers not just you don't need to do anything strange you are in this regime in which uh you might cross the n expected number of sources equals to one in the middle of this PTA band okay and so that would that would change what you expect for the shape of the spectrum and given that the that is not seen in and you will plot this and try I mean this is all qualitative but you will do something in the exercise you will you will be able to say that very high peak masses above let's say here 10 to the 10 that's probably not a good uh solution to this problem because uh they would lead to a spectrum that does not look like or is not very well fitted by this power okay any questions about Please I'm just advertising the exercise. Okay.
But uh I think the one thing to take away that I I I I think it's good that you wake work through it is this realization that uh for reasonable for what we expect to see somewhere uh in the frequencies in the range between periods of say 10 years and one year or some some depend on what you pick for this M peak but especially once you get to 10 to the 10 this uh number expected number of sources is both a very high power of the frequency but also a very high power of the peak mass. Um so um the the situation becomes quite different and uh so there is an additional information from this in the in what what has been seen. Okay.
Any any questions? Yeah.
Um this uh you could do it for the strain as well. It's easier to do it this way qualitatively. Um what happens with this this so um we can we can talk online. This one is easier and qualitatively it gives you the same uh the the the um the same conclusions. um you know by by by the time uh so if if you want to do the strength yeah nothing easier for you that's all um any any um any other question yeah >> of this of this of this um mass Yes. So >> when it is in the source then it is not.
>> Yeah. So the distribution if you wanted the distribution from the strain square it will look something like this. So when I said the typical number of sources let me backtrack. When I said the typical number of sourc I I said the typical number of sources of the mass that are supposed to contribute the most. Right? So if those are gone, the ones that are a little bit less massive, which are more numerous, those are there's still a big number of them. And so you will get the background corresponding to a peak mass which is smaller because the heavy ones are not there or rarely are there. Right? So what happens is that uh the typ in the typical realization um so if you computed the distribution of the strain square it will look something like this in the regime of very small number of sources it will have a very um a very uh long tail okay the shape of this long tail is directly given by this dn dh² so here I'm plotting some probability of h squar as a function of h squar Okay. So what happens is that um I'm losing the the in most of my realization the most likely situation is that these very heavy ones very heavy black holes say are not there. Okay. But the but I will get the background corresponding to a smaller mass. So I will get the the typical realization will be um so one easy way to do it is to find the mass which up to which you expect there to be one source and think that that's most of the time what it is and so this will give you the typical value of this peak which is then the background that you expect if the maximum mass was that one and not the the other one. Every so often you will get there's a chance that you will get one of those sources which will make the average agree with that because the average needs to be that that's um the the average needs to be that the spectrum be this power law that you compute like that so that the average is like this. So the average of this distribution when you go to this regime of NC small the average is here but the typical the peak is somewhere there and then it's a very skewed distribution with a very big but that's kind of the exercise yeah >> yes >> then >> um maybe I haven't thought about it yes Um yeah prop yeah um well the thing is that the helings and downs I think you get the same correlations for one source also if there's only one source on the sky you also get the same correlation I don't know you should ask Bruce what yeah he'll do it tomorrow so so I think it is the case that um and let me just say that when you look at this what typically happens is that uh most of the time you have many sources that are not very bright. So the the the peak of this this looks like a Gaussian.
Oops. Okay. I I will not be able. So this looks roughly speaking like a Gaussian from a central limit theorem of the part of of the mass black hole mass function where the numbers are large plus you know and then when you want to say the chances that I get a very high hc square is not by having two very bright sources it's just one okay so plus the chances of one very bright one following this dndh square in the middle yes a little bit the details of how the blood but for the most part you're here and every so often you get a very bright thing. Um and so I suppose if if if in your realization you're you don't have any of these bright guys you you're still in the Gaussian kind of thing. I mean of course this breaks depends on the signal to noise how good but roughly speaking if you are um I think at the current time I would say most probably you're either here or in the one source regime which has not been seen in none of the beans because people look for the one source if you move that source around >> uh I think >> well let me not say anything and Bruce can say the correct thing more. Um, okay. So, that's uh the exercise advertisement. Any questions? Any other questions?
Okay. So, what I wanted to do next was talk a little bit about now backgrounds of more of a cosmological su nature. uh just to um advertise or try to get to um so there's a band of gravitational waves that is not the subject of this uh uh school uh but are gravitational waves uh that we are searching by looking at in the polarization of the cosmic microwave background. Okay. So I just want to get to um some quickly trying to give you enough things to try for you to try to understand what people are doing and why. Okay, what what are they trying to measure in the cosmic micro background polarization and why and why that is sensitive to gravitational waves. Okay. So let let me just start by some um something that Bruce already said which is that if you look at gravitational waves of a given uh frequency the frequ that were you know created in the early universe at some point or another. their frequency gets redshifted as um as uh time goes or their wavelength is increasing um with their uh with the Hubble expansion. So lambda of the gravitational wave at time t it was emitted at with some and then it will be a of t divided by a of t emitted. So okay >> and he made the comparison which is a useful comparison I would also use which is the comparison between the size of this gravitational wave and the size of the Hubble horizon of the universe at any given time. Okay. So the Hubble radius I will use just one over the Hubble constant. Okay. Um and so I want to ask the question uh or repeat uh yeah >> well I want to make a comment that this is really in relativity horizon means the boundary development describe us very specific meaning and I actually say a couple horizon >> yeah I maybe I agree with you but first I will just not be able to keep people say horizon and they learn it here.
>> Well, uh fine, but unfortunately I'm I'm not able to change the the the narrative of the world. Okay.
So, um and um well, and there's also uh ways in which the Hubble horizon and the horizon around a black hole people make analogies. For example, when we talk about the generation of fluctuations and hawking radiation and so on that are useful to make. So I think uh anyway it's not uh you might not like it but okay whatever that's what everybody uses. You also don't you also don't like the Gaussian ensemble but you you did it also right. So for the same with the same uh excuse than the one I am using what >> you're making. No, no, I think it's good. I mean, anyway, um that's okay. So uh so the hover radius uh I'll try to do it for a couple of uh of um um and uh you know there's many for for the purpose of these of these comments that I want to make the hover radius for most in most FRW uh cosmos matter error radiation era is just this the time the age of the universe 23 Hubble is 2 over 3t one half over t or something. So this H radius is basically the age of the universe in radiation era, matter era.
And so um for the purpose of these kind of arguments, if the universe um um if the universe um um has a given age and I wanted to make some say I want to move matter so that is distributed with some fluctuations of a given wavelength. um if uh the distance of that wavelength is too large compared to C times the age of the universe, I don't even have time to move things around or create those gravitational waves of this large frequency. Put some source that is coherent with that frequency if that the age of the universe is not even long enough for that, right? And so in that sense it is useful to make this ratio between the wavelength and the age of the universe or the Hubble horizon.
Okay? And so um if you do this um okay so this lambda is proportional to a okay and um and um and u h dot h goes upstairs now so this is proportional to so h is a dot over a okay and So the a's cancel and this is proportional to just a dot the time derivative of the expansion factor. So um this ratio whether or not this ratio is getting bigger or smaller depends on whether a dot is increasing or decreasing with time. Okay. So if you want uh um and that that means that you care about the sign of the second derivative of a whether a is accelerating or not accelerating. So um during most of the expansion of the universe with the ex exception of this uh time now the expansion of the universe has been decelerating. Okay.
And so a dot a is decreasing with a dot is decreasing with time. Okay. So um um but um if there is a period of accelerated expansion the situation changes. Okay. Um so the the the relative size of the wavelength to the Hubble horizon changes how it evolves. U so sometimes it is useful. Uh so I will just do a similar plot that the one Bruce did but I will instead of plotting the wavelength and the Hubble radius I will just plot the commoving wavelength.
So so with the factor of a taken uh in so that the in those coordinates the wavelength is just fixed. Okay. So uh so the commoving wavelength of the gravitational wave is just a constant now basically I do I I am I'm plotting lambda divided by a lambda of t divided by a so the or the size of it today if I do put the a on the other side um okay so um so the wavelength is uh is constant in this uh so These are co moving coordinates that come um and this is time or re uh a and so uh during the normal periods of the of the expansion of the universe then the universe is decelerating which means that the hub horizon is uh or the hover length is uh going faster than this lambda and so it will look something like this. Okay. So, um this would be the Hubble radius um for moving again. Okay. So, we are somewhere here in the late universe looking at a gravitational wave. Okay.
And so this we go back, we go back, we go back, eventually the size of that gravitational wave becomes comparable to the horizon. And so it would be not uh feasible to create that gravitational wave at any time later than that because it will be it will uh it would involve having uh regions that are separated more than the age of the universe somehow act together to create these gravitational waves. I mean um so um okay so when I was talking about the astrophysical background we are here the black holes that produce the PTA things are also here no problem everybody is well under the horizon okay but if I go back eventually this any given wavelength um you know I can create them astrophysically or cosmo maybe you people would call if they creation is close to the time when the wavelength is of the order of the of the Hubble radius. You would call some sort of cosmological thing, some phase transition and stuff like that or um some cosmic string network or something of this nature maybe are creating gravitational waves comparable to the horizon at any given time and otherwise much before much smaller but I cannot go on this side. Okay.
Any any questions about this comments?
Okay.
But then I could ask the question so I mean something like this. Uh I could ask the question let's say the big bang or the hot big bang thing starts here somewhere. Okay. So this history of the universe that is a radiation air a matter air and so on starts at some point from there forward. Okay. Could there be gravitational waves already at the very beginning there of size which are much larger than the Hubble horizon at the beginning of this hot big bang model of the universe? Okay. Could I have something from the beginning from the big bang? It's already there. I started with the seats for these gravitational waves already in place.
They are there. They are there and eventually when you are here they are oscillating around and you can measure them. But they they were there from the very beginning. Okay. Um possibly we don't know what the very beginning is.
So we could ask the question and um um okay um and for for um it's not such a ridiculous question because we already know that there are things we have found things that come uh from here in some sense. which is the following the same thing that I that we are saying about gravitational waves. We can ask the question the fluctuations that we see that lead to the development of large scale structure the formation of galaxies the temperature and isotropies in the CNB when were they created they also their size also changes with the expansion of the universe just like this. So this lambda of the gravitational wave could be the wavelength of a perturbation that then leads to galaxies or the hotspots that we observe in the CMBB. So same uh blah blah applies if I'm going to make them in the universe. So I go back I can make them anywhere here by some sort of process a network of cosmic strings moving things around and creating differences in the density from here to there that then can grow to form galaxies or whatever. But eventually there comes a point in which the same story they become larger than the horizon. So those things are not operative and uh at least with this anyway uh those are not operative and uh when were these things created now we know for a fact like theorem that the fluctuations that grow to make the large scale structure were already here. Okay, wherever you start the hot big bang they were already there. So if those were already there um why not some background of gravitational waves perhaps why not usually what we do is just not to say oh there's abracadabra big bang and everything was there already um we do slightly one additional uh you know step which is we try to extend this history somehow and come up with some process uh of something happening before um the the start of the radiation era that would make this not look abracadabra but that we can do something write some equation or something like that. And if I wanted to do this, I need this length scale to now have a different slope. So that something that is much larger uh than the horizon length or the how radius length uh at the beginning of this hot big bang era becomes much smaller than the horizon in the past somewhere so that some process that I'm cooking up uh can create it. Okay. So I need some history of the universe where this hub radius in this coordinate first decreases.
Um and so I now have some period of time in which uh I could create this density fluctuations or the gravitational wave background. Then so I need this moving volume to go down which um as that formula indicates I need a period of accelerated expansion. If there is one option is to have an a dot positive and also accelerating so that the ratio uh goes like this. Okay. So this is inflation but maybe something else happened but so um um so if the universe went through such a period then maybe I have an option that not just the the density fluctuations were created here but perhaps some gravitational waves were created here as well. Okay. So that's the qu that's the idea and what I was telling you is that we now know that uh there are the the fluctuations at least uh um come from this I mean were there for for the purpose of the hot big bang they were already here. If you want you can add some story here and create them in some in your favorite thing inflation or something else. But by the time the radiation era was around they came they were already outside the horizon there.
Okay. How do we know that for a fact for the density fluctuations? Um we know it in the following the the simple way that we um know it is the following. Imagine so when we look at the cosmic microwave background that radiation comes from a given uh time in the history of the universe when the hydrogen atoms combine when the electrons and protons combine to form the hydrogen atom which we call recombination. Okay. Um so it comes from this time. Okay. So we can ask the question um let's look at a wavelength on the sky that when I extrapolate it back the place where it crosses this Hubble horizon is that time of recombination. Okay let's look at that on the sky that substant we can compute and that's roughly like a degree scale fluctuation on the sky. And so I can ask the question so if the if the fluctuations were created uh well inside the horizon then there shouldn't be any fluctuations there. Okay. And uh so I look at the biggest thing that could have been formed in if all that there was was this okay and I see that there are fluctuations.
So first thing there looks like there are fluctuations on this those scales.
So I have two options either something is happening very fast at horizon crossing right at this point something is happening matter is getting rearranged so that I see that there are fluctuations on those scales or they come from the past. Okay. So how do I know that they were not just happened to be formed at that time the fluctuations that I see. So I can go to the microwave background and look for different regions. There are some regions that are over dense at that time. So I look at the cosmic microwave background look back I'm looking at various regions on the in the universe at this time. Okay.
And so some of them the density is higher some of them it's a little bit lower by 10 times per 10 parts per million something like that fluctuations of 10 to the minus 5 from and so I can take a look at the at the places where the density is a little bit higher. I can take a look at the place places uh where the density is a little bit lower than the average and I can ask the following question.
Um so this we can do. We have the map by now of the CMBB. We know how the temperature of the CMBB relates to densities at the time. So we can pick the over dense the underd.
So there are fluctuations on this scale that is the maximum of the time. Are they create are they being created when we are seeing them or not? How would I know that? If I am creating this over density for example, then the velocities need to be pointing towards there I had a universe with no fluctuations and there's some mechanism acting at the time that's creating these over densities just in time as fast as they possibly can. Okay. So in that case the velocities need to point towards this this place. If however I started with an over density and suddenly the you the the Hubble uh radius is comparable to this over density and and the material realize oh this place has more density and also as a result in for this fluid more pressure. this will launch some sort of wave that will try to smooth this out. And so the velocities um would be moving like that if this was there from before. Okay. So I go look at these maximum things and I ask the question are the velocities going in or going out? Okay. And this tells me was this thing there from before or is it being formed at that time? And we can measure velocities at the last scattering surface by looking at at the polarization of the CMBB. And so the divergence of the velocity is directly related to the linear polarization of the CMB. I'll tell you a little bit about that in a second. But so um there's a question about the sign of the divergence of the velocity versus the sign of over density under density.
That's the test. And we go out there and we see this situation. We don't see this situation. Okay. Observation. Okay. So by measuring the velocities of the of the plasma using the polarization of the CMBB um we know that at least the density fluctuations were created were there before the the this time. So they came from now uh there's no process being able to make them or change them when they were very large compared to the horizon. So for the purpose of the hot big bang they come from here. Okay.
Now we might add something in some inflation period or something else and try to create them. We need to do something like this or maybe it's abracadabra string theory. I don't know but they come from here. Okay. So the question of whether there is a background of gravitational waves that was that was also there at the time I think is a fair fair question. Okay. Um any question about this? Any comments?
No.
Okay. So now the final thing that I wanted to mention is um okay let's say there is a background of gravitational waves. How is the CMBB sensitive to it? Why? By me by looking at the cosmic microwave background I can know if there is um if there are gravitational waves in the universe everywhere in particular they were also there at re combination and they were affecting the electrons the and the material over there and doing something moving them around. if they were there moving things around, how can I tell? Okay, is there a way to tell?
And luckily, there is a way to tell. Um, and the answer goes like this. So, it goes to the polarization of the cosmic microwave background. So, let me just uh be uh very quick about this. So, we are here, we look at the radiation from far away, the microwave background or whatever it was. In the case of the microwave background, the universe has been transparent for a very long time to the photons of the cosmic microwave background for the most part. Um, and so they are coming from very very far away.
When you go sufficiently back in time, there is the this period of recombination in which before that time you had protons and electrons separate.
After that time, they formed hydrogen atoms. Okay. Now the cross-section for light to interact with the charge electron is much larger than the cross-section for light to interact with the hydrogen atom. So the moment back in time. So this is I'm following the trajectory of of some light from the cosmic microwave background back in time back in time. The moment I get to um to re combination and now instead of having hydrogen atoms here, you know, little hydrogen atoms, I now have electrons and protons separate. Now the cosmic micro background scatters with the electrons very efficiently. So if I follow the path of uh of the photon, it does like this and then it starts random walking like that. Okay? Because it's scattering with the electron. The density is also increasing with time as the universe or decreasing as the universe expands. So as I go back in time, the density of matter is going up. So the cross the mean free path of the photon is going down down. And so these steps of the random world get shorter and shorter and shorter. Okay. So when we look at the cosmic microwave background, the photons are coming from here from one specific region. Okay. Um and in some sense uh we cannot see anything >> about the mental picture. The photon is not actually scattering. It's not keeping it identity. It's actually being absorbed.
>> Not anymore. So it depends when you go back. But um you know there's a time when the uh >> a little bit >> no no for a long very long time. So the you you you you um um you you you conserve the number of uh the number of photons. That's why um if you do anything you inject energy into the into the cosmic microwave background. So you you you you change the spectrum. So if you look at it's true that as you go back eventually there are processes that emit um emit photons and eventually the cosmic micro background thermalizes with everything else. Right. So if you go back in time the scatterings, creation of photons, annihilation, absorptions, they are so very fast. That's that's why the cosmic microwave background is a black body spectrum. You were in thermal equilibrium. Um but much much before red shift of a thousand uh that those processes become too slow and you end up with a cosmic microwave background with no creation or annihilation of photons anymore. you conserve the number. So there is a period of time where you cannot thermalize the um the CNB anymore. Um and so for example people study that's why people are interested also in looking at the spectrum of the CNB because if I see a spectrum that is not uh a black body it might tell me about some processes that were injecting photons or something like that in some per if it happened too early it gets thermalized but there's a period of time in which I'm not uh so anyway that's a side note but uh for the for the purpose of the cosmic microwave background yeah follow the photon and then it has a very short mean free path. Okay.
Now when uh when uh photons scatter with an electron um they can get partially polarized if the radiation incident on the electron is not isotropic. The resulting uh uh light is a little bit polarized a little bit linearly polarized. If if the radiation incident on the electron has a quadruple moment in fact if you're a little bit uh so if the pattern of radiation has a quadruple and isotropy more light I mean coming say from the top and the bottom than from the sides then it's cut the part that scatters towards you will be a little bit linearly polarized okay so if there is an isotropic radiation incident on these uh electrons um um there will be a little bit of linear polarization in the cosmic microwave background. And so the the effect of both gravitational waves and density fluctuations is to create anotropies just as the same as the anisotropies that we see the same morally of the anisotropies that we see in the sky today were seen at some level by the electrons. It's just that we see they're coming from very far away from us. the photons. But for the last scatter, let's say there was a scatter here that led to the photon that we observe this electron was seeing radiation from a small region around it of the size of the mean free path. And just as we see a little bit or or we see you know all the multiples um the the CMBB is an isotropic this electron also sees an anisotropic uh um radiation if the universe was not perfectly homogeneous. So if there's density fluctuations for example let's say this electron is moving at certain velocity but the material o over here is moving at some other velocity there will be a little relative doppler shift between here and here and this will lead to a little change in the in the um a shift in the frequency that is uh equivalent to a change in the temperature and it so there will be a different ano an isotropy due to that in the rest frame of electron. Also, if there is gravitational potential fluctuations, the there will be a gravitational red shift between here and here. If there is a background of gravitational waves, the gravitational waves will, you know, just the same formula that Bruce wrote, integral of h dot, they will create along this little uh path some red shift and so it will create some quadruple as seen by this uh electron. And so that anisotropic um um radiation will create some little bit of linear polarization and the light that we observe here will be a little bit linearly polarized. Um now of course the the same gravitational waves will also make these changes between here and here. So they will make an isotropies in the temperature as well that we would observe. Why focus on the polarization?
Okay. So um so why focus on the polarization? Um so gravitational waves and these density fluctuations create all of it create an isotropies of the temperature that we observe and create little polarization a little bit of polar polarization fraction for the radiation that comes to us. So we can think that when we make or when we make a map of the cosmic microwave background, we report in each direction on the sky uh we report a temperature and and a linear polarization. So we need to say how polarized the light is and in what direction. Okay? And for each point on the sky we have a map of temperatures and polarizations. That's what we measure. So the reason for focusing and uh both if if we are discussing polarization both density in a homogeneities through these velocity effects and uh the cosmic micro background and background of gravitational waves would create an isotropies here that through a scattering will lead to linear polarization. So the linear polarization is produced not by the gravitational waves but it's produced by the Thompson scattering by the scattering with the electrons of the anisotropic radiation that is created by the velocities or by the gravitational waves. Okay. Both of them lead to um lead to um um a little bit of polarization. Okay.
Um, good. So, what's special about the polarization in terms of the uh being able to see um gravitational waves? So, let's let's just do the following. So imagine that you're here and this let me put here the Z-axis X Y okay and there is the last scattering surface okay very big this place where the photons come from some sphere around us okay and let's imagine that there is a single gravitational wave or a single density fluctuations of a given wavelength FIA mode a single fia mode okay so let's say if it's a density fluctuation I will decompose just as you're doing for gravitational waves the background of gravitational waves or the background of density fluctuations as a superposition of FIA modes. All of these fluctuations are very small. So I can think of one of them at a time. So the problem that I need to solve is the one with one FIA component or of the of either the gravitational wave or the um density fracture and see what happens.
Okay. So for example, I could imagine a universe where there is along the z-axis some plane wave of density fluctuations.
So here the density of the universe in this plane is larger along the c- axis.
Here is smaller here is larger. Some sinosoidal pattern. Okay, let's say big a big wavelength of size similar to our sub horizon or a factor of 10 or 100 smaller than that. Okay, or it could be a gravitational wave. Okay. Of this uh similar Okay. Now when I look here um in this direction the photon comes from here and it's coming actually from here.
When I look it's coming from here. So um when I look at the cosmic microwave background in different directions on the sky I'm sampling what the effect of this long wavelength gravitational wave or density fluctuation was over here over here over here over here. Is this clear or not?
Okay. So what I will try to understand is what is the pattern of the direction of the polarization that will be produced by the Thompson by this Thompson scattering um produced if here there is a gravitational wave or here is there is a uh density fluctuation. So as I change the direction on the sky on on what in what direction is the light polarized?
So probably it will be polarized in one way here. Then by the time I get to the place you know where there's an under density maybe the direction of the polarization slightly different and it will change on the sky depending on what was happening in this spot. What what kind of quadrupole an isotropy was being created on the electrons here that then through the Thompson scattering led to the polarization that I'm going to observe here. Okay. So there will be a pattern on the sky produced by um by of by of polarization and also of temperature and isotropies produced by this one single fia mode. Okay. But it it'll turn out that uh because of some because of symmetry this pattern will be very different if if the thing is a gravitational wave or a density fluctuation. How come? So um linear polarization as I was telling you um you need to specify how polarized the light is and in some direction. So you put a polarizer you rotated it and you uh the you can do various things. You can find the orientation where you get most of the light through. That's one option. Or you can take the polarizer in one direction and see how much intensity you get and do it in the 90 degrees and uh and uh see how much light gets through and subtract these two things.
Let me call this I1 and this I2 and define Q which will be I2 minus I1 for example. And then I could do the repeat the experiment with the polarizer like this 45 degree rotated first like this and first like that and then like that call this I1 and I2 and measure again the difference in the intensity. It turns out that any linear polarization if you measure these two quantities or you measure this difference and then rotate the polarizers by uh 45 degrees and measure it again you call this U.
These are called Stokes parameters. So E2 prime minus E1 prime. This would be the two prime one prime direction. And you can pick the it doesn't matter which directions you pick as long as you do it one way and then rotate 45 degrees and you do it again. If you measure these two differences, any linear polarization can be described with those two numbers or equivalently how much polarization you have and in what angle it's maximum or something like this. when you rotate the the polarizer when you get the maximum what polarization fraction you get and what was the angle. Those are two equivalent ways. Um this way by the way just to make a ju just to make a connection uh of course the numbers that you will get if you do this experiment will depend on how you oriented these two to start with. If you did these ones for Q and this one for you, you'll get one thing. But let's say I started with some different orientation by an angle pi for define Q with something else and then rotate 45 degrees and do another U which will be with different coordinates. Okay, the answers you will get are different but the way they transform with this rotation. So instead I have the Q with this with these polarizers like that.
But now I do it again with some other angle pi right another an angle related to this equal to pi the combination Q plus IU transforms the new ones has spin 2 or something. So uh the same you the the the uh numbers that you get with the new coordinate system are related with the old in this way. Okay. So same so the math becomes the same as Bruce might or might not do for uh H+ plus IH cross.
Okay. So this pin two spherical harmonics are the thing that uh that we use to to characterize the CME polarization as well. Okay. And it's very related the point of the gravitational waves creating a pattern on the sky that is different than the gra than the density fluctuations is very related to this fact. In fact um okay so we need we have these quantities Q plus IU. So let me just do pictorially what's going to happen.
Okay.
So let me ask the question the following question. Um let's say I have some density fluctuations in the early universe. So in this plane wave so here it's positive density negative density I start with something like that at the big bang and positive negative positive negative and I let it go okay and I let me look from the north pole. So let me look from here and try to plot the direction of the polarization that this person will see when it looks around the circle. Okay. So let me just focus on like a little region here around the north pole just to make it easier. Uh and ask ask you to tell me what can be the direction what can be the pattern of the polarization that an observer would see uh if there was this gravitational density fluctuation in the universe and it moved and so on. Of course you cannot tell me because you don't you need to equations how things move the polarization but there were certain things that you will be able to tell me.
So um let me draw then I'm looking from the top. This is the z-axis. Then let's say this is the xy plane. Okay. So here's x and y. Uh okay. And I'm I want you to tell me something about the pattern of the polarization directions. If the the cosmic micro background will be polarized in some direction. What this pattern could be? There's only this density fluctuation. Okay. what it could be I don't know you probably the first answer would be you don't know true but there are certain things you know about the pattern the problem it's a linear problem right there's only this guy okay so it has certain symmetries what symmetries it has it has some symmetry of rotation around this axis right so if you plotted here uh so here is the z-axis right so if you said oh the polarization here was this one then you can draw whatever Whatever is the pattern you can draw a circle like that and it need to be the rotated version of this all around because this problem has this symmetry. Okay. So I don't know maybe you you will not be able to tell me if here it's oriented in what way or in which other way but if you tell me one for any given value here you will know to go all around. Okay.
And then so is this clear or not? Yeah.
So now so for each radius you will need to get tell me in what direction it is uh polarized could be it's not polarized for this direction it could be is in this direction it could be in this then you rotate it around okay second thing you can tell me is okay am I allowed to plot let let's uh make some uh um some uh um pattern let me give you two examples Okay. Pattern like this. So all radial around or let me give you three patterns um around this point and you tell me if it's a possible solution. Okay. One of them is the center here and they're all radial around this point.
Another option it would be all uh tangential around this point. Okay. And let me do a third pattern would be which would be uh for example I take all of these I take this one and I rotate it by 45 degrees.
>> A question in your tangential pattern is there an arrow and a tail? Is there a direction or just a parallel line?
>> No, it's just a parallel nine because it's linear polarization and if you rotate the polarizer by uh uh 180 degrees you get the same right that you you it's not vectors. So okay. So uh but this tells me uh okay let's hold that thought. So these are just directions of the in which the light is most polarized. So if you put the polarizer where you get the most diff you know the most uh light going through. Okay. And in each place you rotate and you find that direction you plot an arrow in this d you plot a line in this direction. Not an arrow because there's no meaning in the polarizer like one way or the other.
Okay, good. So they are not arrows. So this so this is not a vector field but close.
It's really a spin two field. If this quantity is transformed like e to the outside then I would start putting arrows with no two with the one. Okay.
Any any other question? Okay. So uh these were two patterns and I was doing some third pattern would would be um let me rotate everything there by 45° in one of the location.
So um I will be very bad at plotting this. So I will uh first do the Okay. So let's say I I look at some particular radius and I tell you the pattern of polarization is that one, that one or that one. Um are all of these patterns allowed for this problem?
you don't know how to solve the equations but based on the symmetries only are they all the same there's a fourth pattern which would be if I rotate 45 in the other direction right so it would be like that okay any anybody wants to guess something say something yeah >> I would guess this is very nice I haven't thought about this I would guess the top two patterns are both your your plane weight density traveling has complete rotational symmetry also reflection and the first two there are reflection symmetry but the last is not reflection symmetry so we're allowed >> exactly so the big the the the the question is about reflection symmetry because I drew them such I tried at least to make them that you when you go around I plotted one and then I do the same thing going around right so the part about the the rotational symmetry fine I already took care everybody satisfies this. The four patterns um the four patterns if I had managed to draw the fourth one would also satisfy this.
However, the first two patterns if you put a mirror in any direction there and you reflect around that mirror it will give you the same pattern it will go through. Nothing will change. Okay.
However, this one if I put a mirror here and I rotate then I get the fourth pattern that I didn't drew. the one that had the thing 45 degrees in the opposite direction. So those two patterns are even with respect to some parity. These ones are odd. Okay. Um another way of saying it, if this was um if this was uh uh instead of a field of spin 2 things, this Q plus IU, it was a vector field.
Those two patterns there are things that you would get by being the gradient of some potential. While these ones on the bottom would be what you get if you're the curl of something. Okay. So that's kind of uh gradient type things. These are curl type things. Okay. So you could call this pattern gradient patterns and these curl patterns. Okay. Uh now what happens if I have a gravitational wave?
Okay. The again the the polarization origin is the same for density fluctuations of gravitational waves is Thompson scattering of some anisotropic radiation. Okay. And for that we solve the radiative transfer equations. We solve the equation for the gravitational wave. We do it right but I'm just trying to jump to the answer. Okay. Uh so in the case of gravitational waves now you have these two polarizations. Okay. or you could form this helicity um combinations that uh Bruce was talking about, right? So um exercise or think about it. If you just have one of these uh helicity components, no longer do you have this uh parity symmetry or if you talk about the plus and the cross polarization, the parity symmetry of the problem will be restored because the universe let's say is parity symmetric on average. Okay. However, the uh size of gravitation waves in a given realization of one particular fia mode or frequency of gravitational radiation of the cross polarization or the plus polarization might be different. If the on average then the power in those two sides would be the same but one or the other will be different and then the pattern that you would produce if you have say one of these elicities and more than the other it will be different on the sky. it will not respect this parity symmetry. Okay. And also if you think of the plus and the cross there so the the um anyway so you can with gravitational waves you can create this kind of pattern. Okay. But you cannot create those kind of patterns over there. Okay.
Um so um okay so I'm super uh I'm super out of time.
density for density for basis the top but not the bottom >> the density fluctuation the thing is the density fluctuations cannot produce this because they respect parity the the um the gravitational waves a given one single then can create this and that both of them. So if you decompose so at the end of the day you can solve the problem of the radative transfer of this uh gravitational wave pattern of polarization you will get a map on the sky for a given wavelength of polarization of this Q and U that is produced everywhere and you can ask the question does this pattern I can decompose it into some basis of or the part that is the gradient part and the curl part just like a vector field there are two potentials called E and B which you can decompose an arbitrary pattern one of which is odd under parity the B or the curl part and one which is even under parity the E part or gradient part. So any pattern produced by both gravitational waves and density fluctuations can be decomposed in that way and also the one on the sky. If there's only density fluctuations on the sky, they cannot produce by symmetry the curl patterns. So you should take the if you thought if in instead of being polarization was a vector field you have the vectors of the polarization on the sky you compute the curl density fluctuations cannot produce a curl so you should see zero but if you go make the experiment and see all these arrows take the curl and it's non zero in you know there's some noise in the experiment so well above the noise then it means there's something that can produce a curl cannot be density fluctuations gravitational waves can do it And that's how we can see if the you know something was there left over from whatever produced the density fluctuations whether or not it produced also um gravitational waves. So that's the goal of the CMV polarization experiments that are trying to map out the polarization of the CMBB. Then decompose it into the gradient and the curl and see if you see any non-zero curl piece of this pin to thing in spin to field of Q plus IU. And if you do, you know that there's something else in addition to uh density fluctuation. Now it's raining so badly that I don't think we can get out of here. But anyway, uh any questions?
Yeah.
Sorry.
>> Oh, why hasn't been done? So, first of all, um the degree of polarization of the CMBB is not 100%. Okay. So, um it's more like 10. It depends on the angular scale, but it's more like 10%. So the measurement of polarization is more difficult than the measurement of the temperature. By now the measurement of the polarization has already been done as well. There's a there's an additional uh question which is how big the uh gravitational wave background is if at all. Okay. The smaller it is the smaller the polarization it produces. the smaller the remember the the polarization is produced by the anisotropies created by the gravitational wave background. If the strain of the gravitational wave background is smaller they produce smaller anisotropies the size of the anisotropies is nothing other than this h dot multiplied by the mean free path.
or some simple minded these wavelengths are very long compared to the mean free path and so you know the the integral equation that of uh for the for the frequency shift that uh Bruce uh wrote down is just the value of h dot multiplied by the little distance something along these lines is the side so you you start decreasing h the level of polarization is smaller so in fact um people have measured polarization has have looked at the at the uh amplitude of the curl have not seen any curl and on the basis of that have put some upper limit on the strain. Okay. And then we would have to get into did you expect a strain bigger than that smaller than that and then it will depend a little bit on the abracadabra that you're putting before and I'm happy to go you know offline on that because there there there are some expectations and some of which are perhaps uh the most reasonable of which have already been ruled out through this method.
I don't know the most reasonable is a very loaded because it's abracadabra stuff. So I don't know but uh anyway the canonical inflation model that people would have taught and probably I would continue to teach because it's the simple thing to do a calculation. So m² f² potential something that produces more gravitational waves than what have been the um any other questions? Yeah.
um it respects parity but it it respects parity now on average. So um in other words uh everybody here the average is going to be zero but also um respecting parity for the gravitational wave background would be that the typical the variance of this pattern and the variance of the opposite pattern have the same power. Right? It's not that you create a universe with a preferred handedness. So as much of this you would see as of the other pattern in the distribution. If you think of this the the value of this curl component it will be distributed in the simplest way as a Gaussian. The variance of this Gaussian for the curl part with one parity and the curl part with the other parity will be the same. In this way the gravitational wave background of the universe most probably um respects parity. It's about the abracadabra. It could you can create some abracadabra that breaks parity and then you would you have a preferred direction that question remember universe number one when you look at the sky in any direction you see a circular binary but it's oring counterclockwise.
I look over there and I see it orbiting right there.
I see I see the the circle and the plane that I'm looking at and it's counterclockwise. I look up there, it's counterclockwise.
That's the first time I look up there and it's rotating clockwise. That one over there rotating clockwise. That one over there rotating clockwise.
Ensemble is unpolarized. Any quantity that I calculate is equally likely one realization has it going one way.
The other realization has it going the other way. But any given instance, any given representative universe, it's completely certainly polarized. It might be right.
And so the variance, the deviation away from the average value, the average value across all universes become polarized. You have no access to that.
It's like my example value is one. So that's another way of example properties.
>> Yes.
>> Any any other questions? Yep.
>> The only thing that can cause or probably know about distinguish.
>> Yes. So, okay. So, here I can go into two um there's um the the the CMBB when we look at it there's foreground. So, you might ask the question is the polarization of something else the synchronous from our galaxy does it have both E and B modes or gradient and curl? Let me I can answer that offline if you want. Let's go back to just some primordial thing.
Okay. So it turns out that when you decompose um the most general fluctuations that you can think about um can be decomposed into three types called scalar vectors and tensors okay of the metric fluctuations. So it will turn out that this par through the similar um you know parity and symmetry arguments uh density fluctuations which is the scalar mode is the one that can only create those vector and tensors can create all of them. Okay. So in principle um if the universe is filled with something that creates a lot of tensor uh vector modes you will also create this pattern. In fact uh during a you know long time in in the in the field but long time ago as well people were uh having an alternative model uh for the origin of fluctuations which was not abracadabra from before the hot big bang but something happening there like a network of cosmic strings or something like that. Those generate density vector modes and tensor modes and when you look they create both the E- modes and B modes and the B modes their origin is both the gravitational wave that they create and the tensor modes that they create. So um but in this context in which um in which um the fluctuations are produced from before the hot big bang and they were outside the horizon for a long time. You only the only thing that survives to this side are the density fluctuations and the tensor modes for reasons that I can go offline for. So there would be no vector. So, but in principle um you should look at other properties of the how the pattern on the sky changes when I change the uh wave number the the angular scale that will tell you which one it is but at the level of these also the B modes can be produced by by vector modes. Um any other question? Okay, it's not raining or at least not as badly that I can see it from here. So maybe it's a good time and I'm also super. So let's finish here.
Up Next

3:58
Cosmic Inflation Confirmed: Gravitational Waves Detected
@SciShow
468K views•2014-03-20

12:53
21cm Hyperfine Transition in Neutral Hydrogen: Radio Astronomy Basics
@AaronRobertParsons
12.4K views•2011-10-13

87:36
Introduction to Plasma Physics: Magnetohydrodynamics Basics
@videosfromIAS
98.5K views•2016-07-19

27:14
Entropy and the Second Law of Thermodynamics Explained
@veritasium
27.5M views•2023-07-01
Related Study Plans & Knowledge Roadmaps
Structured learning paths in Physics
physics
Nuclear Physics (Decay, Fission & Reactors)
01Atomic Structure and the Binding Force
02Radioactive Decay and Half-Life
03Nuclear Fission Mechanics and Chain Reactions
+ 2 more learning modules
12h5 modules
Explore Roadmap
physics
Soft Matter (Polymers, Colloids & Rheology)
01Foundations of Soft Matter & Thermal Forces
02Polymer Physics and Macromolecules
03Colloids, Surfactants, and Self-Assembly
+ 2 more learning modules
38h5 modules
Explore Roadmap
physics
Analytical Mechanics: Lagrangian & Hamiltonian
01Mathematical Foundations: Calculus of Variations
02From Newtonian Mechanics to Constraint Dynamics
03The Principle of Least Action & Lagrangian Mechanics
+ 3 more learning modules
28h6 modules
Explore Roadmap
physics
General Relativity (Spacetime & Cosmology)
01Foundations of Relativity: Special Relativity
02The Geometry of Spacetime: Equivalence Principle & Curvature
03Einstein's Field Equations: The Mathematics of Gravity
+ 2 more learning modules
55h5 modules
Explore Roadmap