











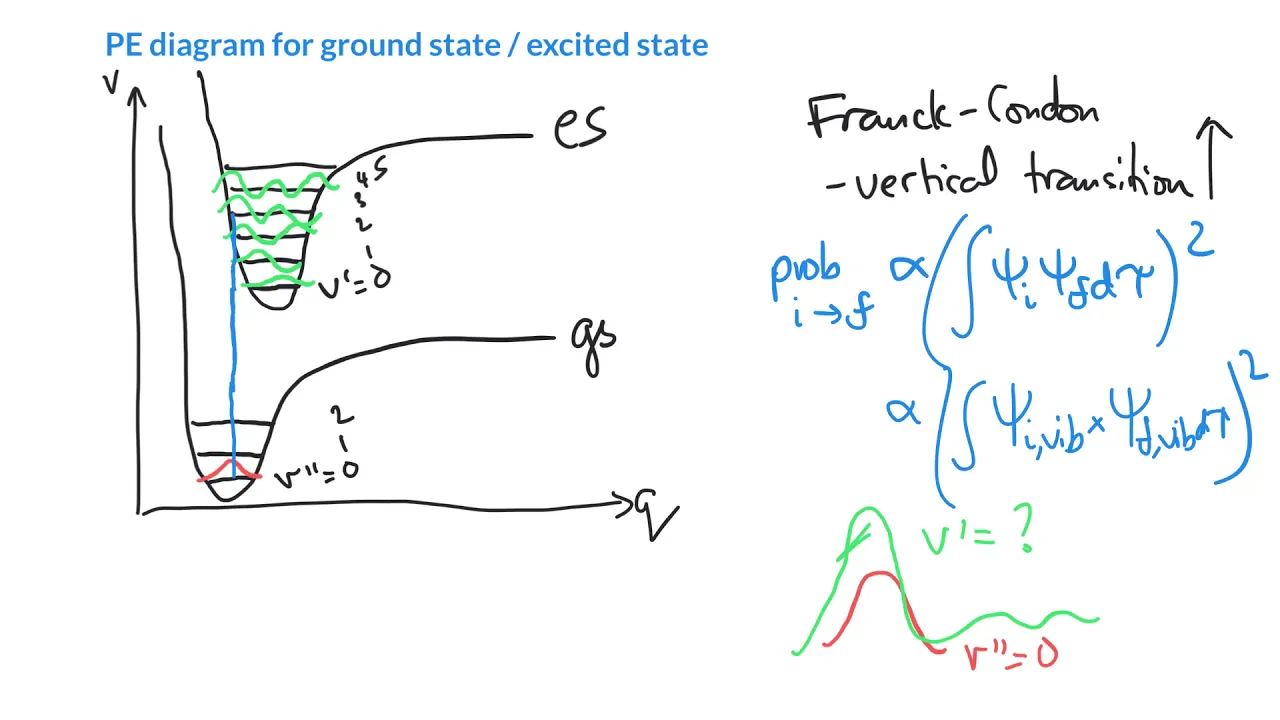


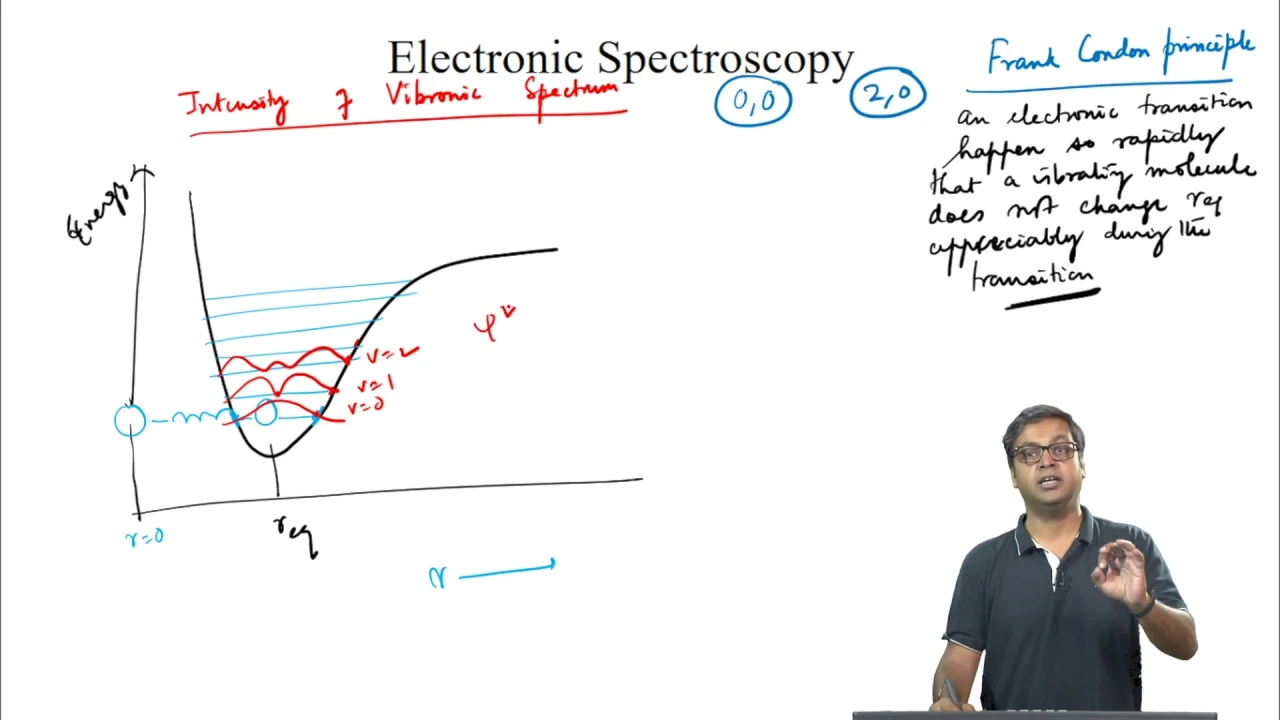

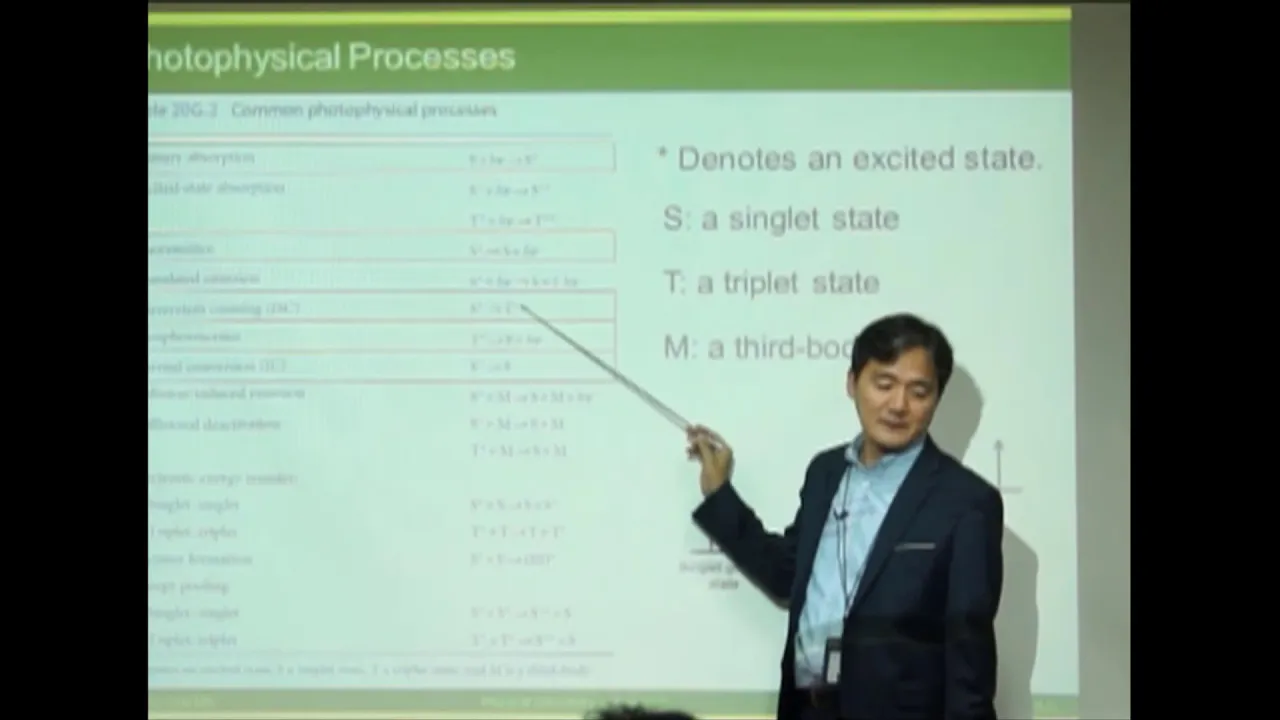



Jablonski diagrams are simplified energy level diagrams that represent the electronic states (singlet S and triplet T) and vibrational levels of molecules, used to understand electronic spectroscopy in the UV-visible range. These diagrams illustrate how excited molecules can relax through various pathways: non-radiative relaxation via internal conversion (same multiplicity) or intersystem crossing (different multiplicity with spin flip), and radiative relaxation through fluorescence (fast, same multiplicity) or phosphorescence (slow, different multiplicity). The Franck-Condon principle explains that electronic transitions appear as vertical lines because they occur faster than nuclear motions, and the intensity of vibronic transitions depends on the overlap between vibrational wave functions of the ground and excited states.
Electronic Spectroscopy: UV-Visible & Jablonski Diagrams Explained
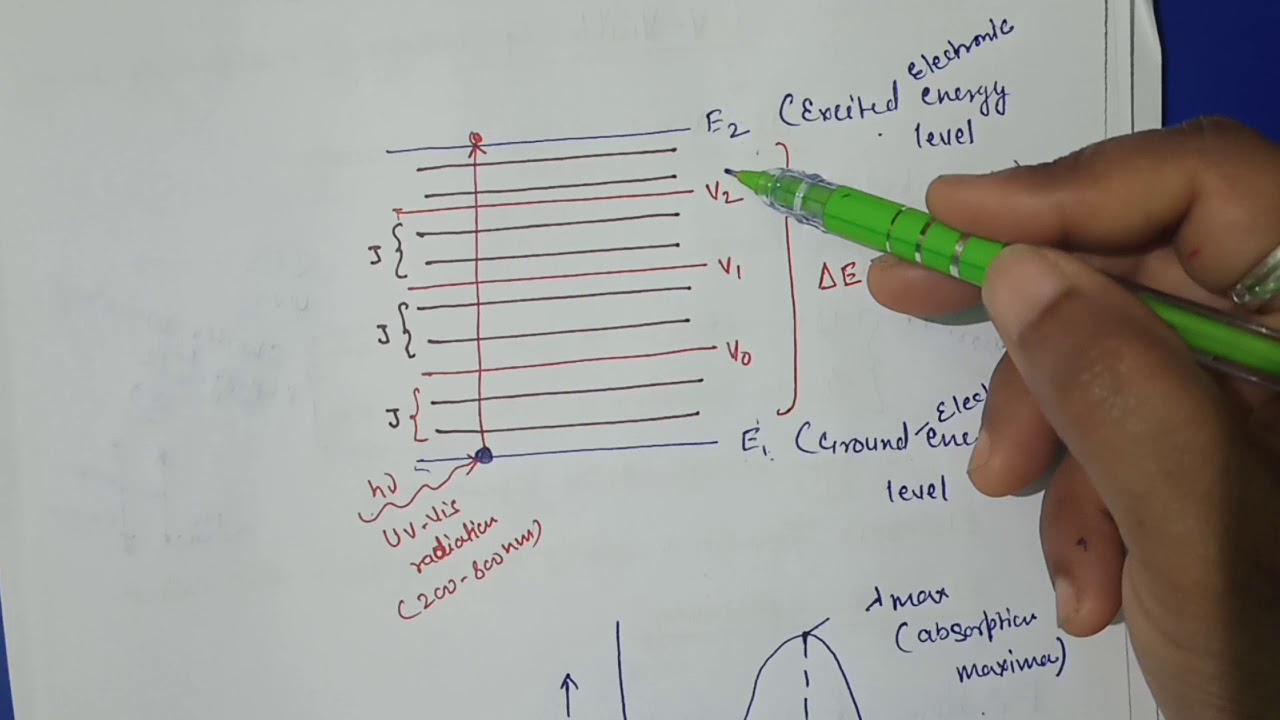
Added:so this is uv visible spectroscopy in the jablonski diagram so we have the let's think about these energy level diagrams that we've been drawing since the very first day of the class so for the particle in a box we would draw just an energy level diagram so i'll go ahead and do that as a summary uh figure here so particle in the box 1dpb can you understand that 1d particle in a box okay so we had energy we had n equals 1 n equals 2 and it was n squared so n equals three was was higher right and then we had row vibration where we had v equals zero j equals zero i'll put double primes on those and then j double prime equal to one okay i'm just going to show a couple of these because v equals one j prime equals zero e equals one j prime equals one so that's the row vibe energy level diagram so we've covered both of these we've done spectroscopy on both of these then we had a specific one called grotrian diagram so this one has a name and for let's do one like for helium where we had uh one s two and this one was one s two s and 1s 2p so that's enough to kind of show the helium one where we have electron configurations associated with each energy level for the atom and then finally today we have the jablonski diagram and so in this case we have like this long box with lines in it and that's called s0 and then we might have a box with a bunch of lines in it s1 and then i have another box with some lines in it we call it t1 and so this s's and t's and the jablonski diagram are not term symbols they're just triplet or singular so we're just calling the s's uh cingulate states or singlet states we're calling them with a capital s and for the triplet potential energy surface we're calling that a t and then we're labeling from bottom to top like the ground one is s zero but then all the others are ones like triplet one and singlet one triplet two singlet two so we're just labeling them from lower high with the quantum number and those little lines that are inside the boxes represent the vibrational energy levels remember we're dealing in a jablonski diagram with molecules and so does the vibrational levels are there's three and minus six of those and they're all overlapping and so this is energy so i just wanted to draw all four of these for you so that you can see that these are all energy level diagrams isn't that helpful so now you have all of the different types of energy level diagrams that we've focused on in the course and spectroscopy is always differences between the energy levels so whenever we have spectral lines it's always an arrow difference it's a transition from one energy level to another and that's the same in electronic spectroscopy only now we're going to be dealing with differences in the in the very complicated potential energy surfaces that molecules have but let's before we get into really complicated molecules let's just focus on diatomics and so let's start this molecular spectroscopy with the diatomic molecule and so here's the the diatomic molecule and there's a couple of things that are that are principles associated with uh transitions in electronic spectroscopy and that is this right here this born either born oppenheimer approximation or frank condon principle and that is this right here the electronic uh transitions occur much faster than the nuclear motions and so these are vertical transitions in this energy level diagram so what we have here is we have the potential energy these little curves that's the potential energy as a function of the nuclear coordinates and for a diatomic you just have the bond length so if you map the bond length on the x-axis and you draw the potential energy you see those surfaces where you have the bonding region is the minimum of that potential energy surface and so here you have the ground state molecule and you have say one atom fixed over here and the other atom is oscillating around this equilibrium position and that's the ground state wave function if you square that wave function then you get the position of that other nucleus on average okay and that's the v equals zero ground state so if we come in here and do an absorption transition so light comes in remember the square of the wave function is the probability distribution or the the most likely location of that of that um that bond distance basically the shape of that molecule so most of the molecules are going to be right here in terms of their nuclear distance right that's the most probable internuclear distance and at that point it lines up with this particular level up here that might be say v equals 15 v prime and so the most probable transition would be from b double prime 0 to v prime 15 because if you look at the upper state wave function notice it's no longer just a regular sine function it's got kind of a big lobe here and a big low boy over here but in the middle it's kind of small if you were to square this wave function you would have a huge probability of there being a population right here and a fairly large at the other turning point and then not so large in the middle this is kind of classical if you think about the positions of the of the nuclei you get out of the way of my hands okay so they're they're stretching right and they they stretch and they kind of stop and then they turn around and stop so with the at the heights of the stretching or compression they they stop and turn around and so they're more likely to be found in the stretched position than in the non-stretched position or the compressed position but in between they're moving very quickly so this does have somewhat of a classical feel to it right if you look at a ball on a pendulum it's swinging back and forth it's going to spend most of its time at the ends if you were to take a snapshot you're going to most likely get a picture of the of the um of the you know pendulum at its at its limits than down at the bottom [Music] and so this this kind of classical thinking does actually show up here in the quantum mechanics of the excited states right now at the ground state it spends most of the time in the middle and that's sort of a quantum effect but as you get higher and higher in vibrational excitation it starts to behave more and more classically anyway the point is this is a vertical transition and so the most probable transition is say in this case 0 to 15 and so that's going to be the peak in the spectrum with the highest intensity so what we're getting here is a measure of the intensity though the multiplication of this wave function times that wave function times light would give us that transition dipole moment integral and so if these wave functions overlap if there's a large area on this wave function that overlaps with a large area on that wave function then you're going to get a strong intensity so that we can draw the transition dipole moment integral like this so i did 0 i did h new for light in the middle and then 15 and i said that's large let's look at here here's the ground state vibrational level in the upper excited electronic state v prime equals zero and the zero to zero transition is small the reason it's small is because there's really no overlap between those wave functions there's just a little bit of this edge here that interacts with this edge of that one and you see the overlap of those wave functions is really small when compared to the overlap of this wave function and that wave function can you see that visually yeah so that overlap of the wave functions is the transition dipole moment integral so we're taking those weight functions times each other and if you have big numbers times big numbers you're gonna have a big result and if you have a big number times a tiny little number you're not gonna have a very big result does that make sense okay and so in in uh this rov this vibronic spectroscopy so vibration and electronic oh what you have is that um you've got this overlap integral or this transition dipole moment integral called the frank condon factor so it has a specific name in the electronic spectroscopy it's called the frank condom factor but it is essentially that transition dipole moment integral that we've been talking about since the first week of school so christian asked the question can i repeat that about the overlap with the two peaks okay so these are these are wave functions and i'll go ahead and change my pin color to show the the low intensity one okay so for the ground state wave function i've got this one is blue okay and notice it only overlaps with just this tiny corner down here and so when i take this wave function times that wave function i've just got small numbers times each other and so small numbers times small numbers are going to give a small result and when you integrate that small result over all space you're going to have a small intensity whereas the red peak the red overlap the red shading here on the ground state and the red shading here on the excited state those are big numbers times big numbers and they're going to give you a big integral result and so this transition dipole moment integral which is proportional to the intensity is large so this will give us a large peak does that help yeah okay he says thanks all right very good and so this is what's going on in electronic spectroscopy we have at least two things going on that we can see we have electronic transitions so the electrons are changing their quantum state we have vibrational transitions and so the vibrations are changing too the molecules vibrating differently and then we also have rotational which we rarely resolve so we have rho vibe and electronics so they call it rho vibronic spectroscopy and if you can't um resolve the rotational piece it's still there but if you can't resolve it they just call it vibronic so if you can resolve the vibrational levels on the electronic spectra like in the visible spectrum if you see vibrational bumps and that's vibronic trans transitions if you can't resolve the vibrations or the rotations it's just electronic spectroscopy even though all three things are happening so let's expand this uh potential energy diagram a little bit more and show that it depends upon the electron configuration and so this piece here in the middle and this piece here over on the left that's what we're going to cover in the last part of the course but what what gives us this energy level down here is the various bond orders that we have from the molecular orbital diagram and so we have bonding and anti-bonding orbitals from those electrons and as they come together they make a stronger or a weaker bond and a stronger or weaker bond is reflected in these potential energy surfaces and so when the when the mole when the atoms vibrate far apart then there's less interaction of those orbitals and so the bonding orbitals are weaker the anti-bonding orbitals are not as repulsive and so you end up with less of a potential less less of a less negative energy so less bonding and if you separate them out to infinity then you have no bonding so as you bring these together the electron clouds start to interact and there starts to be attraction and then you come down here through a minimum and then the atoms are too close together and the nuclei start to repel each other and so then you have repulsion and somewhere there's a balance between that attraction and repulsion and that would be the ground state and so that would be the ground vibrational state so these are different potential energy surfaces related to the electron clouds notice i've shown different populations of electrons this green box here the green potential energy surface corresponds to the green box right here and this green box shows you the ground state for the oxygen molecule where we have two spin up electrons in two separate pi star orbitals and that's the lowest electric lowest energy electron configuration for this molecule but what if we paired up that electron in one of those pi star orbitals well that would be this light blue one here so you see these electrons are now paired up and they're still in the pi star molecular orbital but that's a little bit higher in energy that would be called singlet oxygen this is triplet oxygen so we have two unpaired electrons two unpaired electrons add one more that's the triplet okay in this light blue one we have zero unpaired electrons add one that's a singlet so that multiplicity is the number of unpaired electrons plus one and so this light blue one corresponds to this energy here i could put both of those electrons up here in a sigma star orbital so it to be a singlet and so that's going to be this energy right here i could split them apart i could have one in the pi star one in the sigma star and that would be this yellow one down here and notice we we can give these um it kind of is all over the place in terms of the different symbols that we give these things um we give the ground state the x a a symbol of x and then we put the we can put the multiplicity up here in this diagram it shows it as a superscript after the x and then this one is indicating a singlet it's also giving the the um sort of a it's given the milliken notation in this case it's in lowercase it gives the greek character for that milliken notation so delta g or a1 um and then that's going to be a singlet state then we have that b1 state also the milliken notation this would be in d infinity age character table those are the milliken notations of those different ways uh different orbitals or overall wave functions and so then um the overall potential energy surfaces you'll see this when we get to the iodine lab that we have the x state and the a state and the b state and our transitions are going to go from the x state to the b state and so we're going to be going from x to b in iodine and so definitely want to look at that handout before you do the iodine lab we've got a couple of weeks before we get to it so these are the potential energy surfaces and notice how we've only got two atoms and it's already pretty complicated can you imagine we get to something like nitrobenzene or chlorobenzene or you know any of the larger molecules it just is very very difficult to to piece out what what the potential energy surface looks like not only that but you have uh you know what do you plot it against you have energy plotted by uh nuclear coordinates but which one do you pick for benzene you have 12 atoms and each of those has three coordinates x y and z and so you have 36 different x axes of which you could plot the y axis of energy against and so there's just no real way to plot those those uh potential energy surfaces so it gets very difficult when you get to things that are larger than diatomics to plot out the potential energy surface and so let's just sort of back away from that and try instead of trying to plot those real specific potential energy surfaces we're going to punt and just i'll show you some shorthand that we use let's think now though from absorption we get this molecule in an excited state let's think about the fates of those excited states so what happens to those excited electrons there's really four things that can happen it can have internal conversion where it moves from one potential energy surface to another with the same multiplicity so that means like singlet one to singlet zero or like triplet um two to triplet one but notice it's either t to t or s t s and then we also have inter-system crossing movement from one potential energy surface to another with the different multiplicity and so in this case it would be like an s to t or t to s i actually don't even need those little subscripts you can mark through those because they're we're just talking about the capital letters at this point so inner system crossing is when you go from t to s or s to t meaning triplet to singlet or singlet to triplet so what is happening in that case well when you're when your molecule is vibrating around let's say it's in a triplet state so you have both electrons are spin up or spin down the point is that they're the same direction and they're moving around on a triplet energy surface and they reach a gm geometry where they're also there's a an energy for the singlet state of that same geometry so the potential energy surfaces hit each other they intersect and there's the probability that one of those electrons can flip and now it's on the singlet surface and then it can move around to different places so the singlet surface and the triplet surface have different minimums and they also can can cross each other and so if the singlet and triplet surface cross each other that crossing is at a particular geometry for the molecule so we excite this electron we get it up into an excited state and then the vibrations are occurring in that molecule and they might vibrate to a place where they're also overlapping with a single surface and then electrons flips and now it's on the singlet potential energy surface notice that no radiation has been released so these are non-radiative all we have is a flip of an electron and now we're on a different potential energy surface so we're going from one surface to another and just think about these potential energy surfaces as um parking garage levels okay you've got different levels of the parking garage but are those parking garage levels level no they're kind of cockeyed sometimes and you can be on on level two and you can cross over to level one where they're where they're crisscrossing and and so you can walk across that spot and now be on a different level and you haven't jumped you haven't made any dramatic changes in energy so if you can picture that i can picture it in my head maybe you can okay but you've got these crisscrossing levels where you can drive up and and and sometimes you can cross over in the middle where they where they crisscross and you have the intersection of these different levels they're labeled with different labels but there's a place sometimes where you can walk from one to the other and and so you then you can move down the ramp so the geometry motions in the molecule are are sort of ramps in this potential energy surface and so this level might have a minimum here and this level might have a minimum here but they may intersect at a certain spot where the molecule can go from level to level without emitting light and that's called non-radiative relaxation both of these are non-radiative relaxation techniques or paths then we have the radiative relaxation so well we have dissociation i've forgotten about that so this is where we have a transition from one potential energy surface to another one and then that one doesn't have a minimum it's just the molecule falls apart and so that's also non-radiative so we can have um the molecule fall apart without emitting light we can have inner system crossing to a path or a potential energy surface that dissociates essentially dissociation involves an unbound potential energy surface so instead of a minimum it doesn't go through a minimum it just goes out to infinite distance and then we have the the radiative ones coming up phosphorescence and fluorescence we'll talk about predissociation in a second so these are the radiative pathways so we excite the electron it may change geometry or not but then it comes back down to the ground state by spitting out a photon so that would be fluorescence if there's no spin flip if there is a spin flip then it's phosphorescence so you can have triplet to singlet emission you can also have singlet to triplet emission so anytime there's a an emission event that is also a spin flip of the electron so it's going from singular to triplet or triplet to singlet then that's phosphorescence and the reason this has a long lifetime is because that's forbidden so they can't explain why it happens but it does happen slowly it may just be probabilistic meaning um it's technically forbidden but there's some sort of natural role of the dice that breaks the the rules or breaks the symmetry rules or whatever it is it's forbidding these transitions um but but it does happen but it happens slowly that's why it lasts those upper states last for such a long time and this is what all of your glow-in-the-dark toys are are using so this this uh you charge it up with light you're building those excited states and then they stay there for seconds to minutes and you sort of put that in the dark and then you can see that that energy flowing out of those molecules slowly over time and so you're seeing the photons that come out from phosphorescence so the phosphorescent effect is the glow-in-the-dark effect fluorescence can be very fast i mean 10 to the you know minus 10 seconds or so 10 to the minus 12 sometimes 10 minus 15. so singlet the singular dimension also triplet to triplet so anytime there's emission from the same spin so triplet to triplet or single with the singlet that's fluorescence so these are radiative because they're emitting light so that's what the main thing is we're looking at the face of the excited state so we excite the molecule what happens to that excited molecule it can work its way down non-radiatively by transferring to potential energy surfaces and making its way all the way to the bottom the ground state or it can reach a point where it has to emit light or prefers to emit light to get back down to the ground state and so this is what we have everything shown together we have absorption we have non-radiative relaxation which is released essentially as heat it is infrared so if we were to look with an infrared spectrometer we would see that emission so even though they say it's non-radiative they mean visible radiation so we don't see this transition in the visible so we call it non-radiative but the radiation is released in terms of heat notice those are vibrational transitions and so those show up in the infrared and then we have a visible fluorescence the the radiative transition down here so this is absorption of radiation this is non-radiative relaxation and then we have the emission of radiation again these are in the visible range so i'll draw a circle around these where we're dealing with electronic spectroscopy and then this is ir up here now here's an example of inter-system crossing so we have absorption comes way up here because of the frank condon factor so it's it's overlapping with this vibrational wave function it comes down that black potential energy surface and here notice these vibrational energy levels are very similar in energy so it's in this vibrational energy and it has a turning point that's the same spot on the blue potential energy surface so it transfers from the black surface to the blue surface and this happens to be a singlet to triplet transition so there's also a spin flip of one of the electrons when that happens and so there's a spin flip and then it now comes down to a lower energy level it comes down to here as to pose as opposed to this up here would which would be the ground state for this black one so it comes down to here and then it emits from this point so that would be phosphorescence and remember i just want to emphasize this every time fluorescence is fast and phosphorescence is slow and you can just think about it as a probability rolling the dice it's like getting uh you know like if you play yahtzee you got to get five of the same kind that happens much less than getting three of the same kind so fluorescence might be getting three or three of the same number and phosphorescence might be getting five of the same one and so it's going to take longer for that to happen this is a dissociation versus pre-dissociation notice if i um have this particular overlap of potential energy surfaces this part of the wave function down here actually would send the molecule up into this region here and notice there's no vibrational levels up here and so we don't see any of these vibronic transitions we just see a smooth continuum because if we excite the molecule to right here you can think of this classically like a ball rolling down a hill if i put a ball right here in this particular carnival game it's not going to get stuck in the bottom it's going to roll through there and have enough energy to dissociate can you see that y'all ever played i don't know i haven't seen this in a while but it's a it's a carnival game where you have a bowling ball on the hill and you're supposed to roll it up over this hill and get it stuck in this little minimum on the other side but but the geometry is such that the momentum of that bowling ball goes over the little hill up the back and then comes back over the little hill comes back to you and you don't win the prize and so you've got to find just the right height to give it just the right energy to get over the little hill and then not come back over the little hill and so you've got to find the frictional coefficient on the other side of that hill that is enough to slow it down between the little hill and the back ramp and and this is kind of what i think of when i see this if we have a molecule that's excited from this part of the wave function the left half of this wave function then it's going to have enough energy to dissociate when it's absorbed and we will see this in iodine when we're doing the iodine experiment we'll be labeling these transitions like this might be the the v double prime equals zero to v prime equals you know 12. okay and then this would be 13 14 15 16 17 18 19 20 21 22 and then get closer and closer together and then after 22 we don't see any more bumps and that's because we've hit the dissociation limit in iodine and so you're going to assign those vibrational peaks in the iodine spectrum now sometimes you're assigning these peaks v equals one v equals two so on and then you have this gap here where you don't see any vibrational transitions and then they pick up again now we won't see that in iodine but you do see that in some molecules and that's just because these vibrational levels here overlap with the dissociative potential energy surface and that's called pre-dissociation so you have not given the molecule enough energy to be directly dissociated but it hits an unbound state and you have uh either inner system crossing or uh conversion depending on if there's a spin flip necessary or not and then you have a dissociative state so that's pre-dissociation so that's also a non-radiative relaxation path and so now let's compare the spectroscopy of these two things so we have emission and vibrational spectroscopy so i've color coded this notice you have this green ground vibrational state and it's going to overlap with the excited states and so one of these is going to be the best overlap and so that's going to be the maximum so this maximum peak corresponds to this vibrational level right there okay and this one here corresponds to this one here okay so hopefully you can then see that all those peaks are up there and that's the absorption spectrum notice how these arrows are are longer so this is wavelength increasing in this direction so this is long and short so this is high energy over here low energy so the longer arrows so this will be the longest arrow transition so that would be this one up here so does everybody see that the absorption spectrum is at the short wavelength side this is a really important piece so the absorption spectrum is on the short wavelength side and the emission spectrum is on the long wavelength site so why is that well you have radiationless decay so you have the molecules that are excited drop down to the ground state ground vibrational state in the upper electronic state and so then now we have this red vibrational wave function and then it comes down and hits these levels so it's overlapping with the vibrational levels in the ground electronic state and so notice all of these arrows are shorter so this is a shorter arrow than the absorption arrows and there might be a little bit of overlap between the zero and the zero transitions and so you might have an up arrow that is this long and you might have a down arrow that's also that long and so that is the zero to zero transition so notice my notation here i have the double prime which gives us the lower state so the zero to zero when the arrow's going towards the prime so we're going lower to upper that's absorption and then when we're going prime to double prime that's the emission and they have the same arrow linked so they have the same frequency so the zero to zero transition is the only place where these can overlap that's the only place where the arrows can be the same length now if you're looking at this on the video or if you go back to look at this i want you to stare at this and listen to this slide over and over again until you understand why the zero to zero transition is the only place these spectra can overlap that's the only place where their arrows are the same length in the energy level diagram in all other absorption the arrows are longer so they're going to be at the short wavelength side and all other emissions the arrows are shorter so they're going to be at the long wavelength site so i'm going to pause there in case you want me to clarify can you see if we're in this ground vibrational state in the upper electronic state that all of these arrows are going to be shorter than that one right because they're hitting vibrational levels that are higher in energy there's there there's that arrow there's this arrow here it's going to hit that level and it's even shorter so it's going to be a longer wavelength this one is going to hit the next one it's even shorter than that and so it's going to be an even longer wavelength and so all of these emission peaks are at longer wavelengths than the zero zero and then all of these absorptions are going to be at longer arrows than the zero zero they're going to hit these levels here and those arrows are all progressively longer and the longer the arrow the larger the energy difference which means the shorter the wavelength now we we say look this is getting complicated with all these overlapping energy level diagrams so then we're going to show the drubolinsky diagram so that's what this is this is a shorthand for all of these potential energy surfaces and so this this blue box is representing the ground vibrational state so you see that s zero over there s zero is telling you the ground state is a singlet the zero means ground state s means singlet and so instead of plotting this by internuclear distance because when we get to bigger molecules what are we going to plot by the ch bond length the cc bond length the angles we have too many too many variables and so we just forget it all together and we just draw a box and we put in there all the vibrational levels and we don't care about their spacing we just show there's a bunch of vibrational levels in that box so do you understand what that box means it's the the bottom of that box is the ground state energy and then all of those levels above that are just the vibrational levels then we have this orange one here that's the singlet so see it's the black potential energy surface here this this is a singlet that's the ground state ground vibrational state for the singlet so that's the energy that's plotted up here and then we draw those levels just to integrate the vibrational levels in the singlet state and then we have the triplet state notice its energy down here the box stops at that vibrational energy level and so that's going to be shown over here as the triplet state so we're getting rid of the internuclear distance we're just drawing these boxes next to each other and the order really doesn't matter we could put s 0 on the left and s 1 on the right and t 1 on the right of that ok so that's the jablonski diagram it's just a simplification of these potential energy surfaces and we have no geometric information in it at all it's just an energy level diagram um and so let's talk about all the different things that we've covered in terms of the face of the excited states so this is um this is what's happening when we have absorption so we have blue light absorption wavelength absorption we call that the pumping the molecules to an excited state if we're going to do spectroscopy on this a lot of times we want a really bright absorption source and so we pump those molecules up then they can do several things there's four or five fates of those excited states so we can have inner system crossing we could have internal conversion and so on so it can like rattle its way down to the ground state in the in the cingulate state and give off a little bit of infrared heat and that's non-radiative relaxation it's just distributing that excited energy in the vibrations of the molecule and also you might have collisions and that gets rid of some of the energy then it can do inter-system crossing where it can go to the triplet state with the spin flip and so then it can rattle its way down in the triplet state still it's not emitting any visible light okay and so that would be or it could do enter it could do internal conversion and go all the way to the ground state so it could do this path so you see we have different paths it could go it could go here that was path one it could go here that was path two we could do another inner system crossing right here and get to the singlet state and go all the way to the bottom and so for this particular molecule there's a way for it to get rid of all of that energy without emitting visible light it could just heat up like crazy okay or it could it could um emit light either phosphorescence or fluorescence it could go straight from the s1 down to s0 so that would be the fluorescence pathway if it came from here straight back down that would be fluorescence or after that inner system crossing it could have a spin flip and an emission and that would be phosphorescence and that would give us visible visible light so here's all of your fates of the excited states put on one diagram and the difference between radiative and non-radiative we don't show dissociation on here but some of those states could lead to dissociation or predissociation so do you understand the jablonski diagram now it's just a simplified energy level diagram it shows the electronic energy levels and the vibrational energy levels and the vibrations we associate with non-radiative relaxation
Up Next

Photochemistry Laws Explained: Grothus-Draper to Franck-Condon
@pgchemistrylectures177
635 views•2022-11-25
Biocatalysis and Catalysis in Islatravir Synthesis | Merck Webinar
@SCIwheresciencemeetsbusiness
675 views•2020-10-08

Jablonski Diagrams & Electronic Spectroscopy | PES
@dw-pchem
226 views•2022-10-26

Edible Water Bottles: A DIY Guide to Sodium Alginate Spherification
@ryan
10.5M views•2019-06-21
Related Study Plans & Knowledge Roadmaps
Structured learning paths in Chemistry