










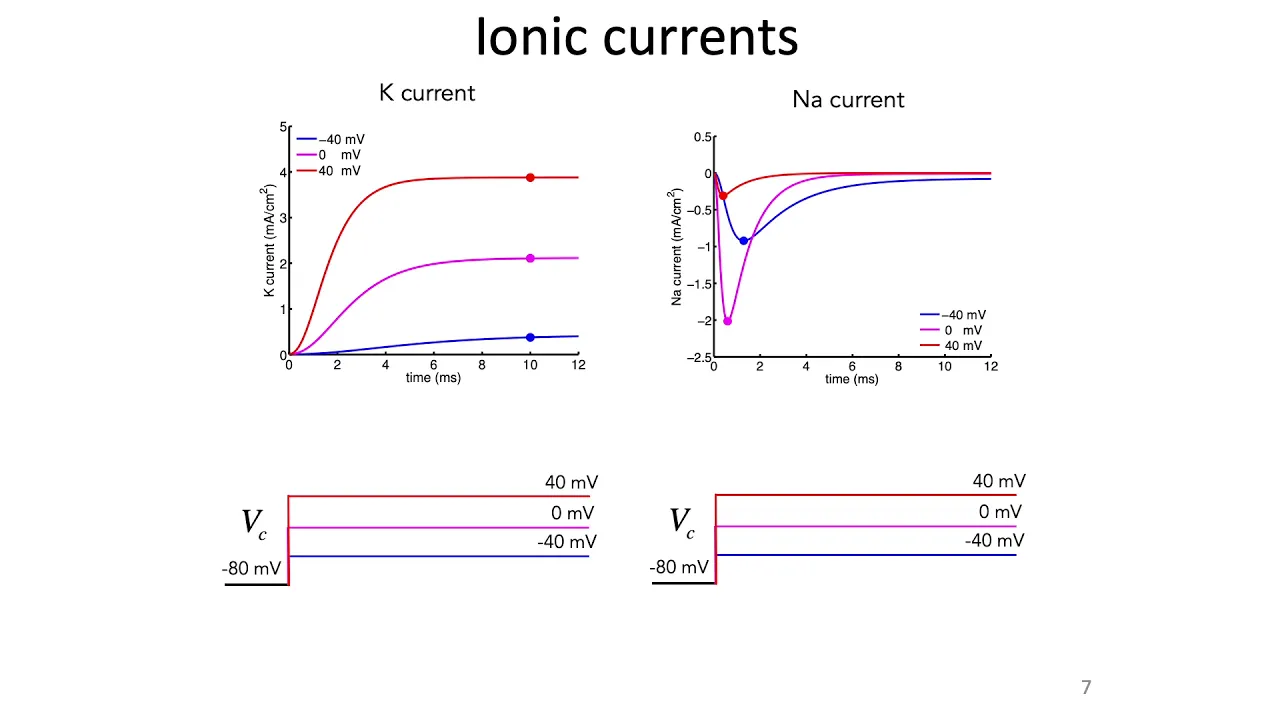


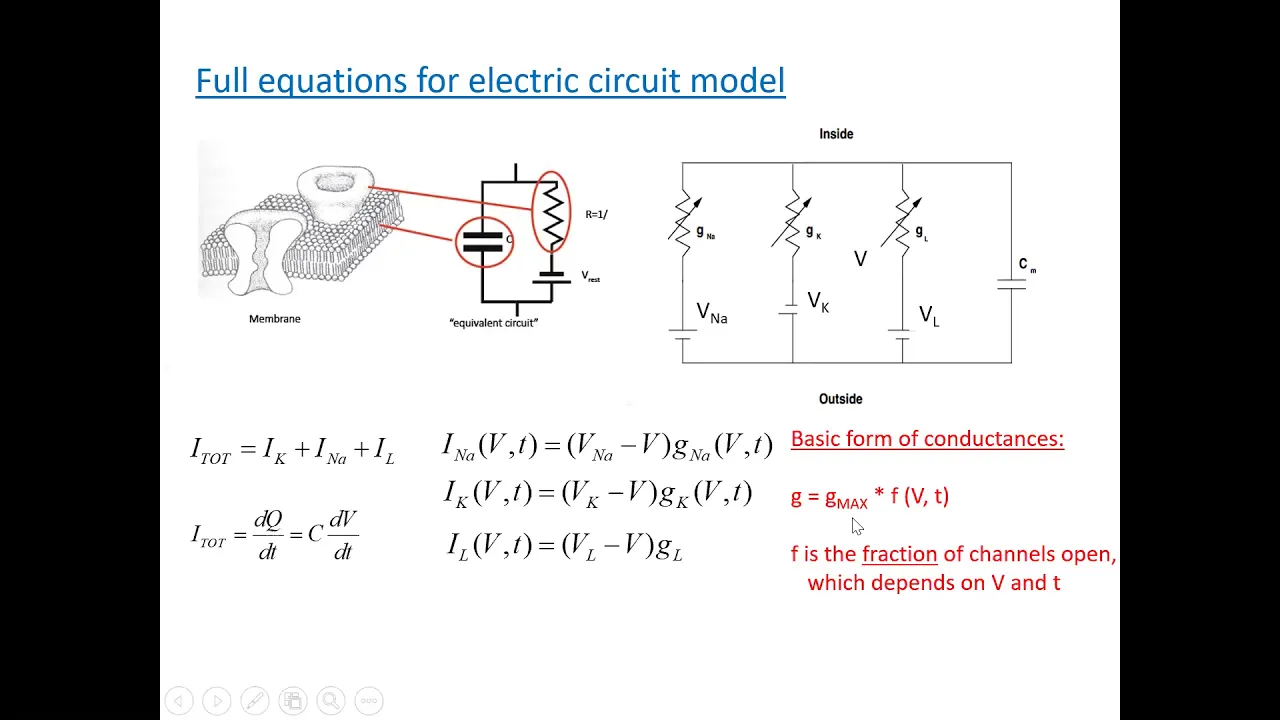


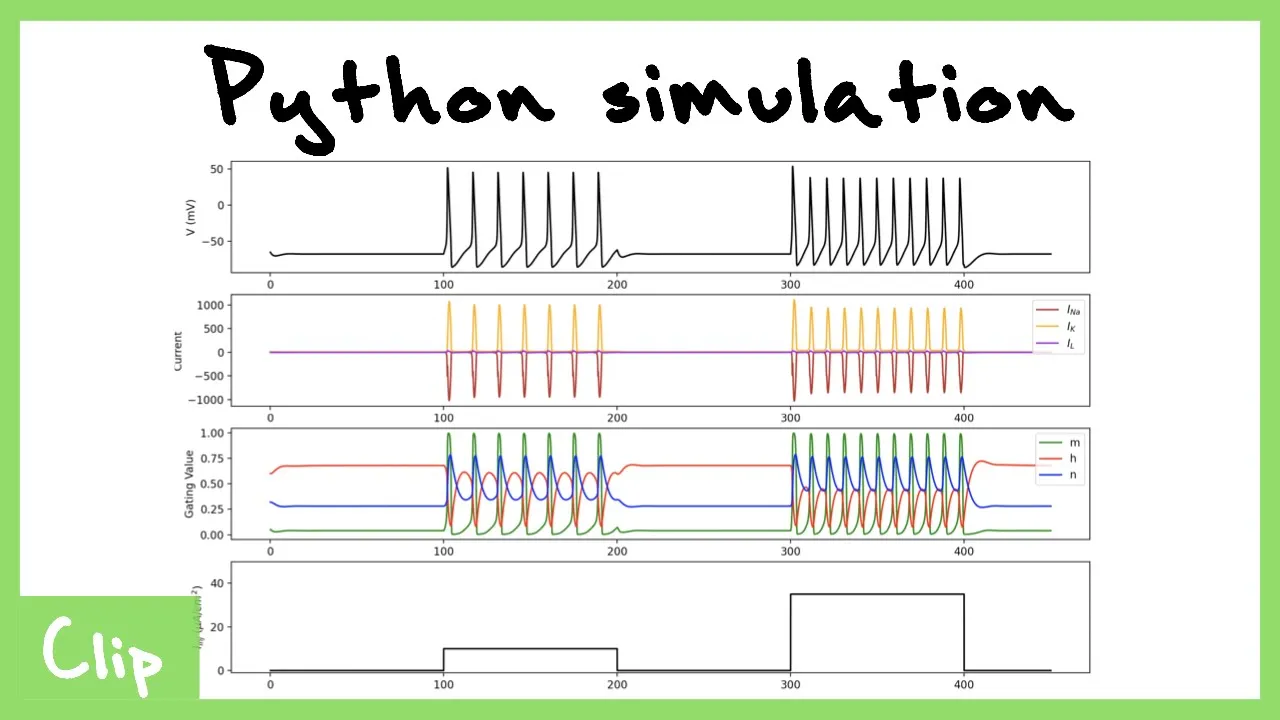

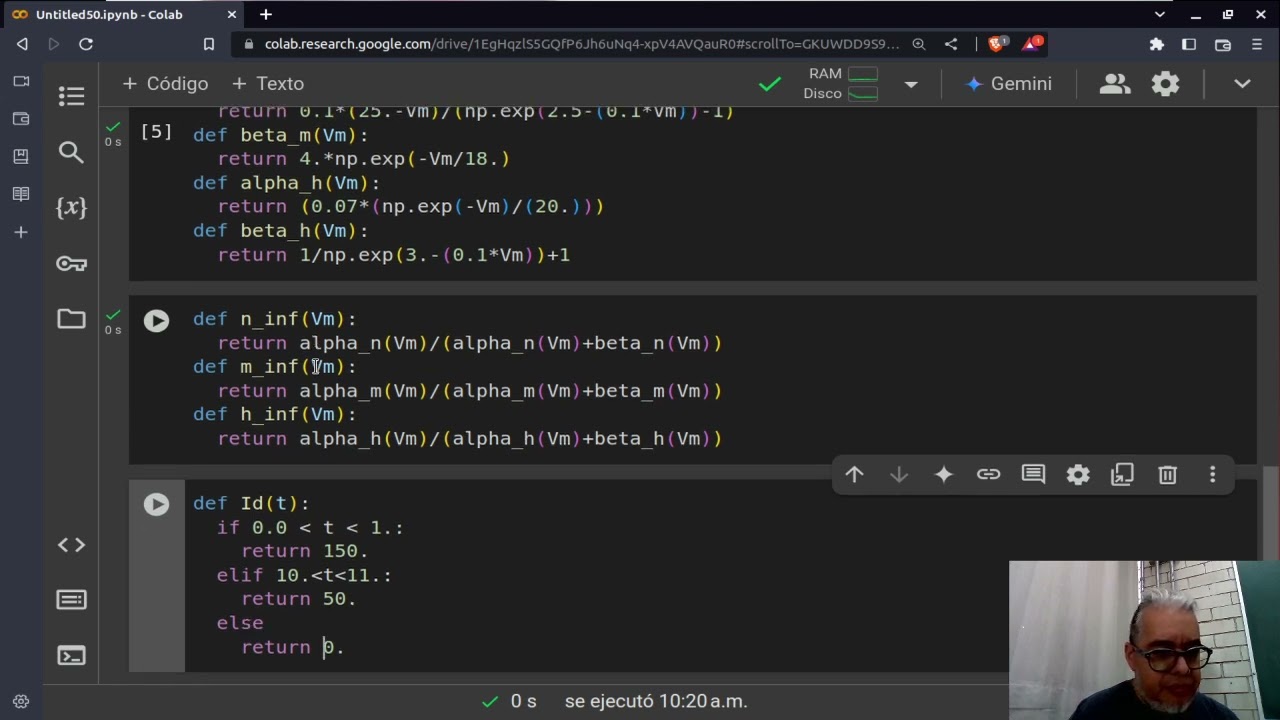










The Hodgkin-Huxley model describes voltage-gated ion channels using probabilistic gating variables (n for potassium channels, m and h for sodium channels) that follow first-order differential equations with voltage-dependent rate constants; potassium channels open slowly and remain open (n⁴), while sodium channels activate rapidly but inactivate quickly due to the h gate, explaining the distinct kinetic behaviors observed in patch clamp recordings.
Hodgkin-Huxley Model of Voltage-Gated Channels: Gating Variables n, m, h
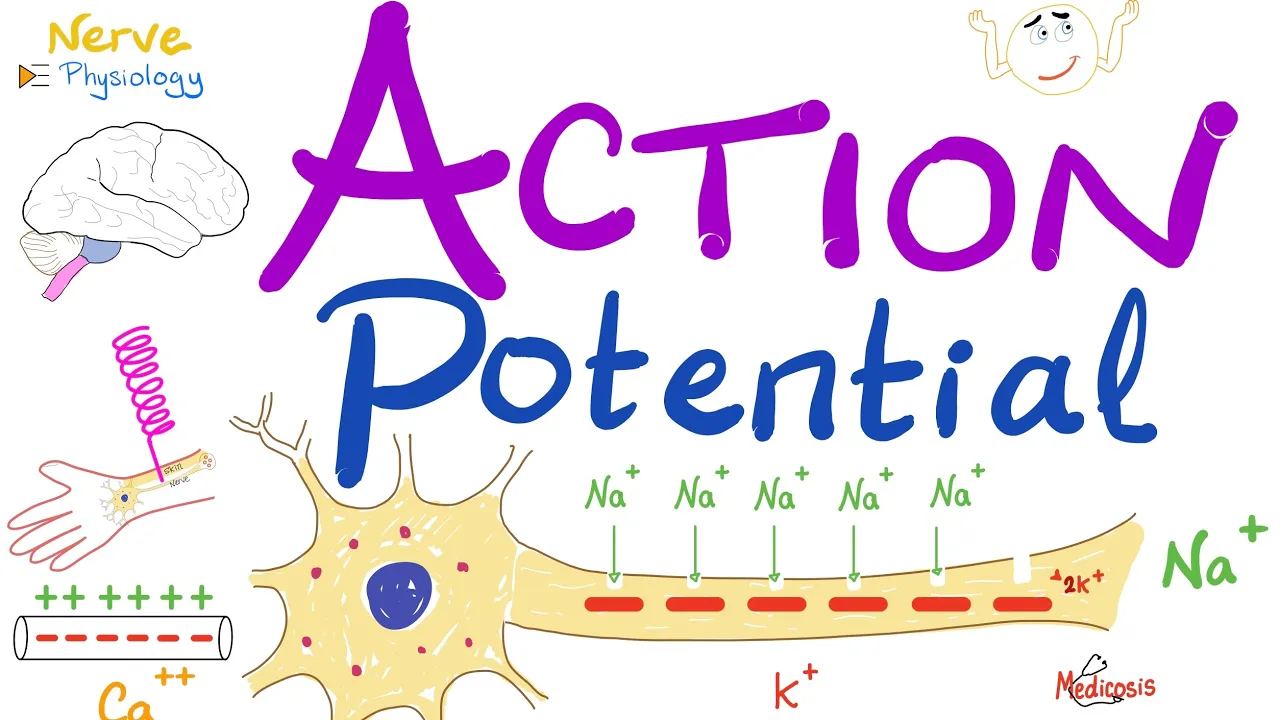
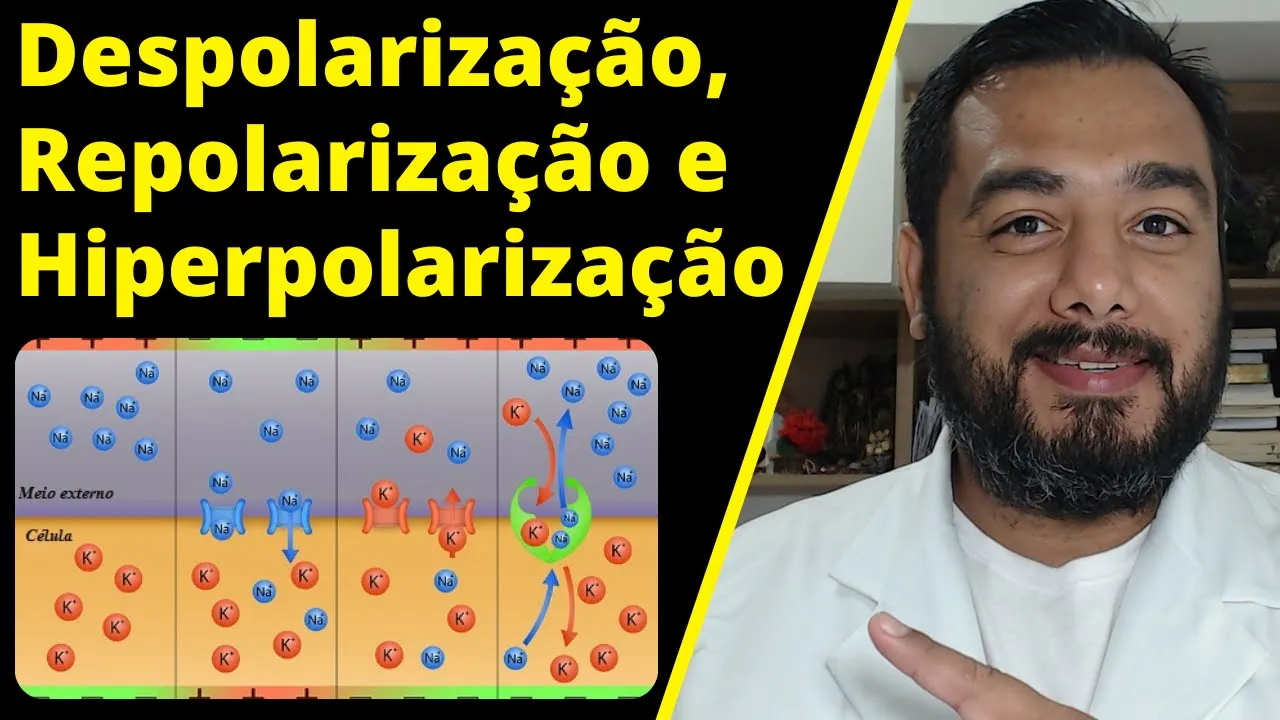
Added:Basic physiology of the action potential, including the phases of depolarization, repolarization, and hyperpolarization.
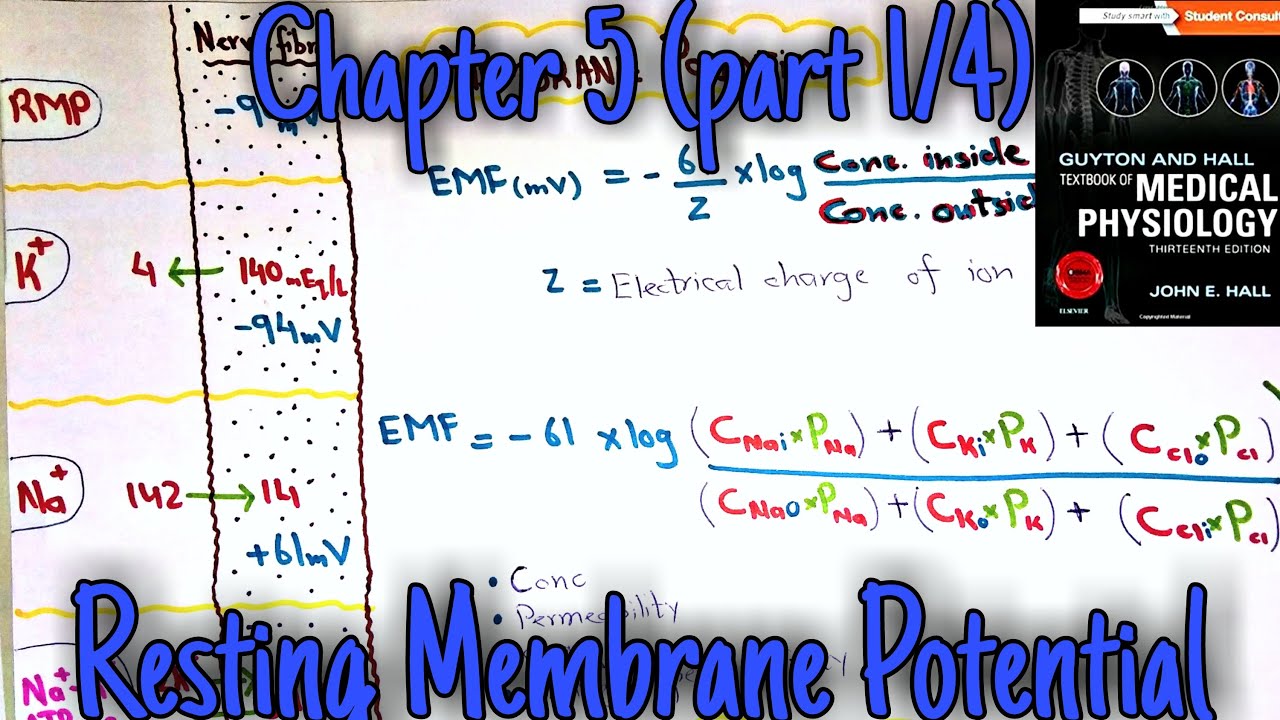
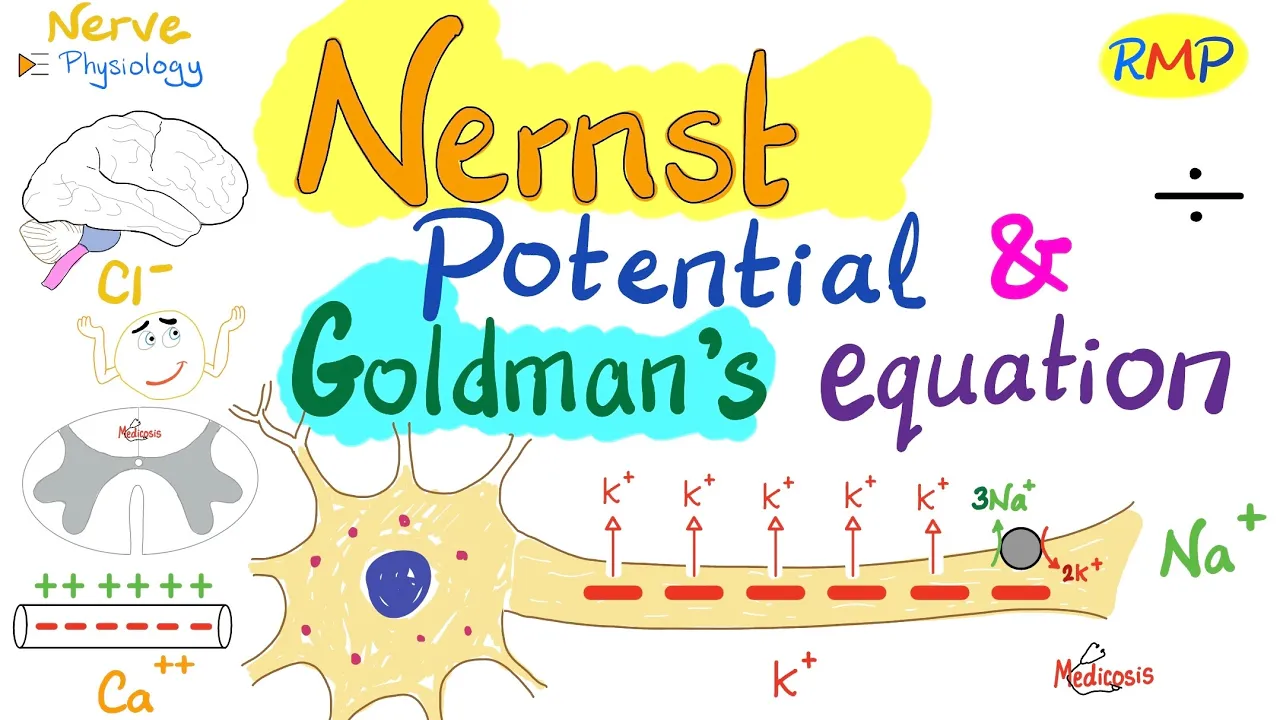
The concept of membrane potential, ionic concentration gradients, and the calculation of Nernst/equilibrium potentials for sodium and potassium.
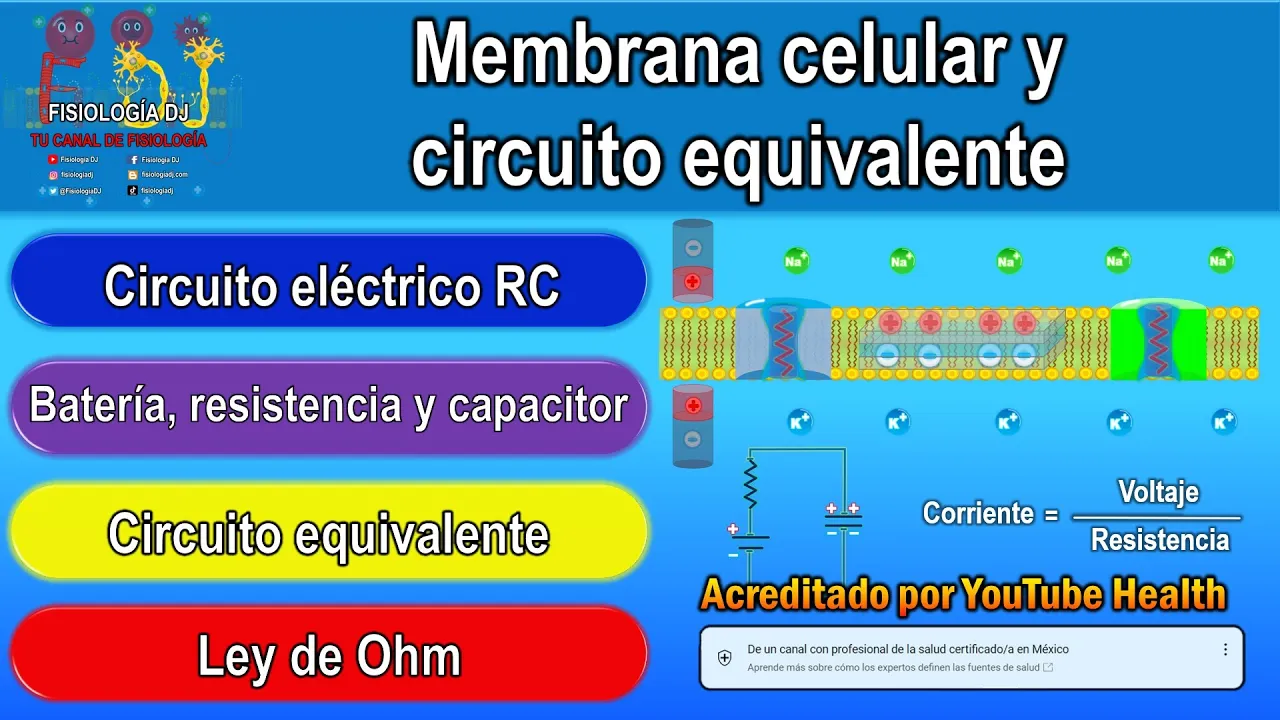
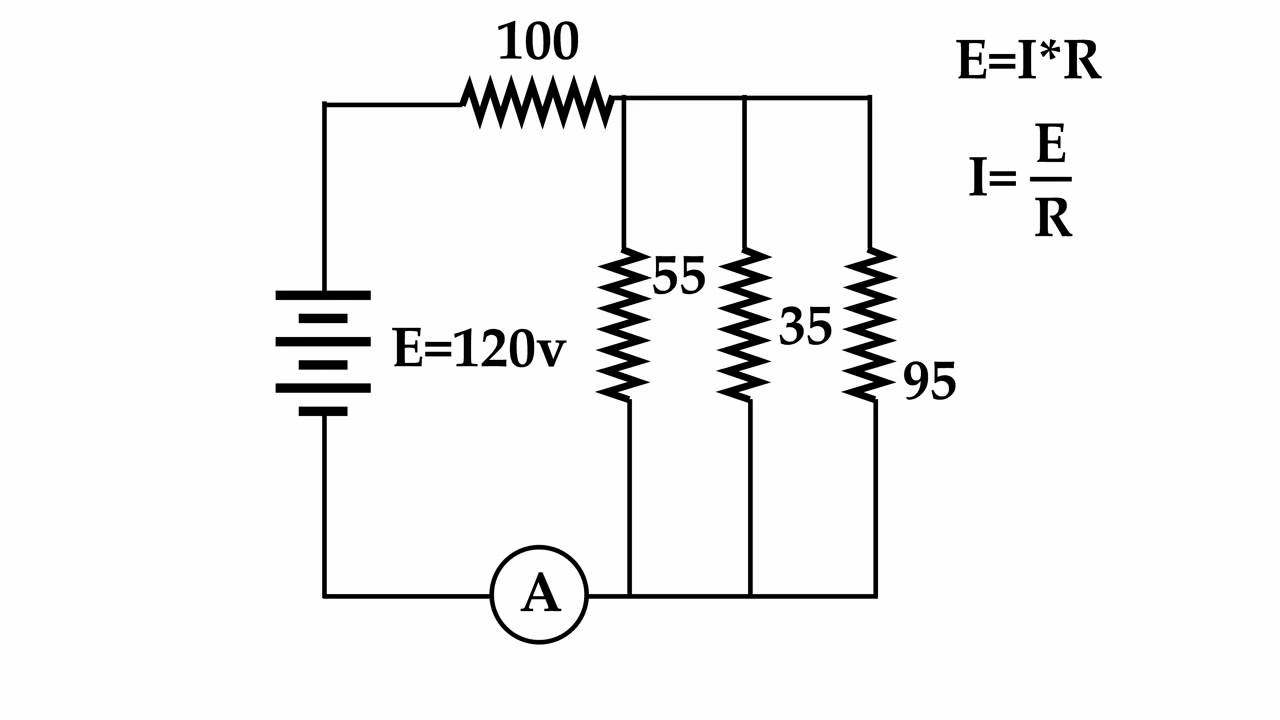
Fundamental electrical circuit concepts applied to biological membranes, specifically capacitance, conductance, resistance, and Ohm's law.
Introductory calculus, particularly how ordinary differential equations (ODEs) and rate constants describe physical changes over time.
The complete mathematical integration of the Hodgkin-Huxley model, uniting the gating variables into the total membrane current equation.
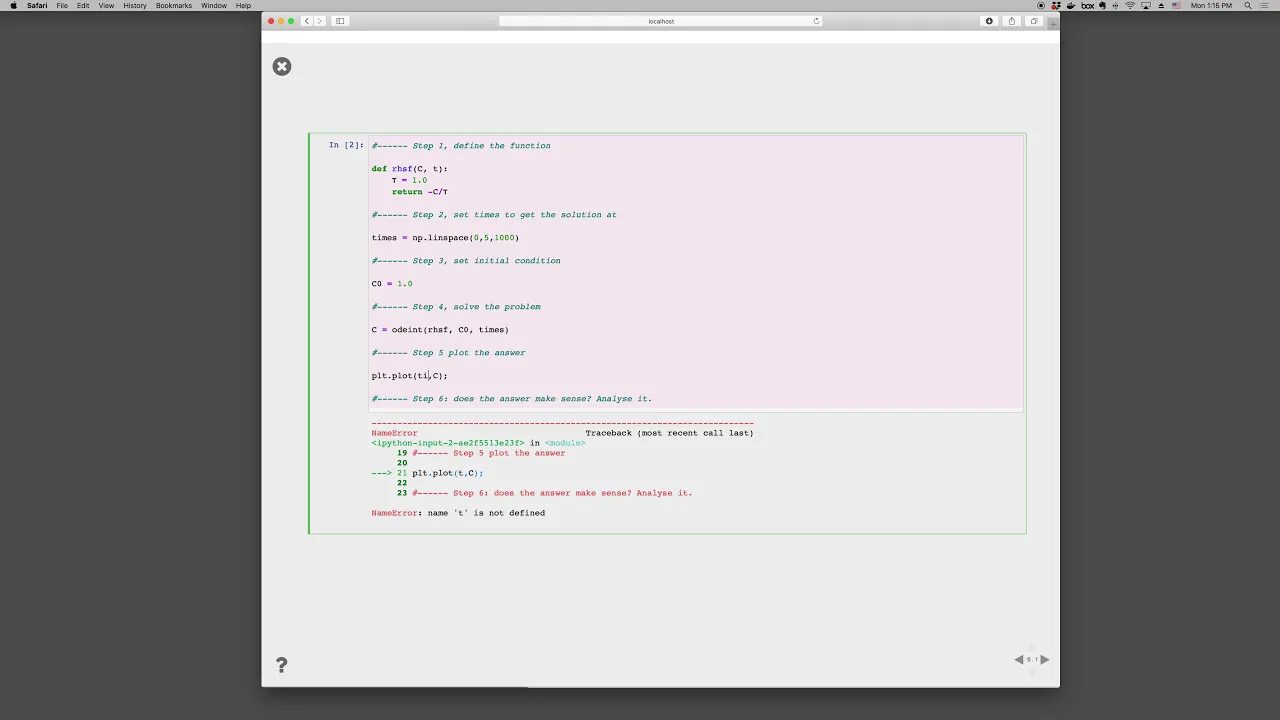
Computational simulation of neural activity, using programming languages like Python or MATLAB to numerically solve the Hodgkin-Huxley equations.
Simplified mathematical neuron models, such as the FitzHugh-Nagumo, Morris-Lecar, or Integrate-and-Fire models.
Pharmacological applications, specifically how neurotoxins (like TTX and TEA) and anesthetics selectively block or alter channel gating kinetics.
The study of channelopathies, examining how genetic mutations in voltage-gated channel proteins disrupt gating variables and lead to neurological disorders.
30.1K views572likes21:20Original Release: 2022-12-13
foreign [Music] now what is more interesting to us however is to see if the patch clamp method can give us a bit of insight as to why the macroscopic current from voltage-gated potassium channels is so different from the current coming from voltage-gated sodium channels it turns out that when one performs multiple Trials of the patch clamp experiment on both voltage-gated channels the individual currents coming from the channels have the same general differences the potassium current is delayed and sustained whereas the sodium current opens first and rapidly inactivates this entails that the difference we are looking for lies in the molecular structures of each voltage-gated Channel another important Point here is that with voltage-gated channels it now becomes tricky to make them an IV curve because as we saw the conductance changes as a function of time and voltage nevertheless we can arrive at a good model that explains both the time and voltage dependence of conductance if we first consider the molecular structure of voltage-gated channels so all voltage-gated cation channels generally have this repeated motive of six transmembrane Alpha helices termed S1 to S6 and an intermediary P region located between S5 and S6 in this Motif the S4 segment is thought to act as the voltage sensor because it contains a pattern of positively charged amino acids that are only present in voltage-gated channels the P region forms the selectivity filter which is basically the property of the channel that dictates which ions cross to get more information on the mechanism behind the selectivity filter remember that we have discussed how it works in our discussion about the general properties of the ion channels the voltage-gated channels for sodium calcium and potassium have four of these motifs one difference between these channels however is that voltage-gated potassium channels are tetramers meaning that the motifs aren't connected to each other we whereas voltage-gated sodium and calcium channels are linked together one particularity with sodium channels is that they have an important Motif named the inactivation motif we will later see how this Motif affects the channel alright now that we have a general sense of the structures Behind these channels let's examine how we can model the voltage and time dependence in the current equation let's first start with the voltage-gated potassium channels because they are a bit easier to understand in contrast to sodium channels the four large cylinders here correspond to the four motifs recall that ion channels generally have two states either closed like it is right now or open which requires a conformational change in the channel structure when the channel is open ions can flow through the selective port from the results of the voltage clamp experiments we know that voltage-gated channels are closed at rest for example when the membrane potential is at negative 70 millivolts and that they are open upon depolarization when the membrane potential is at let's say 10 millivolts the mechanism that opens and closes the channel comes from the voltage sensors at rest the positive charges in the voltage sensor feel the electric field generated by the negative membrane potential and thus are drawn to the intracellular side of the membrane when the sensor is in that position it induces a closed confirmation as the cell begins to depolarize the positive charges in the voltage sensors now feel repulsion from the cytoplasm and start moving towards the extracellular Matrix the change in conformation is believed to be responsible for twisting the alpha helices such that the P region of all subunits is in the correct conformation which opens the channel one very important thing to note here is that the voltage sensors do not all move together at the same time remember from the patch clamp recordings that the opening of ion channels is stochastic which means that even under a depolarization the channels can stay closed because the opening relies on the probability hence when we think of the conductance which relies on the channels being open we can describe it as the product of the probability of the channels being open times the maximal open conductance here represented with a capital G with a bar since the maximal conductance is a constant you will notice that now the voltage and time dependence have shifted on the probability when we consider the voltage sensors that make up the channel the same probabilistic nature applies for each subunit or Motif we can associate a gaining variable n which represents the probability that the subunit will be open or in other words that the voltage sensor is in the correct confirmation the probability of the channel being open requires that all four voltage sensors are in the correct confirmation and because the voltage-guided channel is attach rimmer we can assume that each subunit acts independently from each other thus the probability that the channel is open equals n to the power 4. by substituting this expression in the current equation we can obtain this new expression of the current this is a good step forward but obviously that did not solve our issue because it simply shifted the dependencies of the conductance onto the gating variable nonetheless the mathematical model becomes much simpler to obtain when we only consider the getting variable alright let's start by considering the time dependence for one getting variable only when we consider the probability n of a channel being open we can also consider that the probability to be closed is 1 minus n the change between the open and closed State can be modeled as a simple rate equation with two transition rates the First Rate alpha n describes the transition from close to open and the second rate beta n describes the transition from open to closed both rates have units of per second the time dependence here arises from the fact that the conformational change from close to open or vice versa involves thermal activation when Hodgkin and Huxley develop this model The two scientists assume that the rate of change of the getting variable with respect to time could be described as this first order differential equation at first glance this equation seems to come out of nowhere so let's take a moment to think conceptually about what it means first we can simply think of DN which is the change in the gating variable by itself the gating variable n corresponds to the probability associated with the open state hence we can broadly think of the change in that probability as the difference between the number of closed subunits that open and the number of open subunits that close therefore for a given change of time DT the number of closed subunits that open is simply the rate at which the closed gate becomes open times the proportion of closed subunits inversely the number of open subunits that close for a given change of time DT is equal to the rate at which the open gate closes times the proportion of open subunits with this we get the differential equation from Hodgkin and Huxley by rearranging the equation and dividing by alpha n plus beta n we can get this expression in which we can obtain two important values first we can consider the steady state solution which happens when the derivative of n with respect to time is equal to zero this leaves us with 0 being equal to alpha n divided by alpha n plus beta n minus n here we can establish a new quantity called n infinity which corresponds to the maximal probability of opening the gate at a steady state secondly we can establish a time constant Tau n which corresponds to the inverse of the sum between alpha n and beta n this term has units of seconds with these two new variables we can greatly simplify the differential equation to this expression this form of the equation is a bit more intuitive to understand basically this equation says that other than any fixed voltage the rate at which n is reaching the steady state value depends on the time constant if the time constant is large then it will take longer to reach the steady state value as opposed to a smaller time constant which will make the process quicker when we assume that the voltage is at a fixed value the solution to this differential equation corresponds to this before we analyze this equation in more detail remember that the transition rates alpha n and beta n greatly depend on voltage consequently n infinity as well as the time constant are also voltage dependent for that reason let's briefly cover the voltage dependence and then we will come back to this equation to properly analyze what all of this means in relation to the time dependence it is a bit more tricky to obtain the voltage dependence because when Hodgkin and Huxley were building their model they went with a data fitting approach meaning that they had a bunch of results for alpha n and beta n and they made up their own curve that would fit the results instead of directly deriving the equation the equations that they found for alpha n and beta n are the following with these last two equations we now have every tool to analyze the potassium current you will notice that some signs might be inverted with respect to the original paper this is simply to fit the voltage conventions that are used today all right so to put everything together let's plot the transition rates and n infinity as a function of voltage as well as n as a function of time for a given depolarization let's start with the transition rate curves according to Hodgkin and huxley's equations the shape of alpha n and beta n looks something like this as the membrane potential increases alpha n exponentially grows and beta n exponentially decays we know from a measurement standpoint that as we depolarize the cell the voltage-gated potassium channels start to progressively open so it makes sense that the rate at which the open increases and the rate at which they close decreases when we look at the curve of n infinity as a function of membrane potential we see the sigmoidal relationship that we have previously seen with the potassium conductance to see the relevance of this curve let me also show you the time dependent results so for a voltage clamp held membrane potential and infinity will be a constant since it only depends on voltage according to the solution we have and will relax exponentially as a function of time up to the value of n infinity evaluated at VM equals zero because we know that conductance is proportional to n raised to the power 4.
it is more fitting to show how n to the power 4 behaves as a function of time as you can see n to the 4 has a sigmoidal shape just like the shape of conductance as a function of membrane potential in relation to the data from the voltage clamp experiments we can Now understand that the sigmoidal behavior of the conductance directly comes from the behavior of n which is explained by all of these equations this is a good step forward but to understand more thoroughly the behaviors of these voltage-gated channels and ultimately the action potential we must now consider the behavior of the voltage-gated sodium Channel like we did for the potassium channels let me first start by explaining the molecular details and then we will jump into the mathematical model alright so just like voltage-gated potassium channels sodium channels can either be closed or open voltage-gated sodium channels however have a third functional state in which they inactivate the inactivation comes from the inactivation Motif which Bears positive charges and also feels some repulsion that repulsion will cause the motif to clog the channel and inactivate it thereby preventing ionic flow you will notice that in this model three out of the four subunits contribute to opening the channel and the fourth contributes to the inactivation now let's consider the individual subunits of the channel to build up the mathematical model just like for potassium we can rewrite the conductance in terms of a variable probability times the maximal sodium conductance in terms of single subunit probabilities we can attribute the letters M and H to the open State hence the closed State corresponds to 1 minus M and the inactivated State corresponds to 1 minus H since three subunits contribute to the open state from the closed State and one to the open state from the inactivated State our probability assuming Independence becomes M cubed times H as a side note remember that the structure of a voltage-gated sodium channel is not like the voltage-gated potassium channel the subunits are not separated into a tetramer and thus the mechanisms behind the channel do not technically function upon Independence but assuming Independence is good enough for a model anyhow with this equation we can get a new expression for the sodium current also with the same assumption that these states function on the basis of a reaction rate we can establish for each getting variable and Alpha and a beta transition rate here again the alpha rate goes from closed or inactivated to open and the better rate goes from open to inactivated or closed these transition rates now allow us to derive the same equations we have made for the voltage-gated potassium channels starting with the rate of change of the respective gating variable which allows us to find the time dependent solution here again the voltage-dependent relations of Alpha and beta for M and H were all found using the datafit approach all these equations now allow us to analyze the time and voltage dependence of the voltage-gated sodium Channel to keep things simple right now let's analyze the equations for M and H separately and then we will compare what they mean relative to each other to get a good portrait of the channel starting with M it is the easiest to understand because it behaves exactly like the gating variable for potassium again we know that upon depolarization these channels start opening so it is logical that the rate at which the channels open increases and the rate at which the channel closed decrease as a function of voltage accordingly M Infinity follows the same sigmoidal shape as n infinity we will later see how these curves compare to potassium because there are a few key differences in terms of time M also exponentially increases up to M Infinity under a clamped voltage and to get a better description of the entire channel one can consider M cubed as a function of time but we know that as a function of time and voltage the sodium current does not just steadily increase it should solve rapidly after activation this is where H becomes important let's start with the voltage dependence of H by plotting the equations derived from experimental data you can see that the curves for Alpha H and beta H are inverted relative to the transition rates of M and N consequently the graphs for H infinity and H as a function of time are also inverted the way to interpret this is that at rest the H gate is open and then closes as voltage increases due to the inactivation Motif clogging the pore of the channel on their own seeing these graphs gives good Insight but what I want to do right now is compare everything together to get a clear picture of what's going on so to tie everything together let's recall what we are aiming to explain from the voltage and Patch clamp recordings we have seen that the sodium current given by this expression yields a fast inward current that rapidly inactivates and the recordings on the potassium current yields a delayed outward current that persists as long as the depolarization is maintained to set the Baseline let's Briefly summarize the variables from the potassium channel in terms of getting variables the potassium channel has only one which is n the transition rates alpha n and beta n have this relation in terms of voltage where as the membrane potential got more positive the rate Alpha to open the channel increased and the rate beta to close the channel decreased when we plot the steady solution as a function of voltage the curve for n infinity is sigmoidal at a fixed voltage the time relation caused by the thermal fluctuations behind the conformational changes result in the actual value of n to exponentially relax to the value of n infinity As Time advances now for the sodium Channel as I've said previously when we consider M it behaves just like n the main difference however is that relative to the rates of potassium alpha n and beta M grow and Decay much faster as a result the sigmoidal shape of M Infinity is more steep than the curve of n infinity and thus explains why sodium channels open before potassium channels in terms of time M reaches M Infinity much faster and thus also illustrates how sodium channels open first when it comes to age you will notice that when we look at H Infinity it is very high at negative potentials which means that the inactivation gate is open at rest for the entire sodium channel to be open both M and H need to be open the issue is is that as voltage increases H decreases and M increases for that reason the maximal probability that the channel will be open will occur at a voltage where the two maximal values meet which will be somewhere around negative 20 millivolts as a function of time the same relation happens the age gate starts high and then progressively the case whereas M progressively grows if we consider the shape of M cubed times H you will notice that in the rising phase while H is high and M Rises their product Also Rises but after some point when H starts to considerably decrease relative to M the value goes back to zero even though m is high notice that the shape of M cubed times H is what gives this complex shape to the conductance of sodium now for us because we know what the molecular structures of the channels are the inactivation process of sodium and the sustained current from potassium seem trivial but you have to imagine that Hodgkin and Huxley did not know anything about these structures yet they managed to accurately model the currents from sodium and potassium because their results fitted when they used n to the 4 and M cubed times H so even though they did not know what the structures of voltage-gated channels were they were still able to accurately describe the physiological process behind the action potential which we can now do as well given the information we have on the channels foreign [Music] thank you for watching this video if there was anything unclear or there was a mistake somewhere in the video make sure to let me know in the comment section if you enjoyed this video and found it useful you can consider leaving a like and subscribing to support the channel on the right you will see the informational resources that I've used to produce this video thank you again for watching and I'll see you in our next discussion foreign
Up Next
7:22
Deriving Mean and Variance of Continuous Probability Distribution
@jbstatistics
338.4K views•2012-12-28

4:43
Elliptic Curve Cryptography Explained: ECC, ECDSA, ECDH
@PracticalNetworking
28.5K views•2024-10-21

10:44
Fourier Series Introduction: The Big Idea Explained
@DrTrefor
387K views•2021-05-03

6:00
The Mathematical Impossibility of Accurate World Maps
@Vox
23.3M views•2016-12-02
Related Study Plans & Knowledge Roadmaps
Structured learning paths in Mathematics
mathematics
Tensor Calculus: Vectors to Riemann Curvature
01Mathematical Foundations: Linear Algebra & Calculus
02Covectors, Dual Spaces, and Tensor Basics
03The Metric Tensor and Index Gymnastics
+ 2 more learning modules
40h5 modules
Explore Roadmap
mathematics
Gödel's Incompleteness: Logic, Proofs & Limits
01Introduction to Formal Systems & Hilbert's Dream
02Set Theory, Cardinality, and Cantor's Diagonal Argument
03Arithmetization and Gödel Numbering
+ 2 more learning modules
14h5 modules
Explore Roadmap
mathematics
Galois Theory: Fields, Groups & Solvability
01Foundations of Abstract Algebra: Groups & Fields
02Polynomials & Field Extensions
03Splitting Fields & Symmetries
+ 2 more learning modules
24h5 modules
Explore Roadmap
mathematics
Non-Euclidean Geometry: Models & Geodesics
01Euclid's Fifth Postulate and the Birth of New Geometries
02Hyperbolic Space and the Poincaré Disk Model
03Geodesics: Defining Straight Lines in Curved Spaces
+ 2 more learning modules
15h5 modules
Explore Roadmap