Mangrove ecosystems serve as crucial blue carbon sinks, storing up to five times more carbon in their soils than tropical rainforests; scientists assess this carbon stock through three main pools—aboveground biomass (trunks, branches, leaves), belowground biomass (roots), and soil organic carbon—using non-destructive methods including alometric equations for tree biomass estimation, soil coring devices for depth-based sampling, bulk density analysis for organic matter calculation, and GPS technology for systematic data collection across measurement plots.
Measuring Mangrove Carbon: Field Methods for Blue Carbon Assessment
Added:Deep Dive
Understanding of the global carbon cycle, specifically how carbon is sequestered, stored, and released in biological sinks.
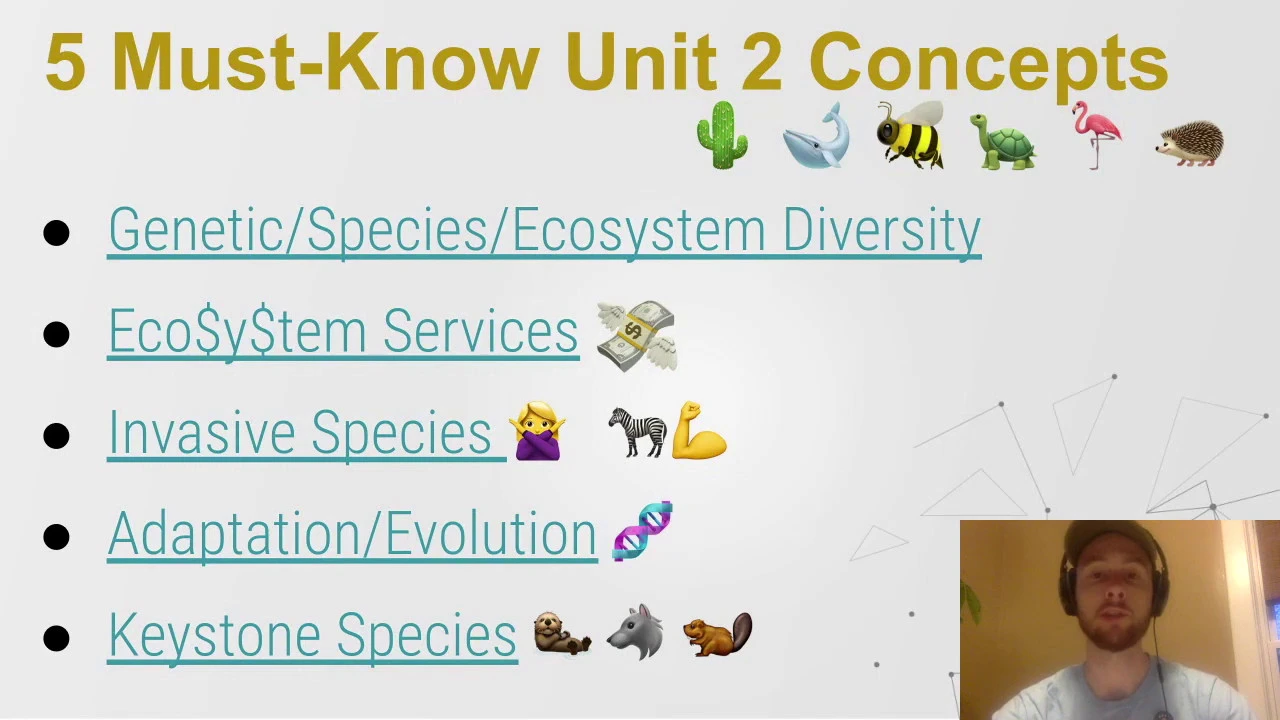
APES Exam Review | Must-Know Concepts For Every Unit
118.6K
In the carbon cycle, reservoirs are areas that store carbon for a period of time. Sinks are areas that can store increasing amounts of carbon over time. Sequestration is the process of storing carbon. Trees sequester carbon through photosynthesis, while fossil fuels store carbon for millions of years underground. The ocean also acts as a carbon reservoir, storing carbon in dissolved form and as sediments on the ocean floor.
Click to watch →

Crash Course O level Biology 21 Ecology
421
The carbon cycle maintains atmospheric CO2 levels through continuous exchange between living organisms and the environment. Carbon enters ecosystems through photosynthesis (plants absorbing CO2), feeding (animals consuming plants), and fossil fuel formation (dead organisms compressed into coal, oil, and natural gas over millions of years). Carbon returns through respiration (organisms releasing CO2), combustion (burning fossil fuels), and decomposition (decomposers breaking down dead matter). Carbon sinks store more carbon than they release: oceans absorb CO2 dissolved in water used by phytoplankton, with some becoming buried as fossil fuels; forests absorb atmospheric CO2 through photosynthesis, storing carbon in trees and forming coal from dead remains over geological time.
Click to watch →
ESS Topic 2 Ecology Compilation (new syllabus topics 2.1 to 2.5)
12.6K
Carbon stores include organic (forest biomass, soil organic matter, marine organisms, fossil fuels) and inorganic (atmospheric CO2, ocean carbonates, limestone) reservoirs. Carbon flows through biological processes (photosynthesis, respiration, decomposition) and physical processes (gas exchange, rock weathering). Carbon sequestration captures atmospheric CO2—tropical forests in woody biomass, peatlands in waterlogged organic matter, grasslands in root systems, and marine ecosystems (blue carbon) in mangroves, seagrass meadows, and coral reefs. Ecosystems act as carbon sinks (absorbing more CO2 than released) or sources (releasing more) depending on photosynthesis versus respiration balance.
Click to watch →
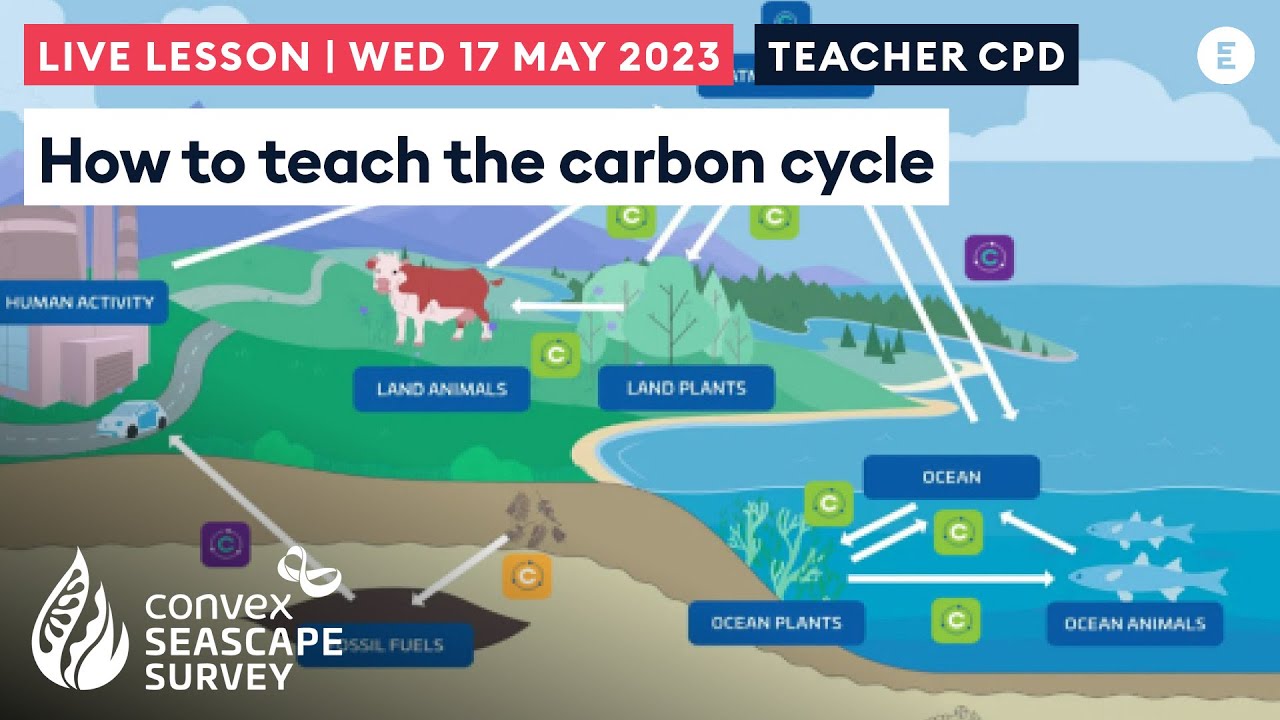
How to Teach the Carbon Cycle
294
Carbon stores are locations where carbon accumulates in bulk, like forests in wood and soil. Carbon sinks accumulate more carbon than they release, such as peat bogs where plant material accumulates faster than decomposition. Carbon fluxes are transfers between stores. Carbon sequestration captures and stores carbon, with rapid sequestration being crucial for slowing climate change. Understanding these terms explains how carbon moves through Earth's systems.
Click to watch →

Carbon sink
938
A carbon sink is a natural or artificial reservoir that accumulates and stores carbon-containing compounds indefinitely. Carbon sequestration is the process by which these sinks remove CO2 from the atmosphere. Natural sinks include ocean absorption through physicochemical and biological processes, and photosynthesis by terrestrial plants. Artificial sinks include landfills and carbon capture and storage. Natural sinks are typically much larger than artificial ones. The Kyoto Protocol promotes carbon sinks as carbon offset mechanisms, allowing Annex I countries with forests to issue removal units. Forests absorb 10-20 tons of CO2 per hectare annually through photosynthesis, though tropical forest estimates have limitations. The global cooling effect of forest carbon sequestration is partially counterbalanced by albedo changes, where mid-latitude forests have lower reflectivity during snow seasons, potentially contributing to warming.
Click to watch →
Deep Dive
Basic concepts of coastal ecology, including the definition of 'blue carbon' and the unique environmental conditions of mangrove ecosystems.
¿Qué es el CARBONO AZUL? | #TuManglar |
1.5K
Mangroves are unique amphibious plants that evolved from terrestrial palms and serve as critical 'blue carbon' ecosystems, sequestering carbon through photosynthesis and storing it in biomass, while also providing coastal protection, fish nursery habitats, and supporting local economies through fisheries and tourism.
Click to watch →
Will mangrove forests save us from climate change? - Assoc Prof Dan Friess
618
Blue carbon encompasses vegetated coastal ecosystems—mangroves, salt marshes, seagrasses, and tidal wetlands—that sequester carbon at rates exceeding most terrestrial ecosystems. This concept fits within a broader 'colors of carbon' framework including green (forests), teal (freshwater wetlands), and gold (macroalgae) carbon. Three criteria define blue carbon ecosystems: substantial greenhouse gas removal through sequestration, long-term carbon storage over climate-relevant timescales, and significant conservation threat. Blue carbon distinguishes itself through waterlogged soils that slow decomposition, allowing carbon accumulation in sediments rather than atmospheric release. Comprehensive carbon budget analysis must account for all fluxes including atmospheric uptake, sediment deposition, tidal exchange, and respiration to determine true sink status.
Click to watch →

Webinar Nasional Seri #306 “Mangrove, Benteng Pesisir di Tengah Perubahan Iklim”
10.7K
Mangroves are classified as blue carbon ecosystems because they grow in marine/coastal environments and capture and store carbon from the atmosphere. They store carbon at rates 10 times higher than terrestrial forests. The term 'blue' distinguishes these marine-based carbon sinks from 'green' carbon stored in terrestrial forests. Blue carbon ecosystems include mangroves, salt marshes, and seagrass beds, collectively storing significant portions of global carbon.
Click to watch →

Manual de Ecosistemas de Carbono Azul Parte 1
450
Blue carbon ecosystems include mangroves, marshes, and seagrass meadows, which are coastal habitats that store significant amounts of carbon. Mangroves are trees that live in saltwater environments with unique adaptations: they absorb saltwater through their roots and filter out the salt, releasing it through their leaves as visible salt granules. Marshes are wetland plants with green stems that grow in areas where tides periodically cover and expose the land. Seagrass are underwater flowering plants that grow in clay and sandy ocean floors, serving as nurseries for juvenile shrimp and other marine species. These ecosystems are crucial for carbon sequestration and marine biodiversity.
Click to watch →

UP Police Static GK Marathon | पर्यावरण, UP Police Special GK By Ankit Sir
25.8K
Blue carbon refers to carbon captured and stored by marine and coastal ecosystems, including mangroves, seagrasses, and salt marshes. These ecosystems store carbon in their biomass and sediments at rates much higher than terrestrial forests. Blue carbon is crucial for climate change mitigation and coastal protection.
Click to watch →
Deep Dive
Fundamental forestry measurement principles, such as measuring Diameter at Breast Height (DBH) and the concept of allometric equations.
Forestry(वानिकी),HORT -112 , FOREST MEASUREMENT (वन मापन) :- भाग :- 3🌲।। By -Bablu Dhaker,🌲L-22।।
4.4K
Diameter measurement is fundamental to forest measurement for calculating tree volume, which determines economic value. The standard measurement height is 1.37 meters (4 feet 6 inches) from ground level, known as breast height or DBH (Diameter at Breast Height). This height avoids complications from root swelling, disease, or irregular growth at ground level. Countries using 1.37 meters include India, Burma, Indonesia, Australia, and South Africa. Countries using 1.3 meters include FAO, European Union, UK, and Britain. The standardization ensures consistency across regions and facilitates international timber trade.
Click to watch →

How to measure tree diameters and dbh
18.1K
Diameter at Breast Height (DBH) is the fundamental measurement in forest inventories, taken at 1.3 meters height to predict tree volume, biomass, and carbon; however, since tree cross-sections are rarely perfectly circular, measurements can vary significantly depending on direction, and DBH serves as a practical compromise between measurement convenience and correlation with target variables, with tools including calipers (measuring straight-line distance) and diameter tapes (measuring circumference and converting to diameter via π).
Click to watch →

Allometric Equation | Field Diary | Nepal
471
Allometric equations are mathematical formulas used in forestry to estimate the biomass of trees based on measurable parameters such as diameter at breast height (DBH) and tree height, enabling researchers to calculate carbon stocks and support sustainable forest management without destructive sampling.
Click to watch →

Forest Measurements: DBH
9.9K
Diameter at Breast Height (DBH) is a standardized forest measurement technique where the tree trunk diameter is measured at approximately 4.5 feet above ground level; while stem calipers provide direct diameter readings, diameter tapes (D-tapes) are preferred because they measure circumference and automatically convert it to diameter using the mathematical relationship C = π × D, averaging out irregularities in tree trunk shape and offering greater portability for field measurements.
Click to watch →

Inventário Florestal Básico. Módulo 5: Dendrometria
776
Diameter at Breast Height (DBH), measured at 1.30 meters from ground level, is the most important and precise direct measurement in dendrometry. It correlates strongly with other attributes like height and volume, allowing estimation of these variables through indirect methods. DBH measurement situations include: normal flat terrain at 1.30m, inclined terrain (measure at tree level), forked trees above 1.30m (measure as single trunk), forked trees below 1.30m (measure each trunk separately), and deformed trees (measure above deformities). Tree height is an indirect measurement estimated using geometric methods based on similar triangles. Instruments include clinometer and Abney level (~$25), electronic clinometer (~$208), and laser devices (Vertex 50 ~$900, Vertex Laser Gel ~$1,900).
Click to watch →
Deep Dive
Introductory soil science, particularly the properties of anaerobic wetland soils, organic matter accumulation, and soil bulk density.
Section 5 4 Introduction to Wetland Soils
955
Hydric soils form under saturation, flooding, or ponding long enough during the growing season to develop anaerobic conditions. Under anaerobic conditions, microbes use alternative electron acceptors in sequence: nitrates, manganese oxides, iron oxides, and sulfates. This creates redox reactions where iron and manganese become reduced (bluish-gray) and then oxidized (bright orange-red) as water tables fluctuate. These oxidation-reduction reactions produce distinctive redoxomorphic features visible as color patterns, concentrations, or depletions. Anaerobic conditions slow decomposition, causing organic matter accumulation that makes wetland soils feel like water beds when walked upon.
Click to watch →
Plants in wetlands: An overview of their fundamental and applied ecology
108
Wetland soils develop unique characteristics due to anaerobic conditions. Oxygen diffusion through saturated pore spaces is extremely slow, allowing microorganisms to deplete available oxygen. This creates minimally oxidized surface layers with deeper anaerobic zones. Two main soil types exist: mineral soils with low organic matter and organic soils composed predominantly of accumulated plant material. Organic wetland soils store substantial carbon (approximately 50% carbon content in brackish marshes), making wetlands critical carbon sinks where decomposition is slowed by anaerobic conditions.
Click to watch →

ECOSYSTEM & BIODIVERSITY in ONE SHOT | All Concept, Trick & PYQ |NEET 2026
26.7K
In anaerobic conditions (without oxygen), decomposition slows down significantly. This causes organic matter to accumulate rather than decompose. This is why organic matter builds up in waterlogged soils and wetlands.
Click to watch →

Lecture 11. Soil Organic Matter-issues, concepts, composition, humus, and decomposition
730
Soil organic matter decomposition varies significantly between aerobic and anaerobic conditions; under aerobic conditions with adequate oxygen, warm temperatures (25-30°C), and 25% moisture, decomposition proceeds rapidly through oxidation to CO2 and water, with faster breakdown of sugars, starches, and simple proteins, while anaerobic conditions (waterlogged soils like rice paddies) result in slower decomposition, methane production, and greater organic matter accumulation due to reduced microbial activity and absence of oxygen for complete oxidation.
Click to watch →

Inland Wetland Delineation Training - Hydric Soils
3.2K
Hydric soils form under conditions of saturation, flooding, or ponding long enough during the growing season to develop anaerobic conditions in the upper 12 inches. Waterlogged soils become deficient in oxygen, which is essential for plant root respiration and microbial decomposition. This oxygen depletion causes organic matter to accumulate in the topsoil because decomposition slows down. The darker the soil appears, the more organic matter has accumulated, indicating prolonged wetness. Soils containing more than 20% organic matter by dry weight are classified as organic material rather than mineral soil.
Click to watch →
Prerequisite Knowledge
- Concept 01Understanding of the global carbon cycle, specifically how carbon is sequestered, stored, and released in biological sinks.
- Concept 02Basic concepts of coastal ecology, including the definition of 'blue carbon' and the unique environmental conditions of mangrove ecosystems.
- Concept 03Fundamental forestry measurement principles, such as measuring Diameter at Breast Height (DBH) and the concept of allometric equations.
- Concept 04Introductory soil science, particularly the properties of anaerobic wetland soils, organic matter accumulation, and soil bulk density.
Subsequent Learning
- Step 01Application of field-collected data to Geographic Information Systems (GIS) and remote sensing for regional-scale carbon mapping.
- Step 02Exploration of blue carbon markets, international carbon accounting standards (e.g., Verra, IPCC guidelines), and carbon offset policies.
- Step 03Design and evaluation of coastal restoration projects specifically optimized for carbon sequestration and biodiversity co-benefits.
- Step 04Advanced analysis of greenhouse gas fluxes (such as methane and nitrous oxide emissions) that may offset net blue carbon storage.
Carbon Banks
Core Sampling
Carbon Banks
0:00Playing Section
- 1
Explores mangroves as vital blue carbon ecosystems with high soil carbon storage.
- 2
Identifies three carbon pools: aboveground, belowground, and soil organic carbon.
- 3
Introduces non-destructive methods like allometric equations and soil coring.
The Lateral Flux and Trace Gas Offset Challenge
While traditional field methods for blue carbon assessment focus on quantifying static carbon stocks in mangrove biomass and soil, critics argue this approach overlooks dynamic lateral carbon fluxes and trace gas emissions. Standard field measurements often assume that organic carbon remains sequestered in situ. However, a significant portion of mangrove carbon is exported laterally into the open ocean as dissolved organic and inorganic carbon (DOC and DIC), or outgassed as carbon dioxide and methane. Furthermore, waterlogged, anoxic mangrove soils can be major sources of methane and nitrous oxide—potent greenhouse gases that can partially offset the climate benefits of carbon burial. Without accounting for these lateral losses and trace gas dynamics, localized stock measurements can lead to overestimations of a mangrove ecosystem's net atmospheric carbon reduction capacity. Consequently, some scientists advocate for shifting focus from static stock inventories to dynamic, flux-based monitoring systems that integrate automated sensor networks and eddy covariance towers.
Deep Dive
Application of field-collected data to Geographic Information Systems (GIS) and remote sensing for regional-scale carbon mapping.

Earth Observation and its role in Vegetation Carbon Pool Assessment by Dr. Sarnam Singh
422
Remote sensing and GIS technologies enable systematic stratification of forest areas based on vegetation cover type and density, informing scientifically-based sampling designs. Satellite data provides initial classification, while ground measurements validate and calibrate these classifications. The integration workflow progresses from satellite-derived stratification to field sampling, then to regression modeling that correlates spectral data with ground-truth measurements. Multi-season satellite data collection (February, May, October, December) enables selection of optimal imagery for each study area, improving classification accuracy. This integrated approach allows extrapolation from field plots to regional or national scales, producing comprehensive carbon maps essential for climate reporting and forest management planning.
Click to watch →
NASA ARSET: Carbon Estimation Techniques and Methods, Part 3/5
7.6K
The FIA program operates regionally across four US regions with common standards while allowing customization. Plots are distributed every 2,400 hectares using a hexagonal tessellation, with intensive plots measuring additional carbon-relevant attributes. Design-based inference uses post-stratified estimators to make unbiased population estimates from the sample, with uncertainty arising from whether population units are included in the sample. Landsat 7 ETM+ collects data in eight bands with 15-60m resolution and 16-day revisit capability. The WELD dataset provides pre-processed monthly composites spanning 2003-2012. Key processing techniques include harmonic regression using Fourier series to capture seasonal patterns, Tasseled Cap transformation for interpretable land cover analysis, and spatial resolution matching using 3x3 window averaging to integrate satellite-derived auxiliary information with ground plot measurements.
Click to watch →

Dr. Chad Babcock, Forest Resources Department Seminar, April 4, 2023
114
Practical implementation demonstrates how statistical frameworks produce actionable carbon estimates. Using statewide lidar data and field plots, geostatistical models generate pixel-level predictions with associated uncertainty intervals. Users can draw boxes around properties to obtain biomass density estimates (e.g., 21.49 Mg/ha with 95% CI: 20.69-22.29). Smaller areas show wider intervals reflecting greater uncertainty. At state scales with hundreds of FIA plots, design-based estimates already achieve acceptable precision. However, at county scales with small samples (15-30 plots), geostatistical approaches substantially reduce uncertainty by borrowing strength from neighboring areas through spatial random effects. The framework enables online tools where landowners input property boundaries and receive scientifically defensible estimates suitable for carbon market participation.
Click to watch →

Error propagation from field to LiDAR and spaceborne remote sensing data for carbon mapping
139
This section traces the evolution from conventional forest inventory approaches to modern empirical modeling. Traditional stratified sampling provides reliable total biomass estimates but fails to capture spatial distribution, while land cover maps inadequately represent biomass variability within classes. The GLAS-based empirical approach addresses these limitations by establishing direct relationships between ground-truth biomass measurements (from 40m x 40m field plots measuring trees with DBH >5cm) and satellite reflectance data. This methodology enables wall-to-wall biomass mapping across entire tropical regions, overcoming the impossibility of collecting representative ground samples everywhere. The approach uses GLAS LiDAR data (17m footprints every 185m) calibrated against field measurements, then fills gaps using MODIS spectral data composites over two years to account for cloud cover in tropical regions.
Click to watch →

Ecosystem Carbon 101
157
This video tutorial demonstrates how to perform desktop carbon analysis using two major GIS platforms—Google Earth Engine (free, open-access) and ArcGIS (paid, advanced)—to estimate carbon stocks in specific geographic areas by importing peer-reviewed carbon data layers (forest biomass and soil organic carbon at 250m resolution) and applying zonal statistics tools to calculate mean and total carbon values within defined boundaries, which serves as an accessible first step before considering more intensive field measurements for carbon assessment.
Click to watch →
Deep Dive
Exploration of blue carbon markets, international carbon accounting standards (e.g., Verra, IPCC guidelines), and carbon offset policies.
Blue Carbon Finance: Sustainable Management Unlocked?
112
Blue carbon markets face challenges learning from terrestrial carbon market failures including fraudulent reporting and negative socioeconomic impacts. Two primary standards govern projects: Verra for larger-scale initiatives and Plan Vivo for community-based projects. Conservation International developed principles and guidelines for high-quality blue carbon through UNEP. However, embedding integrity into higher-volume projects remains challenging. The debate centers on whether carbon markets should supplement or substitute for direct emission reductions, with concerns that corporate reliance on offsets delays necessary systemic changes. Geographic concentration in developing countries reflects both greater need and potentially weaker governance, raising questions about fairness and effectiveness of current market approaches.
Click to watch →

2021年11月3日開催:ブルーカーボンネットワーク設立記念シンポジウム
750
Blue carbon initiatives must align with international standards: (1) Methodologies - using standardized approaches for carbon sequestration measurement, (2) Verification - ensuring claims are independently verified, (3) Reporting - following international reporting requirements, (4) Recognition - achieving recognition from international bodies. Blue carbon can participate in carbon credit markets through credit generation, market integration, price discovery, and liquidity creation. Blue carbon ecosystems provide coastal protection benefits including wave attenuation, erosion control, storm surge reduction, and biodiversity support. The presentation emphasizes that international standards are essential for blue carbon initiatives to be credible and valuable.
Click to watch →

Developing a blue carbon offset project - Simpson Stefanie - The Nature Conservancy
6.8K
Blue carbon encompasses greenhouse gases stored in tidal marshes, seagrass, and mangroves—coastal systems that sequester carbon up to 10 times faster than forests, with carbon remaining locked for millennia. The voluntary carbon market generates over $2 billion annually, allowing companies and governments to purchase offsets supporting carbon capture projects. Three major standards (Verified Carbon Standard, Gold Standard, American Carbon Registry) ensure transparency and prevent double-counting. Approved methodologies like the Global Tidal Wetland and Seagrass Restoration Methodology enable tidal wetland restoration projects to generate tradable carbon credits.
Click to watch →

Blue Carbon: The Climate Mitigation Opportunity You've Never Heard Of
889
The 2013 IPCC Wetlands Supplement provided guidance for countries to include wetlands in national greenhouse gas inventories, representing a significant policy shift. NOAA is conducting a national coastal carbon assessment using IPCC guidelines, with results to be submitted to UNFCCC by 2017. California's cap-and-trade program now funds coastal wetland restoration through its Greenhouse Gas Reduction Fund. Additionally, NOAA partnered to develop VCS methodology enabling carbon credits for wetland restoration projects worldwide, creating new economic incentives for conservation and demonstrating how market mechanisms can support blue carbon initiatives.
Click to watch →
Pequenas propriedades podem gerar créditos de carbono?
28.4K
The main carbon credit markets include international voluntary markets, international regulated markets, and the Brazilian regulated market. Currently, the voluntary market is the largest functioning market. The Verra platform (VCS and CCB standards) represents the main standards accepted by the international carbon credit market. Brazil is a major provider of carbon credits through REDD+ projects and forestation projects. Soil carbon is important for the carbon cycle and preventing greenhouse gas emissions. Agricultural carbon projects can increase soil carbon through organic matter, no-till farming, green cover crops, and alternative fertilizers.
Click to watch →
Deep Dive
Design and evaluation of coastal restoration projects specifically optimized for carbon sequestration and biodiversity co-benefits.

Mỹ Thả 5000 Con Bò Rừng Bison Vào Vùng Đất Chết - Chỉ 18 Tháng Sau Cả Thế Giới Bàng Hoàng!
487.3K
By the second year, carbon content in the top 30cm of soil increased by 40%, representing a significant carbon sink restoration. Native prairie grasses with deep root systems (1.8-3m) store carbon in soil, with bison facilitating this process by creating conditions for grass growth. On 1,000 hectares, bison activity can sequester approximately 75,000 tons of carbon annually, equivalent to removing 16,000 cars from roads. Biodiversity recovered across trophic levels: 312 insect species appeared (from 12 previously), pollinators returned, and amphibians appeared in wallows for the first time in decades. The return of bison demonstrates that restoring keystone species can trigger cascading effects that restore entire ecological communities.
Click to watch →

Ils Ont Déversé 500 000 Tonnes de Coquilles d’Huîtres Dans L’Océan… Puis CETTE Chose Est Apparue
2.2K
Oysters naturally store carbon in their shells and surrounding sediments, contributing to capturing carbon dioxide responsible for climate change and ocean acidification. Biodiversity around the oldest reefs now approached that of natural rocky reefs, with endangered sea turtles returning and dolphins regularly hunting around structures. The Gulf began organizing around oysters: each generation created ideal conditions for the next, each shell expanded the reef, each reef made water cleaner. Scientists realized if a few hundred thousand tonnes of shells could trigger such renaissance, how many other destroyed coastlines could be restored? Projections indicated reefs could continue growing for decades or centuries, representing a potential global model for coastal restoration.
Click to watch →
Texas Reintroduced 5,000 Bison Into Desert Plain.. What Happened Next Was Insane
493.6K
Bison transformed degraded hydrology and carbon cycling: water tables rose 3.5 feet in 2 years despite increased animal water consumption, due to improved infiltration from reduced compaction and organic matter. Controlled burns became beneficial as grass fires killed invasive mesquite while sparing native grasses. Bison grazing prevented postfire dominance by any single species. Soil carbon increased 40% in top 12 inches, with 75,000 tons of carbon sequestered annually—equivalent to removing 16,000 cars from roads. Insect surveys jumped from 47 to 312 species in 3 years, including rare pollinators. Amphibians and reptiles colonized bison wallows providing breeding habitat. Burrowing owls and swift foxes returned after decades absence. This demonstrates that restoring keystone species triggers cascading recolonization by dependent species and that degraded landscapes don't need decades of careful restoration—they need the right disturbance regime from keystone species.
Click to watch →

Investing in Carbon Sequestration with Ponterra
124
Effective nature-based restoration projects require specific design elements: (1) Native species diversity over monocultures (106 species planted); (2) Landowner partnerships rather than land acquisition; (3) Removal of degrading activities like cattle ranching; (4) Carbon credit revenue sharing with local farmers; (5) Multi-stakeholder teams including foresters, biodiversity experts, and operations staff.
Click to watch →
We're turning a farm back into a swamp
434.8K
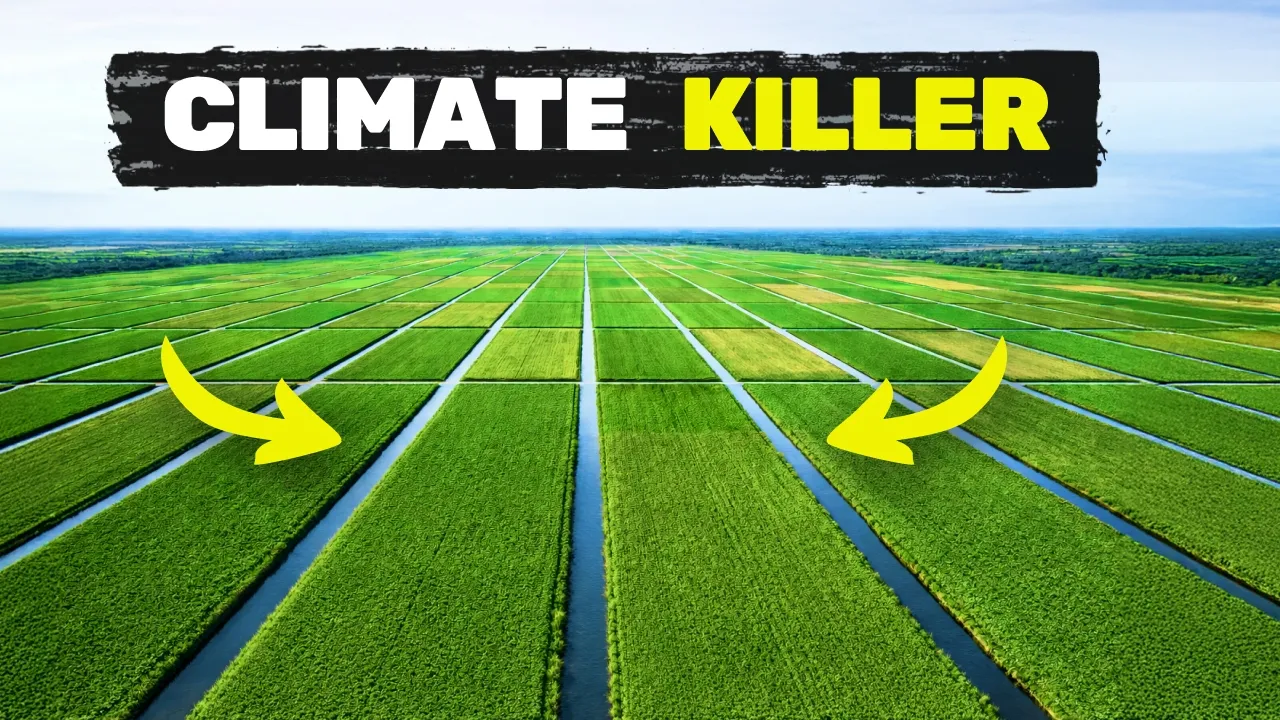
Peatlands, despite covering only 3% of Earth's land, store twice as much carbon as all forests combined; however, drainage for agriculture has caused 80% of Europe's wetlands to disappear, releasing stored carbon as CO2 and contributing to climate change. Restoring peatlands involves removing invasive trees, clearing unwanted vegetation, mowing overgrown areas, and blocking drainage ditches to rehydrate the ecosystem, which halts decomposition and allows new peat formation while bringing back biodiversity such as cranes, wolves, and beavers.
Click to watch →
Deep Dive
Advanced analysis of greenhouse gas fluxes (such as methane and nitrous oxide emissions) that may offset net blue carbon storage.
Blue Carbon: Its Definition, Location, and Importance | BrisScience
4.3K
Degraded and converted coastal wetlands become net sources of greenhouse gases, not just CO2 but also methane and nitrous oxide. Rice agriculture produces methane emissions, and aquaculture produces nitrous oxide from fish feed. Converting wetlands to these uses often results in higher overall greenhouse gas emissions than the intact ecosystem. Two main strategies exist for blue carbon: conservation (avoiding CO2 emissions from degradation through marine protected areas and reducing exploitation) and restoration (recreating ecosystems with similar functions to restore carbon sinks). Restoration often involves recreating ecosystem functions rather than exact historical conditions.
Click to watch →
Webinar: Blue Carbon in Practice: Results from Tampa Bay Blue Carbon Assessment
181
Blue carbon ecosystems store carbon in three stocks: above-ground biomass, soil stock, and below-ground biomass. As sea levels rise, agricultural grassland converts to marsh (increasing biomass and soil carbon), then eventually to mud flat or open water (losing all carbon stocks). The greenhouse gas accounting framework combines biomass loss, soil carbon changes, cumulative sequestration, and methane emissions. Interestingly, net greenhouse gas fluxes were similar across all scenarios despite individual components varying significantly. High sea level rise with low accretion actually reduced methane emissions because more freshwater marsh converted to salt marsh (which emits less methane).
Click to watch →
Blue Carbon Sequestration Along California's Coast: A Virtual CCST Expert Briefing
187
Coastal wetlands produce multiple greenhouse gases beyond CO2. Methane is naturally produced at salinities about half that of seawater (18 parts per thousand), though the carbon stored in wetland soils outweighs methane emissions in the long term. Restoring tidal flow to impounded wetlands can reduce methane emissions by increasing salinity. Nitrous oxide, 25 times more potent than CO2, is produced through denitrification processes where nitrogen compounds are converted to inert atmospheric forms. Measuring these gas fluxes in the field is challenging, but ongoing research is improving understanding of wetland greenhouse gas emissions. This complexity means that while blue carbon habitats have high carbon storage potential, accurate accounting requires understanding all greenhouse gas fluxes.
Click to watch →

CSHL Keynote; Dr. Rob Jackson, Stanford University
556
Beyond CO2, the global methane cycle offers significant intervention opportunities. Human activities now account for 60% of all methane emissions, with two-thirds from agricultural sources (livestock, rice cultivation). Similarly, nitrous oxide emissions are heavily influenced by agricultural practices. Each greenhouse gas presents reduction and enhancement opportunities. For oceans, phytoplankton productivity enhancement through iron fertilization could remove CO2, though experiments show mixed success in getting carbon to deep ocean depths where it remains long-term. Kelp growth enhancement and sinking represents another ocean-based approach under investigation.
Click to watch →

Soil carbon sequestration: When does increased soil C storage yield net removal of greenhouse gases?
2.3K
Increased soil organic carbon storage does not automatically yield net removal of greenhouse gases because practices that enhance carbon sequestration may simultaneously increase nitrous oxide (N2O) emissions, requiring comprehensive accounting of all greenhouse gas fluxes (including N2O, methane, and CO2) across the entire carbon-nitrogen cycle to determine true climate benefits.
Click to watch →
Carbon Banks
Core Sampling
Carbon Banks
0:00- 1
Explores mangroves as vital blue carbon ecosystems with high soil carbon storage.
- 2
Identifies three carbon pools: aboveground, belowground, and soil organic carbon.
- 3
Introduces non-destructive methods like allometric equations and soil coring.
The Lateral Flux and Trace Gas Offset Challenge
While traditional field methods for blue carbon assessment focus on quantifying static carbon stocks in mangrove biomass and soil, critics argue this approach overlooks dynamic lateral carbon fluxes and trace gas emissions. Standard field measurements often assume that organic carbon remains sequestered in situ. However, a significant portion of mangrove carbon is exported laterally into the open ocean as dissolved organic and inorganic carbon (DOC and DIC), or outgassed as carbon dioxide and methane. Furthermore, waterlogged, anoxic mangrove soils can be major sources of methane and nitrous oxide—potent greenhouse gases that can partially offset the climate benefits of carbon burial. Without accounting for these lateral losses and trace gas dynamics, localized stock measurements can lead to overestimations of a mangrove ecosystem's net atmospheric carbon reduction capacity. Consequently, some scientists advocate for shifting focus from static stock inventories to dynamic, flux-based monitoring systems that integrate automated sensor networks and eddy covariance towers.
Understanding of the global carbon cycle, specifically how carbon is sequestered, stored, and released in biological sinks.
Basic concepts of coastal ecology, including the definition of 'blue carbon' and the unique environmental conditions of mangrove ecosystems.
Fundamental forestry measurement principles, such as measuring Diameter at Breast Height (DBH) and the concept of allometric equations.
Introductory soil science, particularly the properties of anaerobic wetland soils, organic matter accumulation, and soil bulk density.
Application of field-collected data to Geographic Information Systems (GIS) and remote sensing for regional-scale carbon mapping.
Exploration of blue carbon markets, international carbon accounting standards (e.g., Verra, IPCC guidelines), and carbon offset policies.
Design and evaluation of coastal restoration projects specifically optimized for carbon sequestration and biodiversity co-benefits.
Advanced analysis of greenhouse gas fluxes (such as methane and nitrous oxide emissions) that may offset net blue carbon storage.
136 views7likes3:05@sustecsolOriginal Release: 2025-09-27
Uh, why does this feel like I'm trying to plant a flag on the moon, Mr. Ran?
>> Because, Francis, you're holding the key to one of the planet's biggest climate secrets. Soil carbon in mangroves.
>> Wait, you're telling me these swampy trees are actually giant carbon banks?
>> You need to know this. Mangroves are part of the blue carbon ecosystem. They trap and store enormous amounts of carbon in their leaves, branches, roots, and especially in their soils. In fact, mangrove soils can hold up to five times more carbon than tropical rainforests.
So, the mud I'm standing in is basically climate gold.
>> Exactly. And that is why we do carbon stock assessments to measure how much carbon these ecosystems really hold.
There are three main pools we look at.
One, above ground biomass, trunks, branches, leaves. Two, below ground biomass, roots. Three, soil organic carbon, that rich mud beneath your feet.
>> Okay, trees, roots, and mud. Got it. But how do we measure all that without cutting everything down?
>> Good question. We use scientific methods that are accurate and non-destructive.
One, alometric equations to estimate tree biomass using DBH and height. Two, cing devices like Russian or Pete augers to sample soil carbon by depth. Three, bulk density samples to calculate how much organic matter is packed in the soil. Four, GPS and field data sheets to keep everything organized.
>> So, this thing is more powerful than it looks. Only if you use it correctly, Francis, in a typical assessment, we one set up plots across the mangrove zone.
Two, measure tree DBH and height four biomass. Three, tape soil cores at different depths to analyze organic carbon. Four, record everything on standardized field sheets so the data can be compared over time.
>> So, it's like building a carbon budget, tracking every branch, root, and scoop of mud.
Bullseye. That data helps scientists, governments, and conservation groups understand the true climate value of mangroves and make stronger cases for protecting them.
So, here's the takeaway.
Healthy mangroves aren't just protecting coasts and wildlife. They're locking away carbon for centuries. The better we measure it, the better we can protect it.
[Music]
Up Next
10:01
Ecological Mangrove Restoration Methods on Thailand's Andaman Coast
@MangroveActionProject-MAP
108.4K views•2019-03-21

15:54
Life in Biosphere 2: Sustainable Ecosystems & Human Survival
@TED
334.9K views•2009-06-16
14:30
Microplastics Everywhere: How Plastic Impacts Our Lives
@TEDx
100.9K views•2018-05-08
10:28
Ice Stupa Artificial Glaciers: Solving Ladakh's Water Crisis
@SonamWangchuk66
3.2M views•2015-05-03
Related Study Plans & Knowledge Roadmaps
Structured learning paths in Environmental Science
environmental-science
Ocean Noise: Cetacean Impacts & Mitigation
01Fundamentals of Underwater Acoustics
02Marine Mammal Bioacoustics
03Anthropogenic Noise: Shipping & Seismic Surveying
+ 2 more learning modules
16h5 modules
Explore Roadmap
environmental-science
Road Ecology: Corridors, Overpasses & Fencing
01Foundations of Habitat Fragmentation and Carnivore Ecology
02The Road Barrier: Ecological Impacts of Transport Infrastructure
03Principles of Ecological Corridors and Connectivity Mapping
+ 3 more learning modules
14h6 modules
Explore Roadmap
environmental-science
Ocean Acidification: Kelp Buffering & Shellfish
01Fundamentals of Ocean Chemistry & pH
02Chemical Pathways of Coastal Acidification
03Bivalve Physiology & Calcification Under Stress
+ 2 more learning modules
18h5 modules
Explore Roadmap
environmental-science
Ice Stupas: Glacial Retreat & Water Security
01Foundations of Glaciology & Mountain Hydrology
02Climate Change and Glacial Retreat Dynamics
03The Science of Ice Stupas & Artificial Glaciers
+ 2 more learning modules
14h5 modules
Explore Roadmap