![Muscle Physiology [1] - القصر العيني 199](https://i.ytimg.com/vi/nRYo1yU-92Y/maxresdefault.jpg)

















EMG signal processing involves a systematic workflow: first, raw EMG signals (1-10 mV amplitude, 50-150 Hz frequency) are amplified using instrumentation amplifiers with ~100 gain and filtered through anti-aliasing low-pass filters at ~1 kHz to satisfy Nyquist theorem; then, the digitized data undergoes FFT transformation to identify cutoff frequencies for software-implemented bandpass filtering; finally, full-wave rectification converts negative amplitudes to positive values, followed by smoothing and averaging to produce clean signals suitable for analyzing neurodegenerative diseases like Parkinson's or essential tremor.
EMG Signal Processing & Analysis | Biosignal Filtering & FFT
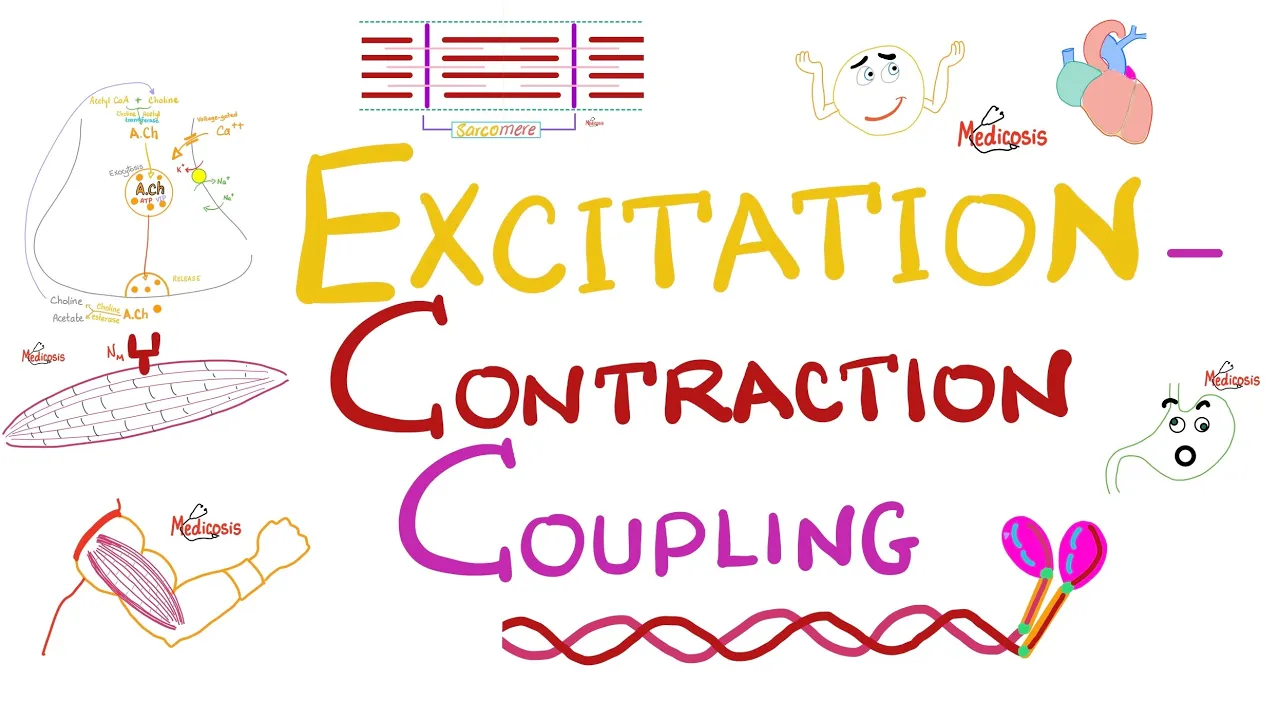
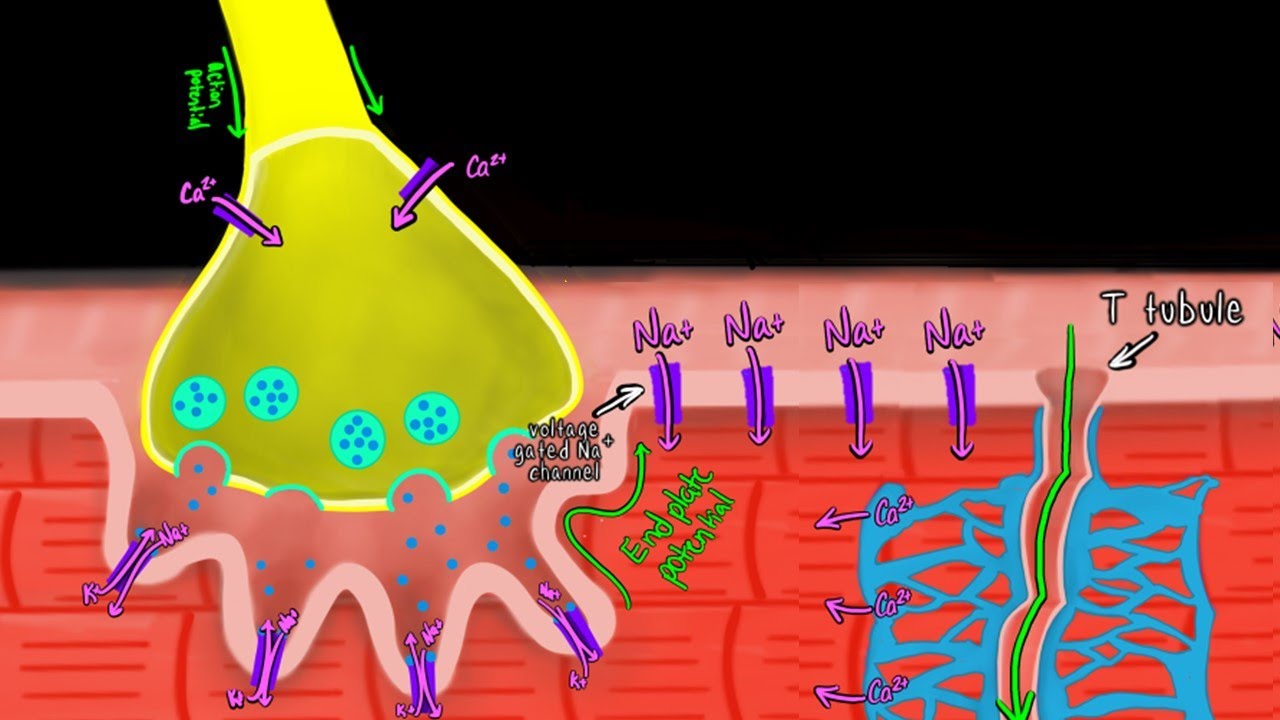
Added:Basic muscle physiology and how action potentials are electrically generated during muscle contraction.
Fundamental analog circuit design, specifically the concept of operational amplifiers (op-amps) and differential amplification.
The Nyquist-Shannon sampling theorem and the mathematical principles of signal aliasing in digital systems.
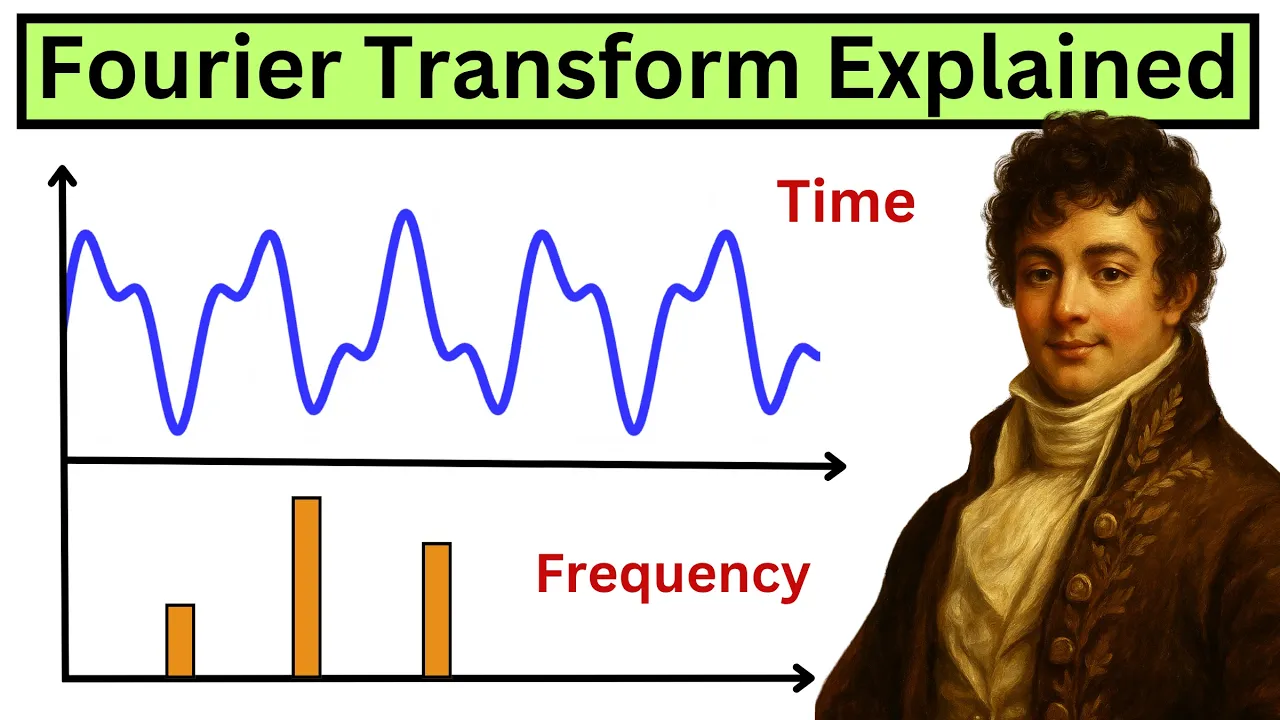
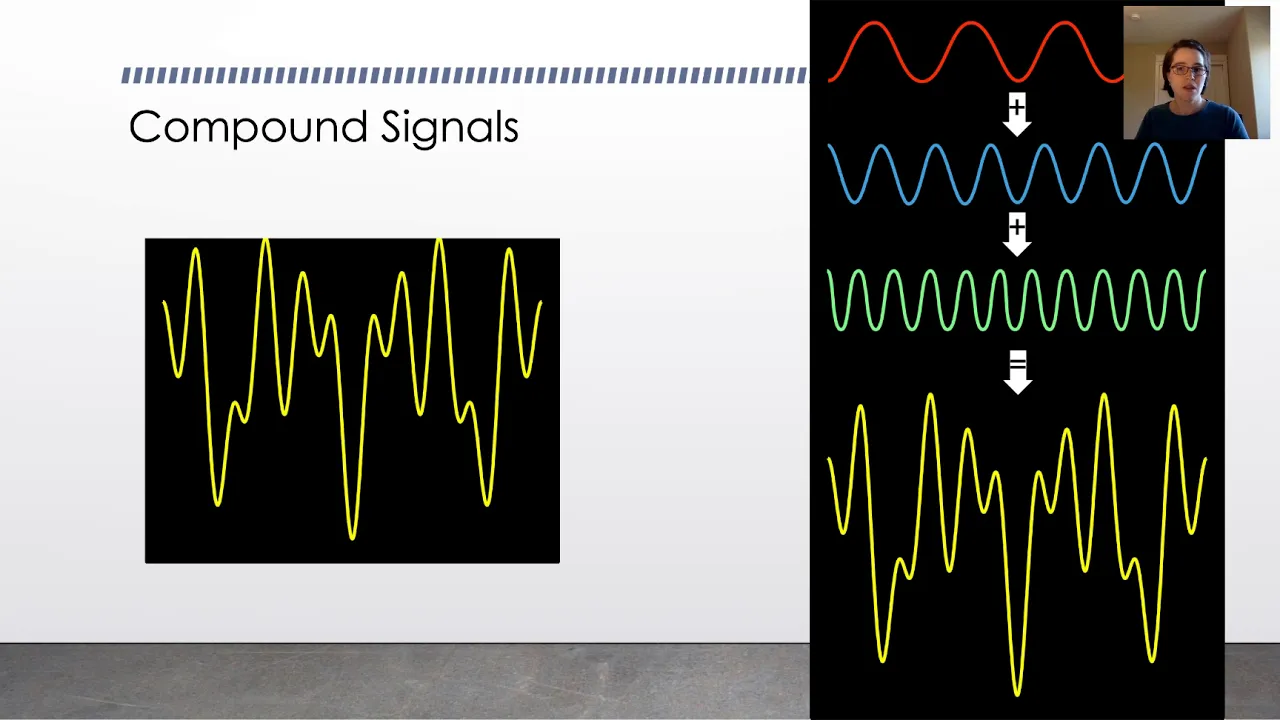
Introductory concepts of Fourier analysis, particularly how signals transition between the time and frequency domains.
Feature extraction methods for processed EMG, including calculating Root Mean Square (RMS) and Mean Absolute Value (MAV) for muscle activity estimation.
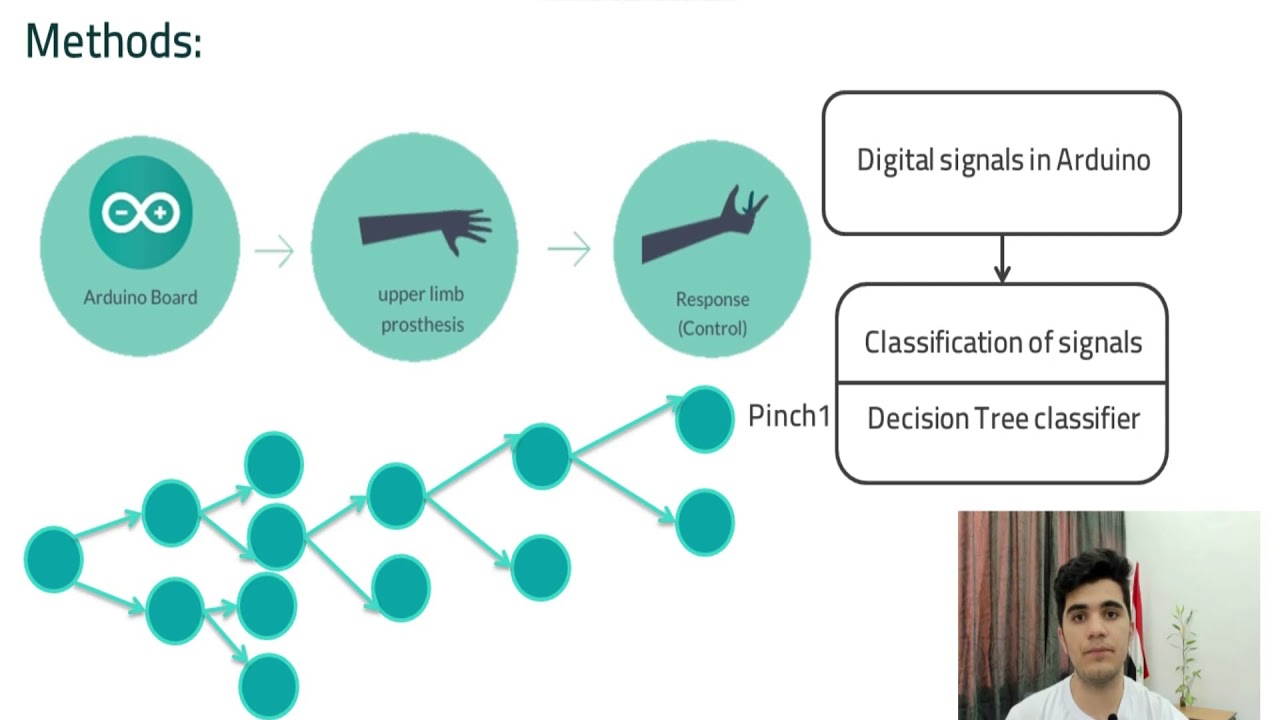
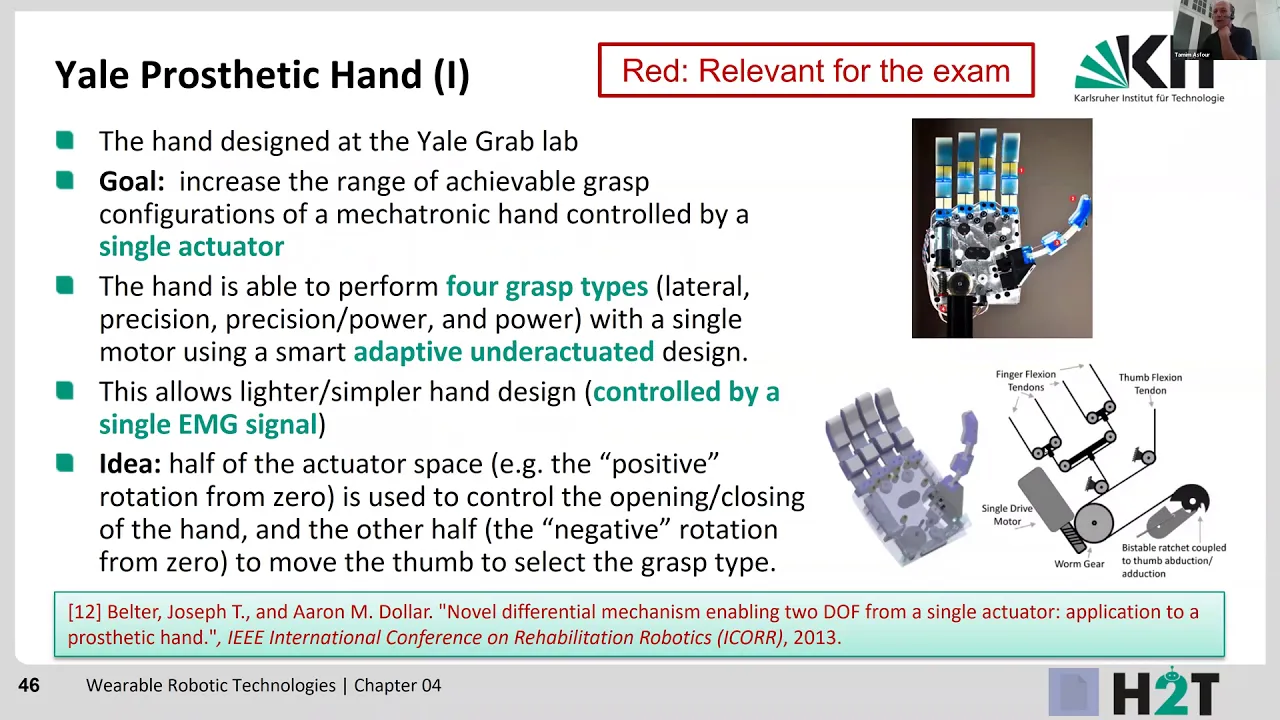
Using machine learning classifiers (such as SVMs or Neural Networks) on EMG features for myoelectric control of prosthetics and orthotics.
Advanced time-frequency analysis techniques, like the Short-Time Fourier Transform (STFT) and Wavelet Transform, for non-stationary biosignals.
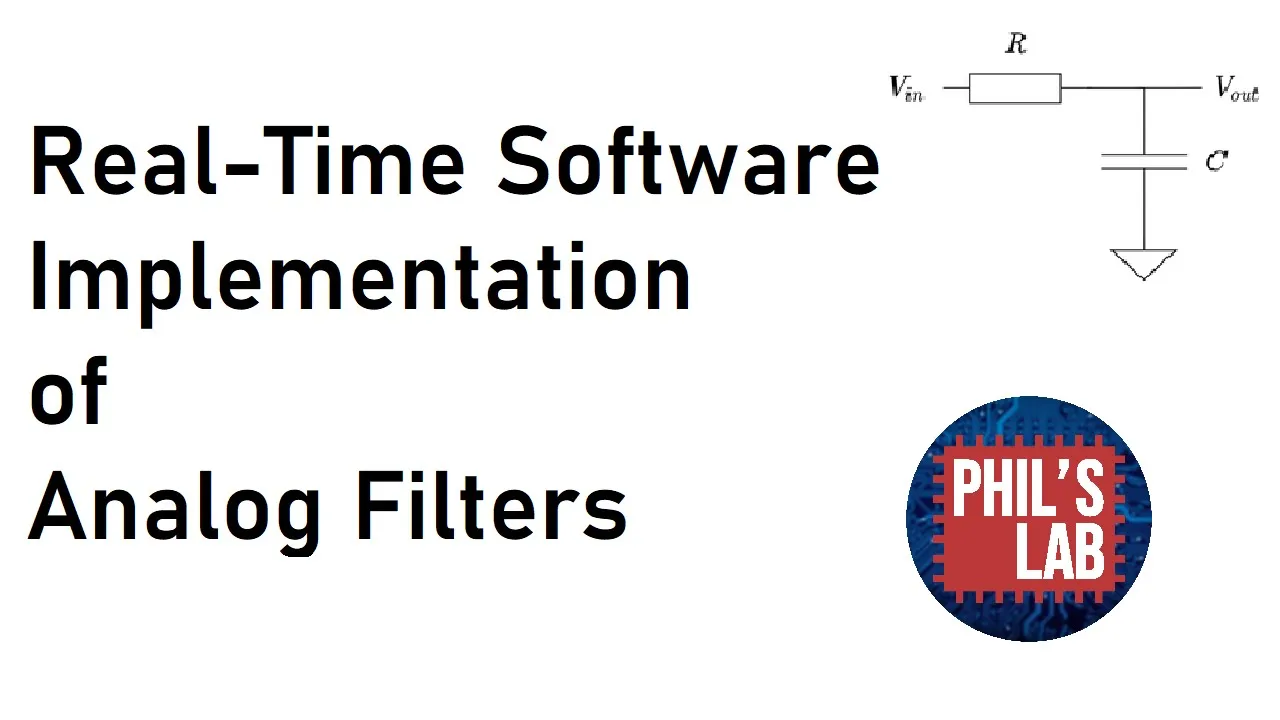
Real-time implementation of digital filters and signal processing pipelines on embedded microcontrollers for wearable health devices.
17.1K views253likes5:53Original Release: 2020-11-27
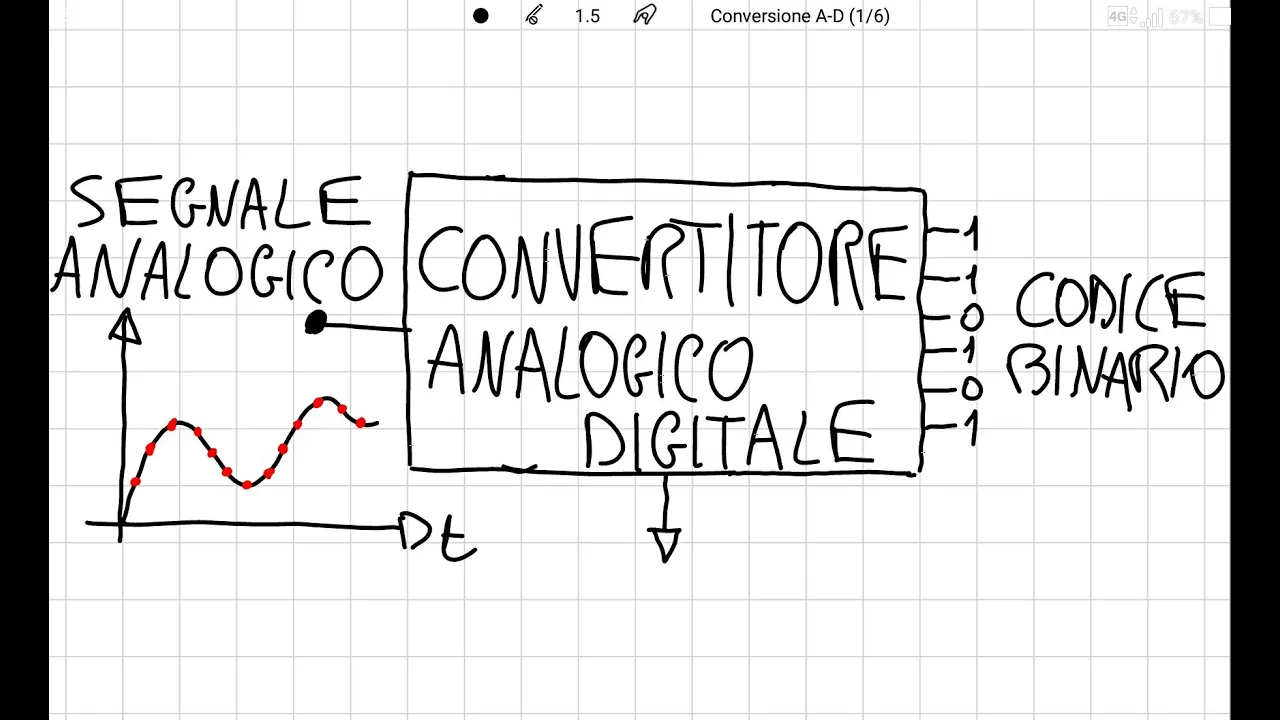
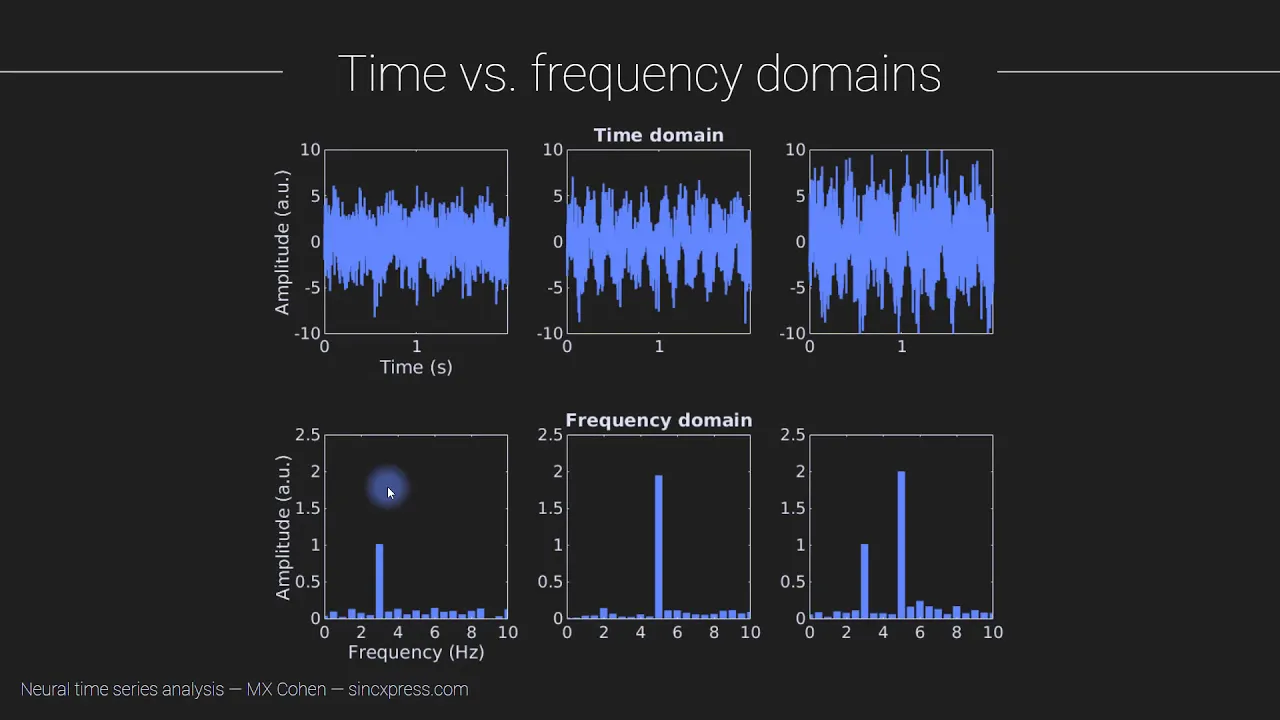
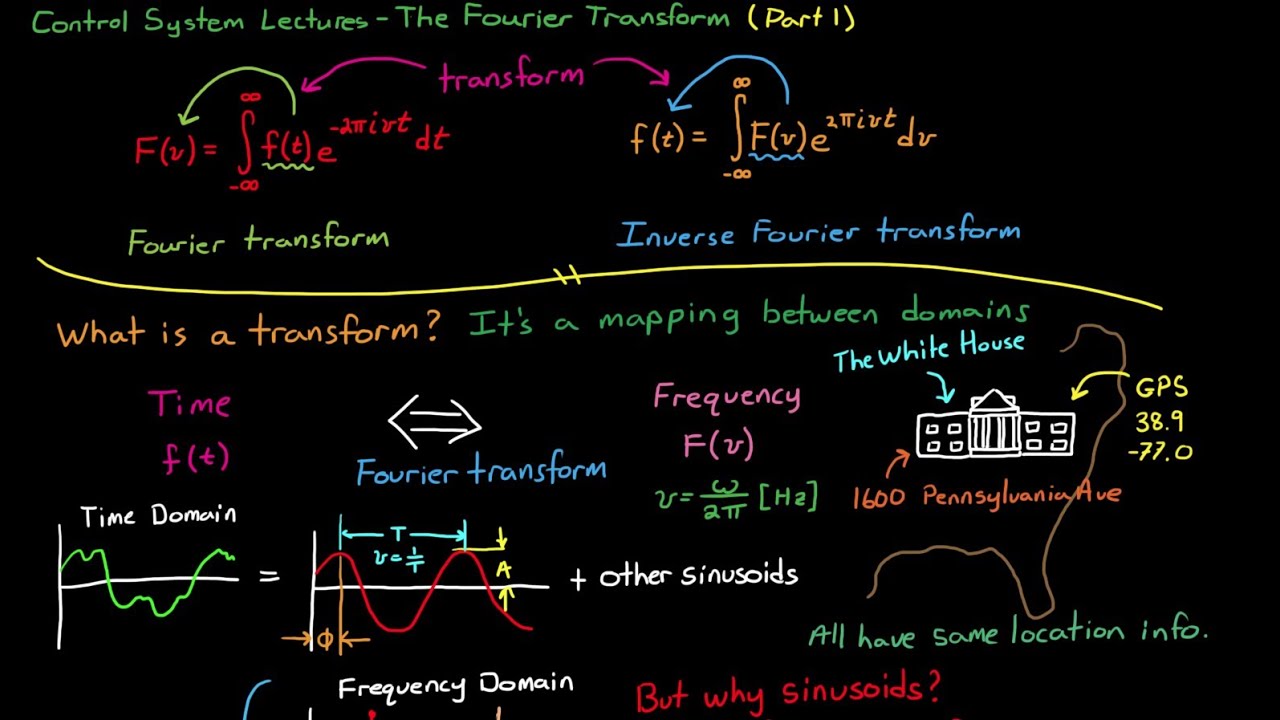
[Music] hi my name is joshua silver and i'm here to talk about emg signal processing and analysis so what is emg well emg stands for electromyograph and it's used in the medical field for measuring electrical impulses from muscular activity it commonly has a frequency of between one and ten millivolts and a frequency from ranging from zero to 500 hertz although it's more commonly found between 50 and 150 hertz this is different than other biopotentials which are various electrical impulses that our bodies give up such as ecg which is which measures electrical impulses given off from the heart or eeg which is impulses from the brain here i have outlined the general process which a person could take a surface electrode to measure these electrical impulses from a patient's muscle and then process that raw emg data into data that can be analyzed by a physician to detect neurodegenerative diseases or be used in other applications like all biopotentials emg signals have a very low amplitude so we generally use a instrumentation amplifier which gives off low noise of a gain of about 100 to give us a larger signal that is easier to analyze and understand this is generally implemented in hardware since this electrode that we are using measures all sorts of electrical potentials it's important to include an anti-aliasing filter this is generally a low-pass filter that has an upper end of around one kilohertz this is going to filter out our unwanted signals we choose uh one kilohert to satisfy the nyquist sampling theorem as that's about two times the maximum frequency that we will see from an emg signal this is again implemented in hardware once we have filtered our data we can then put it into an analog to digital converter using a microcontroller generally in the professional field they use 16 bit sampling but it can also be used as low as 8 bits once we have this data sampled the easiest way that i have found would be to transfer this data set to be analyzed in a program such as python or matlab where we can understand our data better than if we were to try to perform this signal processing with our embedded system once we have obtained our set of data from the adc we can then take the fast fourier transform to bring us from the time domain to the frequency domain within the frequency domain we can find the high and low cutoff frequencies of our signal using these frequencies we can create a bandpass filter this is necessary as we have high frequency noise given off from imperfection of the sensor and low frequency noise that is generated from the electrode shifting on the patient's muscle the formula for the frequency response of an nth order butterworth filter is shown below and using our cutoff frequencies we can define the pass band length w and the center frequency f zero we can then multiply this function with our data in the frequency domain before taking the i fft to bring us back to the time domain next we have to do full wave rectification on our signal as processed efg data is only represented in positive amplitudes in hardware this could be done using a bridge rectifier but since we were working in software it is easier just to take the absolute value of the negative components of our signal and add it to the positive components after rectification the data is usable but it is better to both smooth and average our data to make it easier to understand this data can then be analyzed to be used to determine various neurodegenerative diseases such as parkinson's or essential tremor so what does this process do to our signal step by step well in green we can view the raw data which would be coming out of the adc in red we show our filtered signal which comes out of our bandpass filter that we designed in software following that we have our full wave rectification in blue following that we have our smoothing which is eliminating a lot of unnecessary noise and averaging which is giving us a nice clean final signal thank you for listening to my presentation here i have the references that i used and i hope you have a good day and happy holidays you
Up Next
4:52
Exoskeleton Arm Mount Assembly: Welding and Attachment for Expo Demo
@hacksmith
151.6K views•2016-04-30
30:32
Ultrasonic Transducers: Resonant Frequency Measurement and Horn Design
@imajeenyus42
229.9K views•2017-02-22

54:16
Polymer Environmental Degradation: Mechanisms & Stabilization
@iit
1.8K views•2012-07-10
33:39
How a Student's Question Saved a NYC Skyscraper from Collapse
@veritasium
22.8M views•2025-04-26
Related Study Plans & Knowledge Roadmaps
Structured learning paths in Engineering
engineering
Building Acoustic Levitators: Physics & Arduino
01The Physics of Sound and Standing Waves
02Piezoelectric Transducers and H-Bridge Drivers
03Arduino Programming: Generating 40 kHz Signals
+ 2 more learning modules
14h5 modules
Explore Roadmap
engineering
Building Peltier Cloud Chambers: Particle Tracks
01Cosmic Rays & Cloud Chamber Physics
02Thermoelectric Cooling (TEC) Fundamentals
03Custom Liquid-Cooling Loop Design
+ 2 more learning modules
18h5 modules
Explore Roadmap
engineering
Yagi-Uda Antennas: Modeling, Build & VNA Test
01Introduction to RF and Antenna Fundamentals
02Yagi-Uda Antenna Design Principles
03Antenna Modeling and Simulation in 4NEC2
+ 2 more learning modules
18h5 modules
Explore Roadmap
engineering
ECG Monitor Design: Op-Amps, Filters & Noise
01Electronics & Breadboard Basics
02Op-Amps and Instrumentation Amplifiers
03Bioelectricity and ECG Fundamentals
+ 2 more learning modules
18h5 modules
Explore Roadmap