





![[선형대수]_17. 차원 축소 및 확장 (dimension reduction & expansion)](https://i.ytimg.com/vi/uAVlPBC8TGE/maxresdefault.jpg)

![[Vietsub] Andrew Ng - Bài 68: Giảm chiều dữ liệu - Nén dữ liệu](https://i.ytimg.com/vi/JM9vgz6uosE/hqdefault.jpg?sqp=-oaymwEmCOADEOgC8quKqQMa8AEB-AHUBoAC4AOKAgwIABABGGUgZShlMA8=&rs=AOn4CLAc4aYaKLxBk0gfFOyoBWSy-y6_Ng)





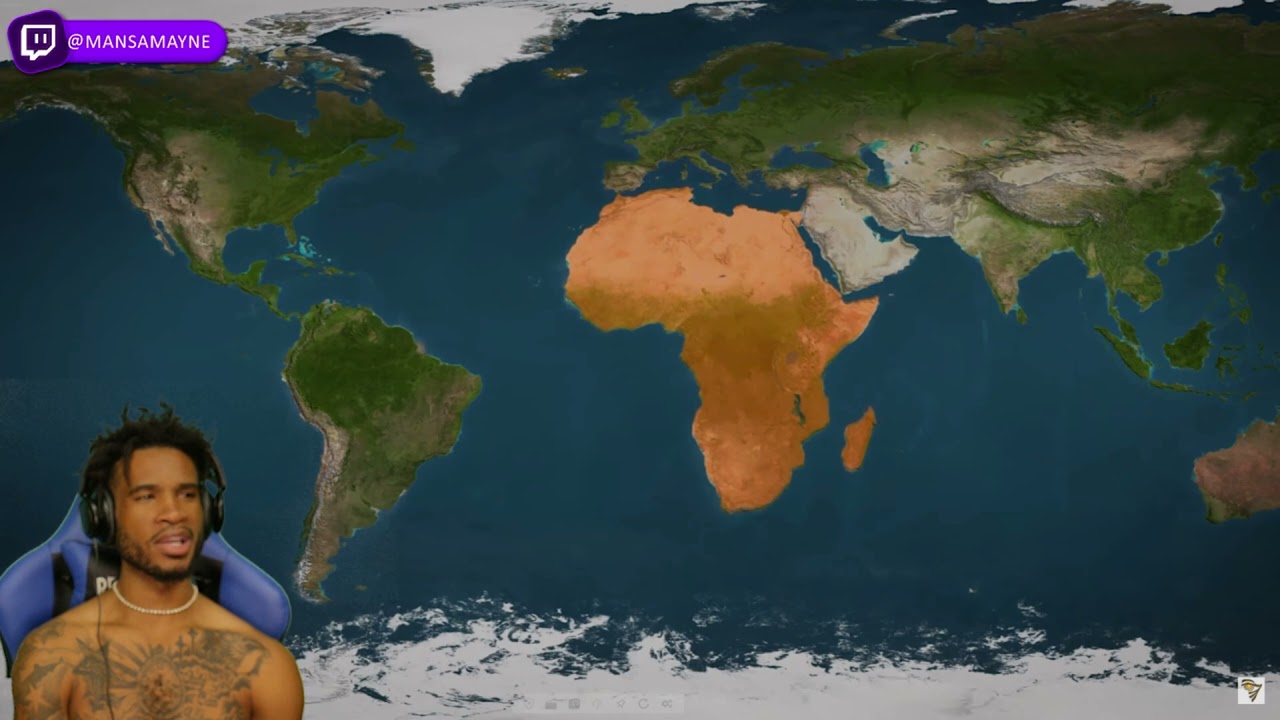











Map projections are mathematical methods for representing Earth's three-dimensional spherical surface on a two-dimensional flat map, and they involve inherent trade-offs where preserving one spatial property (distance, area, shape, or direction) necessarily causes distortions in others; projections are classified into cylindrical, conic, and planar types based on the projection surface used, with standard lines indicating where scale remains true, and common specialized projections include conformal (preserving shape), equal-area (preserving area), equidistant (preserving distance), and azimuthal (preserving direction) projections.
Understanding Map Projections: Types & Geographic Distortion Explained
Added:The basic shape of the Earth as an oblate spheroid (geoid) rather than a perfect sphere.
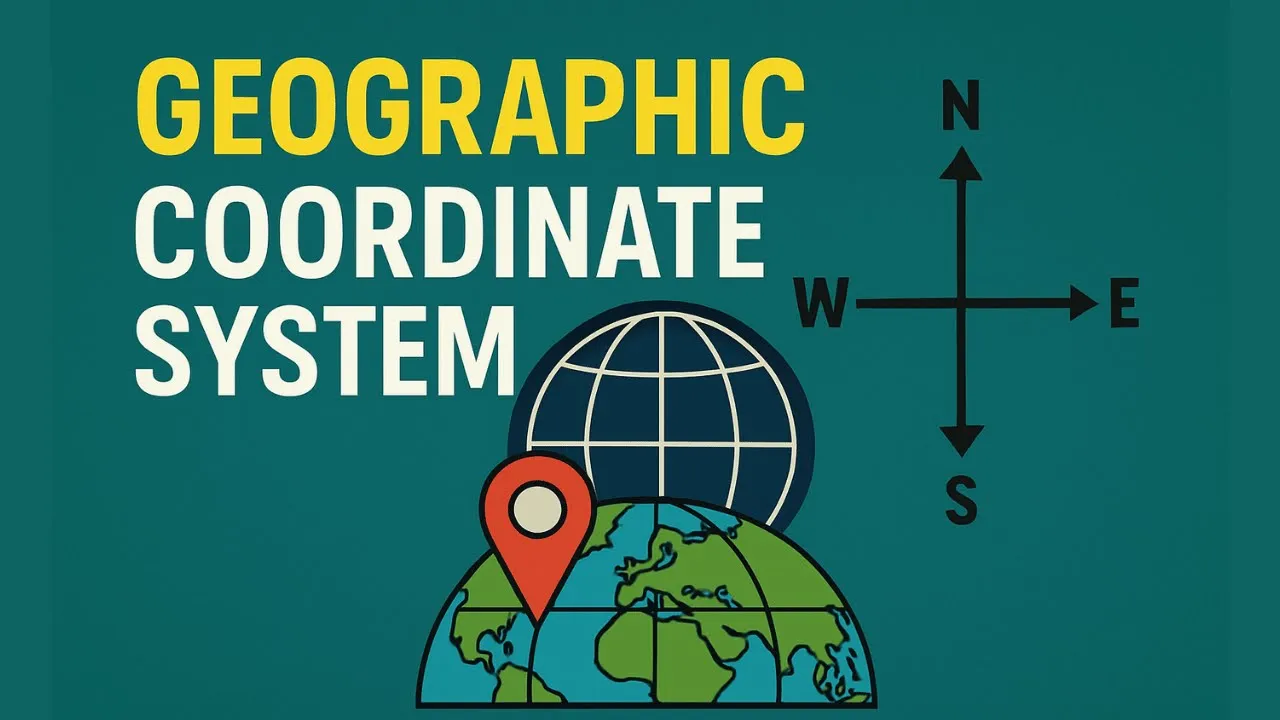
The geographic coordinate system, including the concepts of latitude, longitude, and the graticule.
The fundamental concept of map scale and the relationship between ground distance and map distance.
Basic geometric principles of dimensional reduction (converting a 3D surface to a 2D plane).
How to select the appropriate map projection based on the specific purpose of a map (e.g., navigation, thematic mapping, or spatial analysis).
The social, political, and cultural implications of map projections, such as the power dynamics associated with the Mercator versus the Gall-Peters projection.
Introduction to Geographic Information Systems (GIS) and working with Coordinate Reference Systems (CRS).
Understanding geodetic datums (such as WGS 84 or NAD 83) and how they define the size and shape of the Earth for coordinate systems.
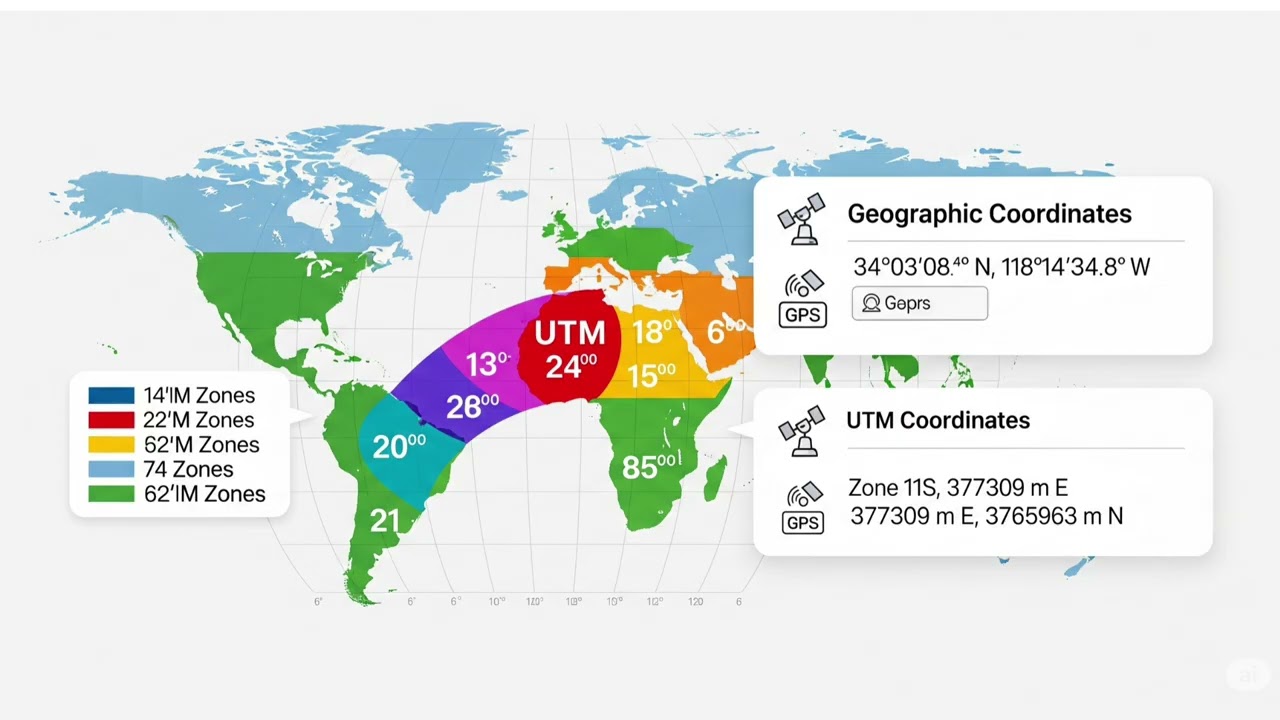
Advanced projection systems used in local surveying and planning, such as the Universal Transverse Mercator (UTM) system.
65.3K views337likes8:30Original Release: 2014-09-02
Hello and welcome to this lecture on map projections.
The learning objectives for this lecture are to understand what map projections are and discern the differences between different map projection types.
The earth is an oblique sphere.
Thus, starting with the ancient Greeks and the beginnings of earth measurement and graphical representation, a practical need developed for map projections.
A map projection is a method of representing the Earth's three-dimensional surface as a flat two-dimensional surface.
The following list outlines key points you should know about map projections.
Projections are mathematical transformations.
Scale is true in only certain places.
Many different types have been devised.
All map projections distort.
Distortion characteristics vary from projection type to type.
Some types are better for some applications than others and a few types are widely used.
The idea of projecting a map is that a hypothetical light source is placed in the center of a scale 3D model of the Earth. From this center point, the light would then shine out or project the lines of latitude and longitude onto a two-dimensional projection surface, which would then be the basis for the map projection.
All map projections are based on three common projection surfaces.
The cylinder projection surface used for cylindrical projections. In this case, the projection service is tangent or in contact with a single point or line of the globe.
The cone projection service used for conic projections. In this case, the projection service is secant with the globe or cutting intersecting through the globe.
The plane projection surface used for planner or as mmful projections. In this case, the projection surface is tangent with the globe.
The heavy black lines and black point on the top of the globe shown in these figures are what are known as standard lines. Standard lines are where the map projection surface touches the globe model.
The standard lines are the only place of the map where the scale is true. For example, take a look at the left side of the bottom left figure. Note how there is a straight black line where the projection plane or standard line is in contact with the Earth's surface.
Contrast this to the dotted line above the projection plane and map surface.
This will show distorted features as the map surface is farther away from the projection plane and points of contact with the globe model.
Creating a map projection distorts the spatial properties of the final two-dimensional map.
Spatial properties that are distorted include distance, area, shape, and direction.
When a flat map is made, choices are made dependent on the intended use of the map as to which of these properties to preserve.
Thus, distortions exist in all two-dimensional flat maps.
As no map projection can preserve all of these properties and map projections are classified based on the spatial property they preserve.
Here we see some map projection examples.
In these figures, the general projection class is listed with the name of the specific projection shown in parenthesis.
The conformal map projection which preserves shape and angle and is shown on the top left clearly illustrates how shapes are preserved but size and area is greatly distorted as seen in the size and area of Greenland and Antarctica when compared with Africa.
The equal area projection which preserves area and size and is shown on the top right shows features at their correct size and area but not their correct shape. This time Africa is shown correctly in terms of size and area when compared with Greenland and Antarctica.
The equidistant projection shown on the bottom left preserves true distances in some directions from the projection center or along special lines. As seen in this example, you could calculate correct distances from the north pole.
The asmthal projection preserves true direction or asthmas or angle measurements from a reference point. In this example, the map is centered on 0 degrees latitude and 0 degrees longitude. Thus, any direction measured from this point will be correct.
In the following example, I use geographic information systems to give you some practical examples of map projections.
In this example, I demonstrate map projection ideas using a commercial geographic information system tool known as Ark Map created by ESRI.
Ark Map makes it very easy to change and manipulate map projections.
In this example, you can see world country outlines. To change the map projection, I rightclick on the dataf frame layer properties and I'm given a variety of choices of map projections I can use.
For example, if I wanted to create a conformal map projection to show how shapes and angles are preserved, I can select world and recar.
Note how the country shapes in this part of the map will change when I hit the okay button.
Here you can now see a Mercer map projection which is preserving shapes and angles.
I can continue this idea with other map projection types. For example, an equal area projection.
Although Ark Map makes it very easy to change map projections using simple button clicks, remember it is important to keep the concepts of map projections in mind.
In this lecture, you learned about map projections.
You learned what map projections are.
Specifically, you learned that map projections are a two-dimensional representation of the Earth, which is a three-dimensional entity.
You learned that map projections involve using a variety of projection surfaces such as cylinder, cone, and plane.
These projection surfaces have influence on where scale is true on the map.
You then learn the differences between different map projection types. You learn that map projections make distortions in spatial properties such as distance, area, shape, and direction.
You were also shown examples of different map reduction types to see specifically how spatial property distortions affect the geography shown on a map. You were also given a brief demonstration of how to manipulate map projections using a commercial GIS tool.
Whenever you look at any map now keep the ideas of map projections in mind and consider if the mapmaker is using the correct map projection for the geography being shown.
The following are references used in the preparation of this video lecture.
If you enjoyed this video lecture or have any comments or questions, feel free to contact me at the email address below. Thank you for watching.
Up Next

10:16
Zero Knowledge Proofs Explained: A Mathematical Introduction
@upandatom
351.5K views•2022-03-30

4:43
Elliptic Curve Cryptography Explained: ECC, ECDSA, ECDH
@PracticalNetworking
28.5K views•2024-10-21

10:44
Fourier Series Introduction: The Big Idea Explained
@DrTrefor
387K views•2021-05-03

6:00
The Mathematical Impossibility of Accurate World Maps
@Vox
23.3M views•2016-12-02
Related Study Plans & Knowledge Roadmaps
Structured learning paths in Mathematics
mathematics
Tensor Calculus: Vectors to Riemann Curvature
01Mathematical Foundations: Linear Algebra & Calculus
02Covectors, Dual Spaces, and Tensor Basics
03The Metric Tensor and Index Gymnastics
+ 2 more learning modules
40h5 modules
Explore Roadmap
mathematics
Gödel's Incompleteness: Logic, Proofs & Limits
01Introduction to Formal Systems & Hilbert's Dream
02Set Theory, Cardinality, and Cantor's Diagonal Argument
03Arithmetization and Gödel Numbering
+ 2 more learning modules
14h5 modules
Explore Roadmap
mathematics
Galois Theory: Fields, Groups & Solvability
01Foundations of Abstract Algebra: Groups & Fields
02Polynomials & Field Extensions
03Splitting Fields & Symmetries
+ 2 more learning modules
24h5 modules
Explore Roadmap
mathematics
Non-Euclidean Geometry: Models & Geodesics
01Euclid's Fifth Postulate and the Birth of New Geometries
02Hyperbolic Space and the Poincaré Disk Model
03Geodesics: Defining Straight Lines in Curved Spaces
+ 2 more learning modules
15h5 modules
Explore Roadmap