







![[FSH RU TRAINING COURSE] How to write a scientific report](https://i.ytimg.com/vi/_IAIO1bDbsA/maxresdefault.jpg)









Effective communication of wildlife mortality monitoring results in wind energy projects requires selecting appropriate statistical estimators (such as the Generalized Mortality Estimator or Evidence of Absence), presenting adjusted mortality estimates with confidence intervals rather than raw counts, and structuring reports to clearly convey methodology, uncertainty, and implications to stakeholders.
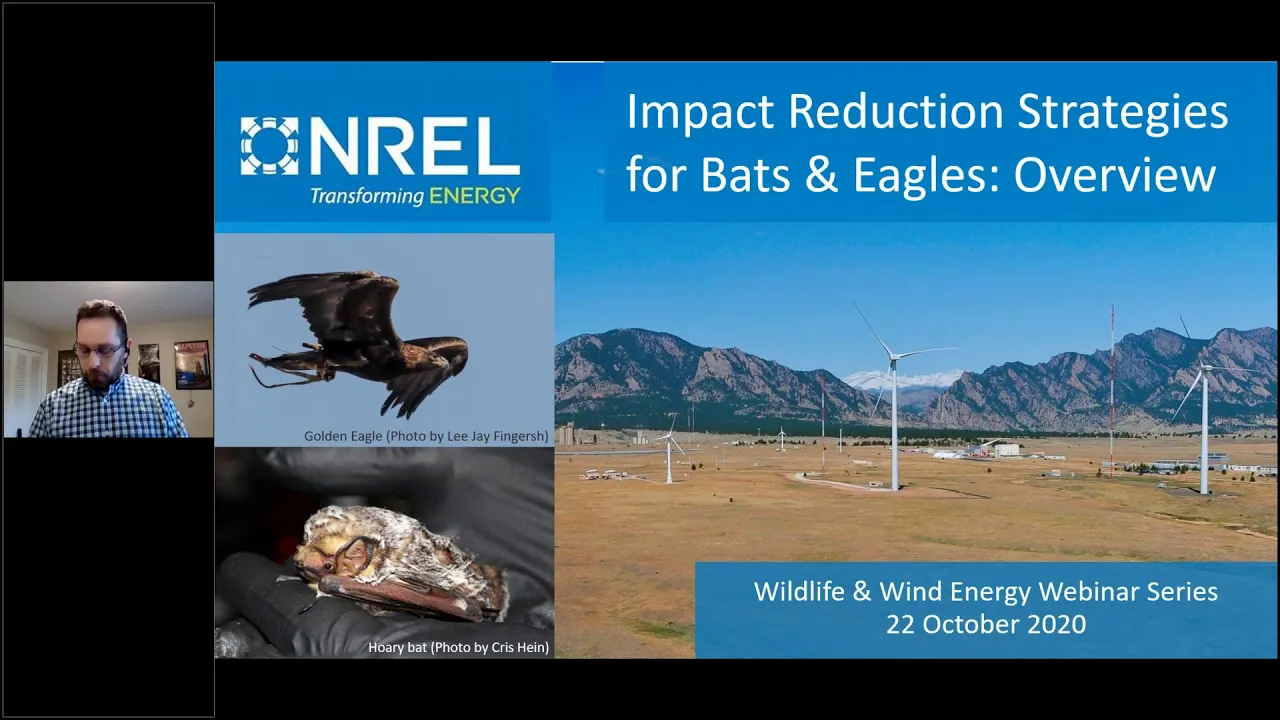
Webinar: Communicating Wind Energy Wildlife Monitoring Results
Added:Basic statistical concepts, particularly probability, statistical estimation, and how confidence intervals are constructed and interpreted.
The primary ecological impacts of wind energy infrastructure, specifically bird and bat collision risks and habitat displacement.
Standard field methodology for wildlife monitoring, such as carcass search protocols and searcher efficiency trials.
Fundamentals of science communication, including how to structure technical reports for diverse stakeholder groups.
Advanced statistical software and modeling frameworks specifically designed for wildlife mortality estimation, such as GenEst (Generalized Estimator).
Designing and implementing adaptive management strategies, such as operational curtailment, based on monitoring report findings.
The integration of wildlife monitoring reports into environmental policy, NEPA compliance, and wind energy permitting processes.
Technological mitigation solutions, such as automated curtailment systems and acoustic/visual deterrents for birds and bats.
160 views2likes1:27:28Original Release: 2020-10-19
hi everyone good day and uh welcome to uh webinar six of our nine part webinar series on wind energy and wildlife today's webinar is on communicating results uh a couple of housekeeping notes that we um bring up at the beginning of each webinar um everybody will be muted on on this on the webinar if you're having audio issues with your computer you may want to try calling in with your phone any other support questions you can visit the go to support website or call the toll-free number uh listed on the screen um this webinar and and all of the webinars in the series uh discuss you know complicated issues that have different perspectives um different stakeholder interests so we ask that um everybody assume positive intent of our speakers uh we want you to be actively engaged we have a couple of trivia questions to kind of break up the conversation um so please uh weigh in on those um when they come up and also if all goes as planned we'll have time for q a um at towards the end and you can ask questions uh using the q a feature for the the go-to meeting uh just a reminder um the tethys website is a is a great resource for um literature review uh there's also an events calendar and you can sign up for tethys blast which are a bi-weekly newsletter that [Music] gives you the latest and greatest on new reports publications events webinars conferences and such um and um on tethys we've we finally had a chance to post our first five webinars the the links are provided here on this page but you can also find them by looking at the events calendar and clicking on the links there uh we are i think once we get all of the webinars um on tethys we'll have a more uh have them all on one page so you don't have to go through that search process next week is webinar 7 on the 22nd from 1 30 to 3 eastern and then we'll have two more webinars after that we're still working with our speakers to set the the day and time and with that it's my pleasure to introduce today's speakers for this webinar um we have ghoni iscali from environment who is an environmental permitting manager for apex clean energy manuela husso is a research statistician at the u.s geological survey forest and rangeland ecosystem science center and julia garvin who is a senior project oh sorry senior ecologist and project manager at tetra tech um and so before i hand it off to um our distinguished speakers i just want to give a quick overview about communicating results um i think we all appreciate that it's a it's an essential part of having a successful project it should begin as early as possible and continue often throughout the study it helps build trust among the project partners and promotes efficiency you know making sure everybody is on the same page and it also relays important information to make decisions from um and really the end goal of any project and and for the communication aspect of the project is having the publicly available report so that the broader wind wildlife community can use that along with other data to make informed decisions that there's there's a lot of behind the scenes communication with any project among um the project team and and partners for the study what we're going to focus on today though is communicating the results to the broader audience so through technical reports publications uh presentations and webinars and in order to do this you have to be able to convey the methodology you use uh the the statistical analysis uh and in our our previous webinars um on on grouse bats and eagles we talked a lot about the the methodology used to study wind wildlife interactions um but for today's conversation at least in part we're going to talk we're going to um talk about the statistical analysis and manuela is going to give an overview of the generalized mortality estimator and evidence of absence statistics and and and tools and angoni and julie are going to talk give their perspectives on uh estimating mortality and then we'll spend um time talking about with our panel the the key aspects of of good reporting and so with that i'll hand it over to manuela for her presentation all right well thank you chris um can everyone see my screen yes all right i can't um yeah thank you very much chris and nrel for inviting me to talk to you today about uh jen s and eoa and then in that context communicating the results that they present i want to give a first a really big shout out to dan douthorpe who's kind of the mastermind behind jen s and evidence of absence as well as our co-authors for those two softwares the supporters that we had both in agencies and in through funding and through agency help and then a whole list of people that helped through reviewing and all kinds of ways in making them happen um i have to give a disclaimer to start with that what i'm presenting today right now is not been peer-reviewed and so it doesn't have the full backing of the usgs behind so when you're looking at a big pile of um data that you've collected in post-construction monitoring you might be starting out by asking yourself which estimator do i use um you might think about the naive one it's pretty easy to calculate but it doesn't have any way of calculating confidence intervals in it and it's actually not a very good estimator the sean belts is more complicated again it doesn't have software associated with it so it's um you would have to be on your own to calculate the confidence intervals around it the what people call the huso estimator does have software in the usgs publication ds729 and does give confidence intervals corner never gelt is a r package called carcass and the wolfbert estimator is in an r package called acme evidence of absence is also in our package called eoa so all of those have um have basically do the calculations for you so that you don't have to calculate these kind of hairy looking equations um and the last three give you including eoa the fourth give you confidence intervals which you'll see is really important to me and to accurate representation of your results but i would argue that this isn't really the first question to start with the best question to start with is what do i want to know um am i facing kind of a regulatory condition where i'm looking at a single species and want to know what's the likelihood that i am actually below the some set threshold or am i in a more general context where i'm looking at to see what the impact of mortality or impact of wind facilities is on wildlife mortality and i'm interested in just a general estimate of mortality for groups of species and confidence intervals over a fixed period of time if i'm in the first case with a single species of interest then chances are really good that eoa is going to help you if you're in the second case then chances are really good that jennist is going to help you so i'm going to talk about each of those and then following a quick a brief description of each and what it can do for you i'm going to talk about some of the things that i would like to see or i would suggest that people put into reports and of course that's my opinion but before we get there i want to start with the trivia question um it's in the eoa context but let's say that in at a particular facility um five indiana bats were killed in a in a given year and um the post-construction monitoring was such that it resulted in a g or a detection rate of about one in six bats being detectable or being detected on average so i want to ask you just quick gascults what's the chance of missing all five of those indiana bats 10 20 30 40 50 if you guys will just take that poll that'll be great and um we will summarize the results in just a few more slides so i'm going to give you a few seconds to just quickly say off the top of your head what you think the pers the probability is of missing all five of those indiana bats when you have a one in six chance of finding any of them chris you can tell me when to move on are you ready chris shall i move i don't hear you sorry i was um i had muted myself in two different places um yeah you can go ahead manuel okay all right so um why do you use eoa for a single species well because it gives you a really good idea of how many of that species you might have missed when you were doing your searching in this example i set the credibility level at fifty percent um with the site detection probability of one and six kind of like the same example that we just had um and in this case we observed three carcasses you can see right at the top there we've got a hundred percent chance that our our mortality is greater than or equal to three because we found three um over the last four years it also tells you then that you have a 50 50 chance that the mortality at the site during that time was somewhere less than 13 somewhere between 3 and 13.
really importantly in most cases when we're talking about regulatory issues and we're talking about managing over a series of years we want to know what kind of underlying mortality rate might one expect at this site and so eoa gives you that estimate you might alternatively want to know um not the what the sort of the max was but what's the best 50 interval or 95 percent interval whatever you want in this case uh eoa estimates somewhere between 8 and 18 carcasses that were likely likely i don't know got a 50 50 chance that the true number is within that bracket um in addition uh eoa does its best to look out into the future for you here we have a projection that is one of the visualizations that comes out of eoa down at the lower corner are those are the four years that we've already monitored and we have data from them so those are estimates of what might have happened during that period but then we take that and we project it into the future um if things go as they have and as you suggest they will that is you know you say what your monitoring is going to look like you say what your adaptive management rates effectiveness might be and then eoa will take that and predict where you're likely to be in 10 or 20 or 30 years whatever you choose in this situation the one we're looking at it looks like the the take limit was set at about 40 over 20 years so two per year and that out at the far right maybe at the end of those 20 years we might have we have a little bit higher chance that we're going to be above it than we are below it but that's a long ways from now this is just giving you an indication that given what you know right now you probably don't have a whole lot to worry about you're pretty much on target another tool that eoa has is a design module to help you minimize costs when you're trying to achieve a particular g that g is usually arrived at from discussions with all kinds of stakeholders and parties and typically what we're trying to do is be able to say at the end of the day that after having found zero or one or two um we can interpret that zero one or two like endangered species or species of concern we can interpret that um if we had a 90 probability of finding things um and we found zero that means something that means that maybe you missed one but very very unlikely that you missed two so you've got a good sense if you have a detection rate of 10 of 0.1 of 10 0 means a lot less it means that yeah it could be zero but it could be quite a bit more 10 20 or 10 15 um that you might have missed um quick quick uh return back to the trivia question chris what did uh how did people um respond in this and i'll tell you the answer in a moment yeah so we had um 12 percent uh respond to uh a or 10 for 10 percent uh 32 percent of the audience thought it was 20 uh 24 uh percent of the audience thought it was 30 and 14 of the audience thought it was 40 and then the remaining 18 thought it was 50. so really uh relatively evenly mixed yeah so um the answer is 40.
and so the 40 50 are pretty darn close um the way we get to that is that the chance of finding one is one and six so the chance of missing one is five and six the chance of missing the second one is five sixths times five six because it's you you miss the first one and you miss the second one and in probability you multiply when you have an and when we um take that out five times we've got five-sixths to the fifth and the answer is about forty percent so with a small detection probability the chance of missing all five uh is it's less than 50 50 but it's still pretty darn high all right let's keep going with the evidence of absence the the um design module this graphic is something that comes out of eoa and it shows you that kind of thick white line is the isocline for a g of 25.25 so that says on the y-axis you've got search coverage which is the fraction of carcass or sorry fraction of turbine searched combined with kind of the fraction of carcasses that you expect to fall within the searched area beneath the turbine so let's say and somewhere over here on the right i think is kind of a sweet spot whoops that's not what i meant um so let's say we had three quarters of our turbines searched and we also searched an area that comprised about 50 of the carcasses in with beneath each of those turbines that would result in 0.75 times 0.5 that's a about 35 percent coverage so that's that horizontal line if the area within that 50 that area where 50 are going to land is pretty visible easy to search or you're using dogs you might be able to achieve an 85 searcher efficiency so this tells you that with that combination of things you can achieve your your goal of a g of 0.25 now you can vary this is all under the context of keeping these things constant we've set our interval at 3.
we've set our um our best part or best model for persistence to be um to tell us that about 75 percent are going to persist from between the time they land and the next search but those things can be changed too so you can vary um what your search interval is how widely you search how many frag turbines you search whether you use dogs or not and come up with something that is the best for you in terms of cost um but still achieve that target g one other thing we did was work very hard with fish and wildlife service um in region three to look at adaptive management triggers and use eoa to say when when are we kind of looking like we might be getting in trouble relative to the to the um set take um how often will those triggers that we're getting in trouble fire needlessly and fire correctly and how do we balance that that management of the species with optimization for the production of the energy i'm not going to say much more about that but i later give you a reference for it how am i doing for time okay so i'm going to shift gears now and go to gen to gennest so these are all the estimators that we um showed before and one of the things that you probably don't know but might be interested in is that all pretty much all of the original authors of these estimators combined their their efforts to work on gen st um so we real oops we realized that in fact we could take each of those estimators and put them under a much more broad umbrella estimator um that kind of comprises all of them um the data that go into s so this is kind of a natural evolution of methods um it's just uh rather than really a new estimator it's an estimator that comprises all the others um it didn't require very much if any data collection chain process change we ask rather than making assumptions that you provide data on se and cp and dwp so that you can choose the best models and from it then we in return give you an accurate estimate of uncertainty that means that if we say ninety percent confidence interval then ninety percent of the time when you use that process the true value will be within that in within your interval um we account for all pretty close to all sources of non-detection sometimes it the most difficult one is the temporal um temporal side of things the estimator is as unbiased as you can get when g itself is not known but has to be estimated so by doing that and getting really close to unbiased we can give you meaningful estimates that then with those then you can do all kinds of comparisons and all kinds of trend estimation and and look at efficacy of mitigation if you don't have an unbiased estimator that's on the basis of all this then those those comparisons just become really mushy um and most importantly we give you confidence intervals it's a point estimate as i'll say later and i'll say it again um is just not very useful without some sense of how precise you are in making that estimate so speaking of coverage um and being good at cover having when we say we've got a 90 interval we um have a 90 interval um that's one of the major factors that we used when we compared gen est with four other estimators we combined um resources with paul robbie from west and two others um from west to compare these four five estimators we compared gen s with a known uh sorry with k parameter estimated from the data gen s with k assumed to be at a certain level the huso estimator where the not fresh carcasses carcasses that didn't arrive in the preceding interval are excluded um which is what we ask for people to do cue so where you put everything in even the old ones which we know is going to give you kind of a biased estimate for the most part how bias depends on how many carcasses enter that shouldn't um and then the schoenfeld and the only thing i want you to get out of this graph is that an ideal estimator would be right in that area it would be a horizontal line at point nine because we're looking at ninety percent confidence interval the genest estimator with k estimated enters that space at about with about at about 10 percent of the kinds of the simulations that we used and just stays there so ninety percent over ninety percent of the different simulations that were different conditions that we tried gen s got really close in its uh confidence intervals the others vary but what's kind of important here is that schoenfeld um didn't hit it very often it's uh there's a lot of the situations that we simulated where it didn't it just didn't cover what we it what it's supposed to cover i want you to know that we tried really hard to break it so we don't expect our estimators to be perfect all the time down here we're talking about maybe for example 10 turbines for which we only searched 30 percent of them uh with a g of 0.2 and we had an underlying rate of one animal per turbine i mean we're going to get abs very very little data to work with in the first place and the coverage is pretty poor under those conditions for any estimator it doesn't matter okay another question that's arisen is how does gen s compare to eoa so i calculated ninety percent confidence intervals for both of those eoa and gen s on two sided and a fifty percent two-sided confidence intervals for both of them under different conditions how many found was ranged from zero to five and the detection rate was very low at point one and then pretty moderate at point three but i don't know too many people who like looking at tables so i made this into a graphic that might be a little bit easier to see what i think you should get out of this is that they're pretty close they're pretty darn close they're right um but they're not exactly the same um julia julie pointed out that the gennest estimate tends to be a little bit towards the left a little bit smaller than the evidence of absence but we know that the gen s under these small conditions these conditions where we see very few carcasses tends to not cover as well as it should so under these conditions you probably would be better off using evidence of absence although the advantage isn't great so question number two trivia question oh um we're at a different site five indiana vats were killed but post-construction monitoring had a g of.63 almost uh two out of every three bats would be expected to be found what's the chance of finding all five of them and i'll let you go now we're gonna just answer that question right away so chris just let it go for as long as you want okay um right now we've got 25 percent of the vote or uh participants who have voted i'll wait until it gets at least a 50 okay yeah so here we have um [Music] uh 20 uh about 25 for a and b 34 for c uh and then less than 10 for both dne all right well that's good it's not fifty percent it's ten percent we do pretty much the same thing the chance of finding one is point six three of finding two is the product point six three times point six three all five is.63 to the fifth so we've got about a ten percent chance of finding all five so even though our moder our detection rate was pretty high for post-construction monitoring um the chance that we find all five of them is pretty low okay i'm going to move on now to um things that i i see sometimes in reports and would prefer not to uh point estimates are always wrong pretty close to almost always wrong sometimes we're dealing with you know counts we might get it right accidentally um but the intervals are the ones that we should be paying attention to so a single number with no uncertainty around it is just really not useful sometimes i see people take the raw data rather than the adjusted mortality estimates and try to get some inference out of that we might see something that says okay the proportion of animals of carcasses that were in each of these species groups was as represented here so we had 16 percent raptors 21 percent shorebirds and 40 passerines so from that you might think oh well that sounds like then probably we had about two and a half times as many passerines that were killed as raptors well proportion of raw counts doesn't really help you unless maybe you're trying to figure out freezer space or something but but it doesn't help you in understanding mortality because of the very different detection rates that some of these can have so if we adjust these these data by their detection rates we get a very different picture now we see that in this little example toy example we had eight times as many passerines that were likely to have been killed at this facility rather than two and a half times more passerines than raptors so the point is that proportions of raw counts are really very useful we we need to work on adjusted counts if you're tempted to provide an average of searcher efficiency or carcass persistence for your site that ignores or somehow averages over your factors that might influence those like visibility class or season or even size please resist it a national average of search efficiency just isn't meaningful at an individual site it's about as meaningful as a national average for height weight or iq is to you um the sort of what what this idea of averaging search efficiency or carcass persistence has led to is a um an exploration of an idea that is called integrated bias trials and i want to show you how that might lead you down a path you don't want to go down um so here's an example we've got a turbine with 100 meter search radius um in yellow and 50 meter search radius in gray um so with that those dimensions 75 percent of the area is in the outside ring and 25 of the area is in the inside ring for integrated trials they typically describe it as being just kind of setting the carcasses out um randomly evenly distributed throughout the the um the search area and throughout the time of search and then all they do is just count what comes back and use that as an estimate well let's say we set out 100 trials and because of the area and because of that uniform distribution 25 would be on the inside and 75 would be on the outside but let's say also that the detection rate in the inside is much higher than in the outside because the visibility class is really good um and it's 0.8 on the inside point 2 on the outside so of those 75 that were set in the outside we're going to expect to find 20 percent of them or 15. in the inside we'll we'll find 80 of those 25 that we put in there so that's 20.
but we won't know that right all we'll know when we do the integrative trials is that we found 35 of them and so 35 percent is going to be our estimated g well let's say that pretty reasonable that within 50 or sorry within 50 meters of the turbine we've got half of our carcasses land there and half of our carcasses land between 50 and 100 meters we know that density is not constant and that's pretty reasonable estimates so what we would really find is of the 50 that arrive in the middle we would find 10 of the 50 that arrived or sorry in the outside we would find 10 of the 50 that arrive in the middle we'd find 40 so we would find 50 carcasses but we'd use 35 percent as a g and we would estimate 143 were killed well that's way over what really was killed and it's because we have ignored factors that are very important to determining um the searcher efficiency or the or the g in each of those categories so the point is you can't ignore factors when you're doing integrated trials you still have to um separate the trials based on those visibility classes or seasons and so you have no no advantage in reducing the number of trial carcasses the uni that you need to carry out your study in addition you have the disadvantage in that you lose information that you can use to improve your protocol you don't really know why those 35 weren't found was it because you had too long of a search interval or was it because your searchers weren't good um or the visibility classes were too high or what it's like you don't you don't know and so you are you don't have any information with which to go on so that's my my little shtick on integrated tracks so a report i think if they give you um basically some information that allows you to get a rough estimate of what each of the different detection probability or sorry the different factors that enter detection probability are you should be able to calculate a rough approximation so you should be able to take what was found x the number of carcasses divide by what they say was their estimated m and get an estimate of g is that reasonable if by doing that you you find out that g looks like it must have been about point eight um but you know that they searched um they only searched half the turbines there's no way you're going to get a g of 0.8 with a by searching only half the turbines so it just gives you a big a good rough approximation rule of thumb to just see what's going on so basically include the monitoring period the oh geez i'm a bit over the number of turbines searched how often how extensively the factors that might affect detection um and the number of trials per factor combination that you use not just like i put out 150 trials if i put out 150 trials but there's three size classes and three seasons um that's nine classes already and two visibility classes in each now we're up to 18.
18 different factor combinations divided into 150 carcasses that's not even 10 each that's not enough with which to really make good estimates of any either searcher efficiency or carcass persistence and finally of course the number of carcasses found so ideally you can use some of the stuff that comes out of gennest ideally i'd like to see a table of the models that were compared for searcher efficiency and carcass persistence and that gives me the evidence of why you chose the one you chose i'd like to see how that model compares to the saturated model the full model like if i used all my factors um where do where do things um where do things differ in terms of either p and k in this example or in terms of r i'd like to see um graphics of how the different distributions for cp compare with one another and how they compare with the underlying data that's the dark black line here um i'd like to see tables of estimated search efficiency and carcass persistence with confidence intervals of course and very importantly how many carcasses trial carcasses went into each of those estimates and finally for the total mortality i'd like to see um a table that represents the mortality and confidence intervals of the groups that are of interest so here we've got three different bat groups and two birds and each of three different seasons that's important to us and we give how many were found so with that um i've got plenty more that i could say that i've run out of time and i just wanted to give you the references that you might be interested in looking at and say whoops say thank you for your interest great thanks manuela um and now we'll go to um julie um and so julie take it away hi there so first i would like to thank um chris you know all the all the folks from nrel and defenders of wildlife for inviting me to be part of this webinar um to thank you um so i'm going to sort of um take some of the points that manuela was discussing um which are really sort of uh the the state of the science and then sort of translate how sometimes we've got to make think about how the rubber meets the road when planning some of these monitoring and planning the reporting so a lot of this is intended more at a higher level than talking about individual estimators or confidence intervals these are just sort of lessons learned as uh on behalf of myself who is a consultant and is also often working for clients who are trying to navigate this this ground of performing monitoring and and making it the most making the most of it so the first point i'd like to recommend that anyone who's considering performing some monitoring at the site that when you're thinking about this you want to begin with the end in mind so that's taken straight out of stephen covey's seven habits of highly effective people so you want to think about just as manuela mentioned why is the monitoring being performed why are you going to spend this money and mortality monitoring is not cheap so think about why you're spending this money what questions are you trying to ask have they already been answered a site near you in which case can you answer a little bit different questions or what is important to you as an operator or the agencies or your financers once you've come up with the study objectives stay focused on that as you come up with your study design so if the study objective is to determine how many eagles were were killed at the site that answering that question is going to be very different than trying to answer a question of how many rare bats were found the methods are not necessarily going to be the same for those two studies similarly collect only those data that are relevant to the question being asked it's very easy to look at templates and pre-existing report forms and just fill them out and crunch all of those numbers but that could end up leading to a lot of wasted time and excess data that just sort of blurs the picture and gets away from the question that you're trying to answer we all know that the best laid plans never last engagement with the enemy so be sure to track the departures from this wonderful study plan that you've developed uh why the search schedules had to be uh changed maybe because there was maintenance being performed or there was icing on the blades and there was a stand down maybe there was some mandatory maintenance from the turbine manufacturer and the whole site was shut down for a month that's going to affect the collision risk for that study that's happening so be sure to track these things um in real time as they go through and uh don't leave data qa qc or quality assistance equality assurance and quality control to the end of your study that i can say with much confidence is a recipe for disaster knowing what are some of the issues with your data your data collection at the beginning and ironing those out early on will prevent data loss and will also make it easier to roll into reporting and data analysis at once the study is completed so doing those things in real time will allow you the flexibility to fix the problems as they arise instead of realizing after the fact that you have some pretty serious data gaps another one to keep in mind is that when you're performing monitoring on an operational win facility there's lots of different people there from and they all have lots of different jobs so it's really important to clearly establish the roles and the communication procedures so something important is found whose job is it to report that who do they need to report to do they need to report it to a federal agency a state agency how quickly does that need to be reported what kind of data needs to be collected and whose job is that is that the role of the turbine technician or is that the role of a third-party contractor so it's really critical to have these things laid out ideally before the study is even implemented so everyone knows what their job is next slide please so similar to the sort of first lesson for monitoring i've been using the same one for reporting as the report is being prepared make sure to begin with the end in mind and have this report answer the question that the study is asking and stay focused on that study objective if at the end of the report you haven't answered the question that's being asked you should if you can't answer the question you should know why it couldn't be answered um as the report is being structured it's really important to know the audience is this report going to be kept for internal purposes only is this going to go to financers who have other questions that they might be asking uh from the monitoring study is this going to federal or state agencies to look at are they going to be providing input on the report so the answers to those questions will definitely influence what kind of report is prepared and similarly to my caution about only collecting relevant data similarly you only want to present relevant data and it's very likely that much of the data that you collected during the monitoring doesn't rise to the level of importance that it needs to be presented in the report i would like to say that if a report is not read there's some blame perhaps to be laid on the people who receive the report but the report author is just as responsible for making sure that the report is one that's easy to read and is going to be read by the recipient so uh related to the data analysis just what as underscoring something that manuela was saying is show your work just just like in elementary school um show the methods that you used um what what turbine searches were missed um how did you model your data what models did you select and what method did you use to select those models how did you generate your confidence intervals um having a report that concludes hey we did this sort of searching we found one dead eagle and we think that maybe there were actually five killed uh how do you know that what's the level of confidence you have in that statement that's really critically important more so perhaps than even the number so and then another key factor for reporting is that the report is pretty much the only record that the monitoring occurred so this is the first and last impression that um of the study itself so that makes it incritically important if money has been spent to perform and implement a really well laid out study having a quality report that reflects the quality of the study is really critical a shoddy report is going to make the reader infer that perhaps the study itself was not that well planned and that may be very inaccurate impression next slide so one of the things manuel also talked about with some standardization and i would also underscore that at least in the industry uh we would recommend that the fatality rates are percentages per megawatt because uh turbine technology is changing so rapidly that's a more appropriate metric to enable comparison uh rather than per turbine and also that having a study period being accurate to the study period that was actually studied is important so if you only studied it for two seasons or three seasons don't provide or don't state that your estimates were for a year unless you actually did extrapolations to stimulate what they would be for a year similarly provide 90 confidence intervals on all of your important metrics and provide the methods for how those were generated uh another thing is that a tendency is for many fatality estimates to be presented for small birds and large birds and it's important to define those terms and how those size classes were selected so that when you have a large bird estimate and you compare it to a large bird estimate from somewhere else that you are comparing apples to apples similarly if you're going to make some comparisons uh and that is really important to put the results of the study into the appropriate context perhaps the fatality estimate for bath was incredibly low at your project well maybe it's important to mention that you were actually searching for bats only in the winter when bats were not expected to be found um so and that just is similar to the second the next point below which is to clarify the caveats in the comparisons if you're taking the results of your study and you're comparing it to all of these other wood facilities in the midwest pardon me you need to mention um perhaps relevant factors so if your study is in grasslands point out that not all of the studies that you're comparing it to might be gross ends maybe some of them are agriculture and that could affect the appropriateness of comparison and then um i'm sorry so then the a really crucial piece and this may or may not be in the report is communicating the implications i'm sorry i need some more water so this may after conversation with the client or whoever is is the person providing the funds for the study if they may not wish to have any important implications presented in the report for various reasons maybe depending on the audience but as the person who is implemented or at the company who's implementing a study it's critical that if there are important implications that those are communicated to the funder um even by phone if something alarming or something that has implications comes up it is it is really the responsibility of the researcher to communicate those um along even if it does not fall within the aspect of the report and um that being a very serious note i would like to move along to a little bit lighter uh poll so if monitoring was performed and a report was prepared but nobody read it did the study actually happen and this is more of a opinion piece so i'll pause and let people pick which one they think feels the best all right we've uh people are starting to weigh in here give them a few more seconds we've got about 25 percent of the audience voting right now all right so we're we're at about 50 um and a uh c is actually the most uh selected answer uh with 44 followed by a 31 percent and then um the others have uh 10 or less so again you know they're this is more of a philosophical question a tongue-in-cheek but i think it emphasizes the number of points first of which is um really how important was this monitoring if no one was planning on reading the report so think about that because the monitoring costs some money so if if it was you know for no particular reason then perhaps perhaps i could have been a wasted opportunity another thing is that as i mentioned it's the responsibility of the study um implementer to write a report that is going to be of interest and equality to be read um and to just think about what are those questions that the study is designed to answer and if the answer to the question doesn't really matter such that you didn't read the report then perhaps the study didn't need to be implemented to begin with so i guess i would like to pass it along to goni thank you julia thank you for having me today and i wanted to continue to talk about some of the considerations when reviewing and comparing reports one of the main important considerations in my opinion is looking at the report and seeing which fatality estimator was used so as new and improved fatality estimators come out i think it's important to note that the point estimate and the fatality estimates may not be easily comparable so they're not necessarily comparing apples to apples in a study that we completed we actually used the genus versus whoso versus schoenfeld estimator to do that exact comparison and see how the different uh point estimates and confidence interval compared and in that example jennist ended up being the estimator with the highest point estimate followed by whoso and then followed by schoenfeld however the confidence intervals for all three estimators overlapped um talking to other industry folks i've heard that that at times have seen different results so they may not have necessarily seen genus as being the highest point estimate so again the point is that we need to be careful as reviewers and as agencies when we are looking at reports and comparing estimators and keeping in mind that again the comparison may not be apples to apples in my experience i think another factor that greatly affects estimates is the area correction it seems like that searcher efficiency carcass persistence the amount of area searched at least the method for calculating those variables is somewhat standardized but the methods that you use for calculating the area correction and even the restrictions and the assumptions that you put even if you are using the same methods can have a great impact on estimates so when looking at reports we need to be looking at not only which fatality estimator that we used but also what factors and assumptions were used for that estimator as far as reporting i would say that it is a gift and a challenge to try to devise a report that's detailed enough and has that sweet spot of enough details reports pretty much should be detailed enough so that the study can be replicated and we do have information where it can make it easier to compare reports but at the same time the report needs to be as succinct as possible time for reviewers and agencies as you guys know is limited so it's probably not necessary to list every interesting trend that we see in a report the level of detail for a report should really be tied like julian manuela mentioned to the objectives of that compliance so listing out those details where you answer those questions for your objectives and compliance and i also think that it's important in reports to include the history and paint a picture of the project and the region so at times i see that a lot of reports don't include communications that you may have had with agencies related to the study what minimization strategies you used how many years of operation the project has been under so if again those details are included reports can be more standardized easily compared between years and tell an evolving story of that project and of that region next slide please so next i want to talk about evidence of absence or eoa like manuela mentioned this is a take estimate for a single species usually used for incidental take permits it's a way that you can standardize your compliance requirements and as manuela mentioned it's also a way that you can monitor both the short and the long-term take of permanent species for the lifetime of the permit or the lifetime of the project whichever comes first however some of the challenges with eoa is that determining that you did not have take can be really challenging with low monitoring especially when you don't have any of the permitted species on hand so again with eoa you're trying to detect a rare event and determining that that rare event didn't happen at times requires a lot of monitoring on the other end of the spectrum i know we heard recently from agencies on the siding conference that industries should consider doing compliance or getting incidental take permit for migratory tree baths such as the hoary bath and the moment that i heard that i thought how will eoa behave if the permitted species is not rare so if you have a species like the hoary bat where you have perhaps lots of take at your project and that take varies widely from year to year how do you devise the permit and use eoa for the permanent take of that species and is eoa the right tool i'd actually love to hear manuela's perspective on this some other challenges with eoa is again we tend to think of it as in my experience i work a lot with indiana bats we tend to think of it as the take estimate for the indiana bat but really it's the take estimate for abat eoa does not take into account the biology or species specific info especially for rare events such as the indiana bat where we don't have a lot of information about this species so we're really using all bats as the proxy to make assumption about that species so in my opinion even though eoa is the best available estimator that we have and it should be the primary tool to use for compliance i think it could be useful to figure out other estimators or other tools that you can use and preferably ones that do use species specific or biological specific information to compare those results to eoa so one of those methods that i'm aware of is the species composition which is a really crude analysis but again it is a way that takes into account some of the biology of the species and i'm not sure if there's others out there next slide please so lastly i wanted to talk to you about g the advantages of g or the detection probability that's related to eoa is that it's a way that it can standardize monitoring requirements for incidental take permits it can also be or it should be project specific if you do have project specific data and whoever devises the monitoring using g does have have some flexibility of how that monitoring is implemented based on g the challenges of g of course and reaching a higher g are cost and the cost of g varies widely by regions seasons and projects in terms of regions my experience is mainly in the midwest where you have to do crop clearing in order to get a reasonable g or to get a higher g and that crop clearing can be really expensive so to reach a geo example 0.2 in the midwest can be a lot more expensive than reaching that same g let's say out in out west or out in a grassland type of habitat in addition seasonality can impact g so the risky periods for bats in the midwest is generally summer and fall and those coincide with the seasons where crops are the tallest and require clearing so doing more intensive monitoring during those seasons is obviously more expensive and then lastly implementing g5 project can also vary in terms of costs because you may need to do different size of monitoring depending on or different types of monitoring depending on the size of the project the size of the turbines for the project how many participating landowners you may have the size of your plots that you can allow for and even the size of the gravel areas or roads and pads that you can search and that relationship of g and cost is not necessarily linear i would say it's more exponential that that cost tends to get higher the higher the g that you have to reach in my experience it seems like with each project you tend to have an optimal g or you tend to reach g to a certain point fairly easily and then to increase g after that can be greatly expensive because once you max out the number of your landowners and the number of turbines that you're searching increasing sometimes the size of the plot for searching out further will not necessarily getting get you a higher g depending on the area correction and similarly increasing the search frequency if you have a specific carcass persistence may not again get you that same increment of g so what i'm trying to say is that in my experience i've seen that a lot of times increasing g from let's say 0.15 to 0.2 is somewhat expensive and then going from 2 to 2.5 can be a lot more expensive the last thing that i want to mention is that we have to keep in mind that g is a goal and not a guarantee so we design a study with g in mind but we have no control over what happens in the field during that study i mean we have no control over participating landowners and what they want to do with their land whether that land is flooded many many variables can lead to or let's even things that are not necessarily human related searcher efficiency carcass persistence all those things can be different than when you're expecting them to be at the beginning of the study so i think that just like with estimates it is best practice to include a confidence interval around g and have some flexibility especially for compliance i don't think that compliance should be tied to an exact g because again we have no guarantee of hitting that g and no control over hitting that g depending on how the study happens so with that um i conclude my presentation and i'd be happy to take any questions thank you thanks goni and thanks julie and manuela for the presentation so we have about um 25 minutes for q a and we do have a couple questions rolling in and i have a couple of questions that we can start off with as as the audience formulates additional questions julian gone maybe from your perspectives [Music] aside from the report what else do you do to follow up or to communicate results whether it's with an industry partner or with agencies to to ensure that the that you've communicated the results of the study julie you want to go first or you want me to go first yeah i mean i would say one of the best ways is to have a conference call so submit the report give everyone a chance to take a look at it and then you know host a call where the report can be reviewed together and the pertinent questions can be discussed and i would say on my end again no one likes surprises i expect consultants to call me the minute that they find something that can affect compliance and i in turn do the same with agencies because they don't also want to see surprises i mean especially if the report is related to some kind of compliance where you have to change your adaptive management or what you're monitoring or how you're doing this monitoring those things take a while to get rolling so we want to hear as quickly as possible and get that information to the agencies as quickly as possible and start making those decisions okay great that's one of the um avenues that electronic daily collection has really um increased our abilities to do that i mean it's almost real time where you know the agencies can have all the relevant information to answer their forms and their questions within a very short period of time um from when it's actually found and then you know communicated to the site and onward so that's that's been a great advance right those that's that's great and that um it points to the need to communicate uh often throughout the study so that everyone stays on the same page um manuela you referenced um the report by um with uh paul robbie as the the lead author um is that out now or is it forthcoming it is it has been submitted to awwi who commissioned it and i don't know if they released it or not um dan and i are planning on writing a kind of a a more formal usgs product that can be cited rather than just a report it's a little bit carries a little bit more weight and we would still be writing that with paul and jared and but that's probably going to come out maybe towards the end of the year okay and you're also working on a module and an addition to the the genes software which um is related to density weighted proportions and calculating the dwp um can you update us on the status of that yeah that should be going out for review um probably next week this is what goni referred to as area correction we call it density weighted proportion um it's it's all about trying to get a handle on what fraction of the carcasses that were killed would land within the areas that you search and as she pointed out correctly it can be quite variable from site to site and from who's calculating it or trying to get a good estimate of it it's it's a pretty tough thing to estimate to estimate it's hard to get enough data but um yeah that module is coming out hopefully for review in the next week or so and then um by the end of uh of november it'll be out in public as a um our program great okay here is a question from the audience um in your experience uh and this uh is for all of you if you receive a report that doesn't meet your expectations what what actions have you taken um kind of after the fact you know after you've received the report and what would you recommend um in in the future so that something like that wouldn't um you know happen again maybe i'll start um i think that tends to happen from time to time um i think the best way to deal with it is to have a conversation with that consultant and try to figure out where the mark was missed and what needs to be included in the report honestly i feel like a lot of time it's a miscommunication especially when you don't work with consultants a lot um so yeah with with consultants that we do work a lot we actually take a lot of time to develop templates and kind of set those expectations for that exact reason just because it can be so time consuming when you receive something that you didn't expect and now you kind of have to start changing everything from scratch okay yeah i would say one of the things um that so we are sometimes asked to review reports prepared by other consultants that are that are you know maybe they're quite old or or whatever and and we will often you know the the client has asked us to provide feedback and so we will um often you know have a conversation really with you know okay well why is this missing from this report is this not something that you requested and we would say you know for future studies um these are components that you should request your your contractor to include because a lot of the clients are guided by what the consultant says they need you know that's why they're relying on consultants so um i think uh there's there's sort of that responsibility there but then also consultants might have opinions like well these are things you should include and the client said no i don't want that don't put that in there so so there's a balance and again communication is key and of course there's that saying that the greatest myth about communication is that it actually happens so um you know having that conversation during during the rfp process and during uh sort of the kickoff to make sure like okay this is what we're expecting to see for a report have those expectations made very clear at the beginning okay um [Music] manuela one of the one on one of your slide you you mentioned um some challenges with using a national average um for searcher efficiency and carcass persistence um what are your thoughts on if if you collect that data in the first year of a multi-year study at the same site and using that that first year data for subsequent years rather than collecting it each year um i think that that's something that needs to be answered with a biola biologist's hat on and not a statistician's hat on if if you have reason to believe as a biologist that the carcass the scavenger population hasn't changed and that your search process um hasn't changed radically you haven't changed crew the people are about the same or the dogs are the same then it might be justifiable to use past estimates for current current projects but it's not i mean statistically i can't tell you whether it's good or not it's it's a biological biological and an inferential question okay um it gonna julia any follow-up or thoughts on your end about using um your experience maybe with uh using one year of data for subsequent years so i guess that um i would i would just mention that that's an approach that's been um uh proposed as a cost-effective strategy for for long-term permits uh sort of recognizing that the carcass persistence and search efficiency trials are an additional cost and for example if you're looking if you're if you've got an eagle take permit and that carcasses that you're putting out there can be perceived as bait for eagles um you know that's something that you're trying to to minimize so it's it's a balance of trade-offs um and i agree that you can go in with that being your approach but then if you have a boom in like the local coyote population part way through then you need to ask yourself well that data we collected three years ago is do we think that's really representative of our site conditions now and if it isn't you're doing yourself a disservice by not measuring that changed carcass persistence i think it'd be great if eventually we can get to a point where we have enough regional data to come up with those estimates honestly from my experience it seems like those estimates are project specific but somewhat similar in the region we do tend to have outliers from time to time so if we do have enough data to come up with a regional estimate that's great and then maybe you can do something like spot check that estimate every few years just in case conditions at your site may have changed always keeping in mind that um there are certain factors that we we have identified pretty well now that often have an effect and so yeah it might be regional but regional for a visibility class that's relatively well defined and consistently defined across the region as being easy versus moderate versus difficult um for size classes that are consistent as julie was saying so those kinds of things still need to be kept in mind rather my objection was to a single searcher efficiency that represents an average across all of those factors which is going to get you into nothing but trouble um okay so here is um put your futurist hat on um you know there are a bunch of technologies being explored various stages of development that might be used in lieu of our standard post-construction mortality monitoring or you know in the offshore environment where we can't um do pcms um so one have you had any experience in in in testing some of these technologies and how they compare uh to uh post-construction monitoring such as use of cameras um vibration sensors or you know some sort of strike detector um and or uh if you haven't what are your thoughts on how we might use those or test those and see how they might relate to post construction monitoring i think it'd be great if we can get to a point where we can utilize technology instead of people um i think it can be cost effective and if it can be cost effective and easily implementable the industry would be all about it my experience was at one project where we did use a camera based system to test that to test detection exactly the system was still in its infancy just piloting and it turned out that the modeling that you need to pick out carcasses from the background from those cameras can be really really complicated and you need to continue to work on refining that it tended to be more difficult in plots instead of gravel areas so in plots that were more similar in color to bats and maybe more variable in their vegetation it seemed like the camera system was struggling more with that so we didn't get a lot of great results from that study but i think that studies like that and technologies like that need to be continued to be tested and would be great to have that as a tool available yeah i i have not personally worked on a study that's had some of these other um technologies implemented and i think it's largely because uh many of them are still sort of working the kinks out of the algorithms that they're using to either detect the the thud with the wind components the wind turbine components or or the carcass on the ground um i think uh just myself i think it seems the most logical and cost effective would be detecting the impacts with the wind turbine and then you not having to control the the ground surface characteristics because if you are having to pay for lost crops in order for those camera systems to work then you've lost a lot of your cost efficiency so i think there's some great promise there but we're all still kind of waiting for the technology to be more cost effective and it's it's alarming to think about you know 150 or 300 000 a year of people searching for dead stuff under turbines being the cheap option and i know the industry as a whole would love to see that doing that that funding doing something that actually lends itself to conservation as opposed to just counting dead stuff yeah i've had a little bit of experience in working with oregon state university to try and do kind of a combination of thump detectors and um location detectors so i think a lot of it has to do with species i can conceive of a a system that detects a collision and would be able to distinguish between the collision with an eagle or something very large maybe it's a turkey vulture but it's something very large versus you know a hummingbird or a bat bath so it might be a combination of efficiency in the searching process you detect the thunk of something big you have cameras pointed along the along the blade that give you just kind of a sense of where the blade was when that occurred and so then you can be very efficient in where you go look for it and then you go look and see whether it was a turkey vulture or an eagle so instead of doing you know a search every week or every two weeks of all these areas you only search when you think that there's something to search for for bats that might not work so well there's a lot of things out there that could get hit and and it would sound like an indiana bat but i think there's a lot of opportunity at least for species specific that we're interested in and there's the um it's a great strategy and we we've been discussing um you know some of this imagery thermal or drone searching where then you have somebody come and check but part of the problem of course is that if the bad fatalities are harder to detect the thump and they're also harder to find and they get they can often disappear like the ones that disappear quickly like disappear often the night that they occur so unless you have somebody who's gonna go walk out to a turbine at two in the morning um you know that that still uh allows for a lot of data loss great okay um so a question from the audience it was mentioned that integrated bias trials can lead to estimates that are biased high in your experience what is the potential magnitude of this bias for a typical project so first of all i don't think the direction of the bias is is necessarily predictable it's all about that combination of how the the interaction of the detection probabilities in the different categories that you are kind of merging over relative to the arrival rates in each of those categories so it could go either direction it could by chance be spot-on but it would just be chance um and so i can't i can't even begin to try and estimate what the magnitude would be it's all it's all about what you're merging over or combining and what the relative arrival rates are so i didn't i didn't mean to imply that it was always going to be an overestimate it could easily be an underestimate under other conditions okay um what um so there there are some challenges um in in communicating results um uh there are there are you know the quality of the report we've got um different estimators used over time um some confidentiality um you know what what do you think going forward is the best way to communicate results um from a project from a region um you know and or how do we overcome some of these challenges so that we're all working on the best available information uh to to make the the right uh decisions so i guess um i've i mean manuela was working with awwi and i'm also working with them on a research project looking into potential effects of turbine size on burning bat mortality and the the data that's been assembled in the aww information center is extremely powerful and i know that they're always reaching out to other wind operators to have the studies go into that and i think the confidentiality they've they've set up um protections so that those concerns have been addressed and uh canada also has a comparable database for studies in their country and but you know leveraging the you know having that be this this controlled set uh confidentiality's been addressed and using that information to to learn from each other and try to look at you know population level effects or or the big picture questions i think is is you know ultimately we all want to get there so that the burden of well what's your one facilities impact what's that when facilities impact we don't have to be answering that question we can be looking at it as a whole yeah i completely agree with that and that way someone from awwi can look at those different variables that vary and can be informed enough to see if different estimates should be comparable different results should be comparable how do we make them apples to apples how do we come up with an estimate that's having the least amount of bias and comparison challenges i think um yeah going forward i guess um standardization of the way that we collect data one of the problems that awi has is that the data that have been submitted may include for example it may include raw data for calculating search efficiency in various different categories or it may just give you an average searcher efficiency for all categories which would in my mind be a very a mistake to use so if we can make sure that people are submitting their data in such a way that that it's consistent across the different studies that would go a long ways one of the advantages to using gen est or something like gennest is that the structure of the data is pretty pretty set so you know that you have to submit this kind of data for search efficiency this kind versus carcass persistence this kind for the car for the found carcasses it makes it really easy for someone to submit those files to awwi and from there whoever has permission to use them can um can use them easily okay great thank you um i think we're just about out of time so i want to thank the three of you uh for for your willingness to be a part of our webinar series um and um just a reminder that we we have three more of this nine webinar 9-part webinar series if you have any questions you can email shaina or pasha at the email address is listed here you can go to the tethos website and register for these webinars and with that uh thanks to everyone who attended today and we'll hopefully see you next thursday for the webinar seven thank you bye thank you
Up Next
3:06
Bats & Wind Turbines: Smart Curtailment Strategies for Clean Energy
@TheUniversityofMaine
350 views•2019-04-02

15:54
Life in Biosphere 2: Sustainable Ecosystems & Human Survival
@TED
334.9K views•2009-06-16
14:30
Microplastics Everywhere: How Plastic Impacts Our Lives
@TEDx
100.9K views•2018-05-08
10:28
Ice Stupa Artificial Glaciers: Solving Ladakh's Water Crisis
@SonamWangchuk66
3.2M views•2015-05-03
Related Study Plans & Knowledge Roadmaps
Structured learning paths in Environmental Science
environmental-science
Ocean Noise: Cetacean Impacts & Mitigation
01Fundamentals of Underwater Acoustics
02Marine Mammal Bioacoustics
03Anthropogenic Noise: Shipping & Seismic Surveying
+ 2 more learning modules
16h5 modules
Explore Roadmap
environmental-science
Road Ecology: Corridors, Overpasses & Fencing
01Foundations of Habitat Fragmentation and Carnivore Ecology
02The Road Barrier: Ecological Impacts of Transport Infrastructure
03Principles of Ecological Corridors and Connectivity Mapping
+ 3 more learning modules
14h6 modules
Explore Roadmap
environmental-science
Ocean Acidification: Kelp Buffering & Shellfish
01Fundamentals of Ocean Chemistry & pH
02Chemical Pathways of Coastal Acidification
03Bivalve Physiology & Calcification Under Stress
+ 2 more learning modules
18h5 modules
Explore Roadmap
environmental-science
Ice Stupas: Glacial Retreat & Water Security
01Foundations of Glaciology & Mountain Hydrology
02Climate Change and Glacial Retreat Dynamics
03The Science of Ice Stupas & Artificial Glaciers
+ 2 more learning modules
14h5 modules
Explore Roadmap