







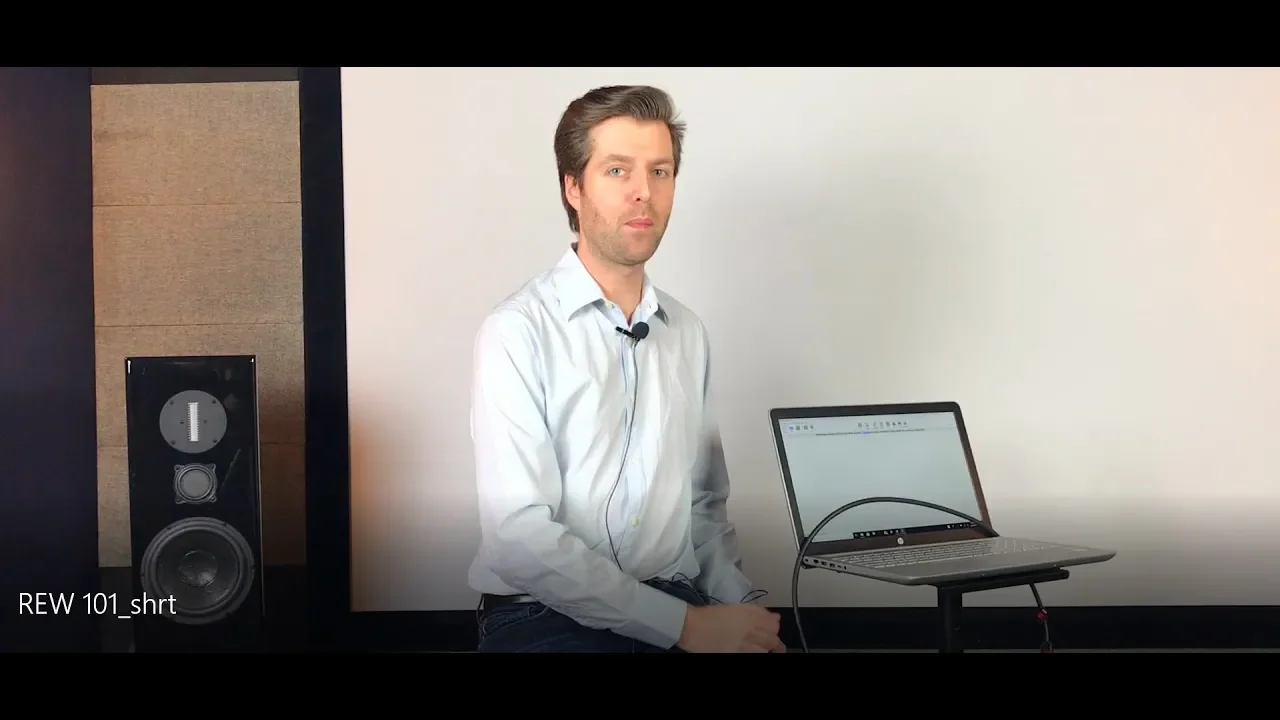










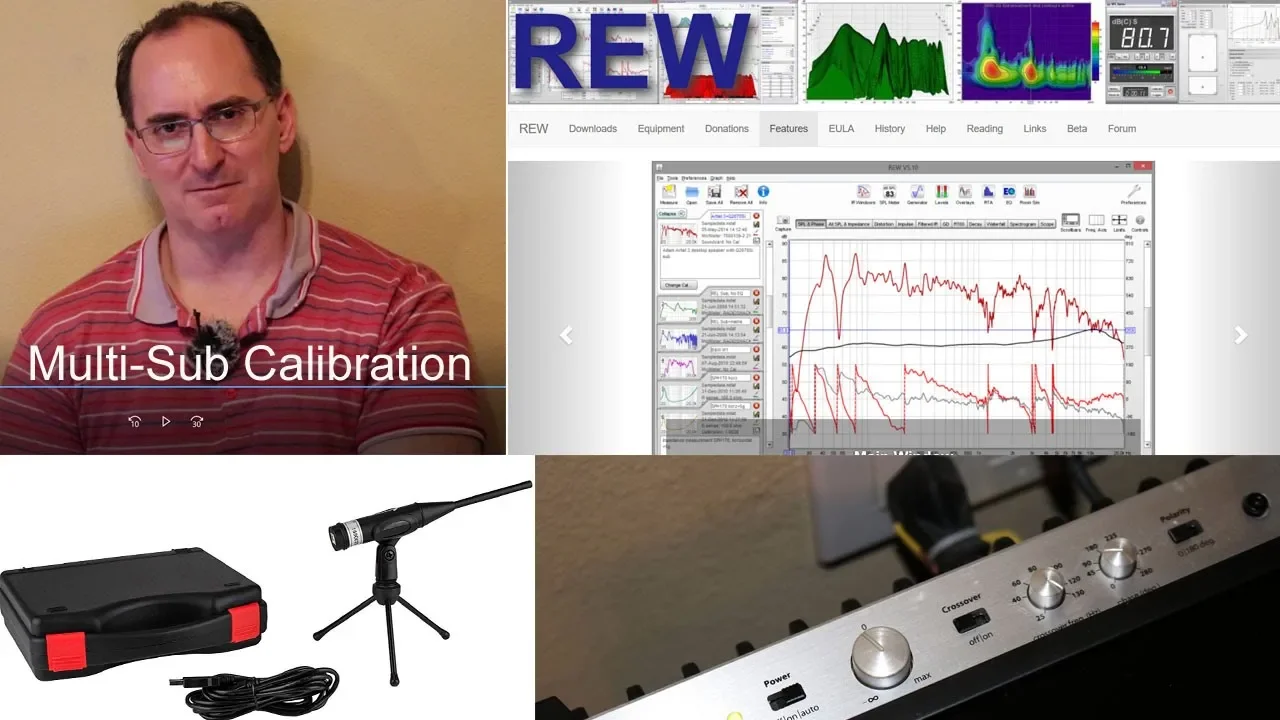


This video teaches how to analyze acoustic measurements using Room EQ Wizard by examining multiple graph types including SPL/phase graphs (for overall tonal balance), impulse response/energy-time curves (to identify reflection timing and source boundaries), waterfall plots and spectrograms (to visualize frequency decay patterns), and RT60 measurements (for reverb time analysis). The instructor emphasizes that while SPL graphs show frequency response, they don't reveal the complete picture—other graphs are essential for understanding reflections, decay times, and treatment effectiveness. Practical examples demonstrate how acoustic treatment affects measurements, showing that proper analysis requires examining all available data rather than relying on a single graph type.
How to Analyze Acoustic Measurements in Room EQ Wizard
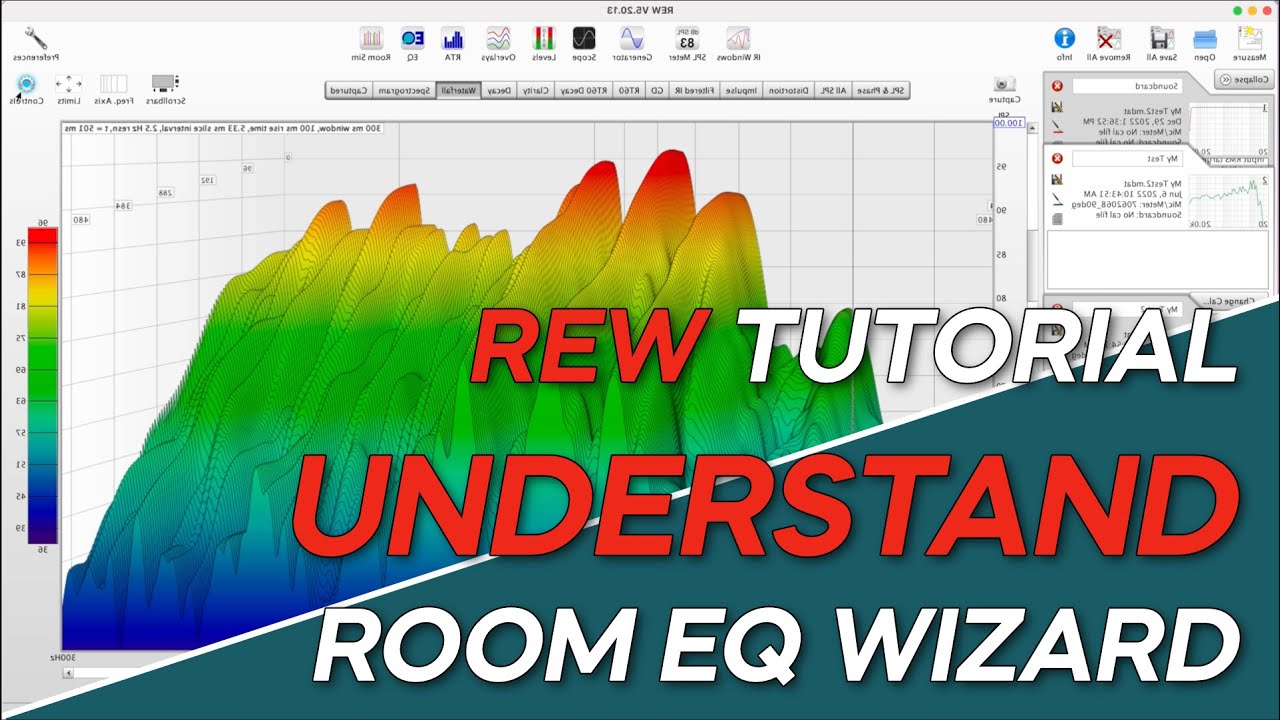
Added:so you've taken measurements of your room but now what what in the world should your measurements look like which graph should you use and how can you take what your measurements are showing you and turn that into an action plan for improving the sound in your studio i'm graham with music city acoustics and in part two of our series on rew we're gonna answer all of those questions and help you make sense of your acoustic measurements if you haven't already seen part one click the link right here and then come back and watch this video it'll make a whole lot more sense so let's jump right in in order to actually be able to analyze things well we need a complete measurement set so we're going to either measurement of your left speaker by itself your right speaker by itself and then the left and the right speaker together and if you're using a sub you're also going to want the sub by itself as well as the left and sub together the right and sub together and then the left right and sub all together as you'll see when we start going through measurements we don't always need that complete set of measurements but if you're sending measurements off to us or somebody else to analyze or you want a better understanding of what's going on in your room it is important to take all seven of those measurements so you can get a full picture and understanding what's happening and then a couple of quick notes and tips on taking measurements you want your measurement microphone to be at ear height when you're seated in the listening position and it should be equidistant from your left and your right speaker so to be perfectly centered in your room so in part one you may have noticed that i said you need tape but it didn't explain why and it's just that you can mark the location of your speaker stands and your microphone stand so you can put things back once you determine where the best location for those is in your room it's incredibly important to use consistent settings when you're analyzing different measurements so let me show you really quickly what can happen to a measurement if you zoom in and then zoom out let's use this measurement here as an example i've got my normal view limit set and if i start to zoom out on this measurement you're going to see just how flat we can make what is obviously a very wavy and inconsistent looking graph look nearly ruler flat so as you can see the same measurement now was incredibly smoothed out and it's not going to really reveal any information to us about what's happening in this room that's why it's incredibly important to standardize your view settings so you're always looking at measurements under the same parameters i have all of the view limits and standards that i use for analyzing measurements listed out below in the description so check those out so you can use them for your measurements so quick interruption i've been editing this video and it is dense and it's long but it's got a ton of awesome info in it i promise so we're breaking this video up into two parts part one is going to be defining the measurements and showing you how the graphs actually work and are laid out and then part two we're going to break down different example measurements that we've prepared and show you how to analyze your measurements and really figure out what's going on in your room down below there are time stamps and chapters for each section of the video so you can jump around and go back and review things later on so grab a pen and pencil coffee and some snacks maybe and let's jump right in here i have our spl and phase graph pulled up and what this is currently showing us is the frequency response in our room here and as you can probably tell this thing is a complete mess right now so we need to smooth this out so we can actually start to see what's going on in this room to do that i'm going to head up to the menu bar in the top left here and this will show us the different smoothing options that we have smoothing allows us to change what we're looking at kind of reduce the resolution so we can get a better picture of what's actually happening the measurement microphones that we use are much more sensitive than our ears are and so while the measurement mic can perceive all these changes and variations that are happening in the room we can't so the psycho acoustic smoothing option here this is the best depiction of how we would actually hear the room and perceive what it sounds like it's not great if you're trying to hone in on specific problems and really figure out what you need to fix but it is a very useful way of viewing measurements if you're trying to figure out you know how you should eq your monitors or what the overall tonal balance of your room is if i'm trying to hone in on just a low frequency problem i'll change my view settings here and then go to 148th or 124th this still gives us a lot of clarity and definition so we can get a really good sense of what's going on in the graph here but also allows us to you know have a better overall picture of what's happening so we don't see quite so many of those crazy squiggly lines going on if we're trying to get a broader sense of what's happening in the room i'll typically use 1 12 to 1 3 depending on what i'm looking at one third is the smoothing that is used for pretty much every technical standard and technical measurement so if you see measurements of the speaker or a microphone those typically have one-third smoothing applied to them and if you're looking at technical standards for what a critical listening room should sound like those are also generally written with one-third smoothing applied so if you're reading through anything that says your your frequency response should be plus or minus 2 db to meet the ebu standards that's plus or minus 2 db with one third smoothing applied most of the best home studios tend to fall a little bit closer to plus or minus 5 db with one third smoothing and as you'll see when we start going through the example measurements that's actually quite achievable so i have 1 12 smoothing applied to our graph here but even with this it's quite hard to really tell anything that's happening in the low end so down in the bottom right here you have this 20 to 20 000 hertz view setting and then also a 20 to 300 hertz if i click on that i can quickly change on the screen what i'm looking at our measurement is still falling off the ends of our graph here i have my normal view settings pulled up but if i zoom out just a little bit now we can get a better picture of what's actually happening because we can see the top and the bottom of this graph and now we can start to see how much variation we have if i hit control and right click rew will tell me what the overall variation in this room's response is and so we can see a variation of 32 db or 33 db that's plus or minus 16 16 and a half so this room as is has a huge variation in its frequency response for an untreated room or room with minimal treatment this is completely normal these things are ugly and they're going to be really wavy so don't get discouraged when you start looking at your measurements making big changes can be a challenge but every little bit helps the spl or frequency response graph is a great tool for comparing one measurement to another or analyzing the overall tonal balance of a room by default this is the first graph that rew shows us but it's actually probably the least helpful or the least insightful in terms of understanding what's happening in your room so let's jump into some of the other measurements that we have available to us and we'll take a closer look at what's actually going on in the room in addition to our frequency response we can also view our phase here this will be super helpful if you're trying to integrate a sub along with your speakers we're going to take a closer look at this a little bit later on so i won't touch on it too much now next up we have our impulse response or energy time curve measurements here this lets us see how sound is moving throughout the room it'll show us over time the sound arriving directly at the microphone and then all the reflected sound afterwards and how that's impacting the overall energy in the room so this is the impulse response window and then up top we also have this filtered impulse response i prefer using the filtered impulse response because it actually allows you to filter this by octave band so if you want to hone in on what's happening in a specific frequency range you can do that by selecting a different octave band here in the top right for now we're going to take a look at the unfiltered measurement so i'm going to apply my normal view limits here and we'll talk a little bit more about what's going on in this room so on the x-axis we have time plotted out you'll see in milliseconds i like to view this graph either from 0 to 50 milliseconds or 0 to 30 milliseconds in an untreated room we're going to have more reflections occurring later on so 50 milliseconds is more appropriate right now our y-axis is showing us a percentage and this is a percentage of how much sound is occurring after the initial sound source so if i zoom out we'll start to see our initial peak here is at 100 so this is the initial sound source and then everything after this is the decay in the room these are all big reflections off of a boundary so either the walls or the floor the ceiling or a desk and then we can start to see and analyze over time when those are occurring and if we know when in time those occur we can actually figure out which boundary they're coming off of and then determine where we need to put treatment or what we might need to move to smooth out some of those reflections so you might have noticed this line that's coming down here on our graph that's the schroeder integral and it's depicting the overall decay shape of the room what we'd like to see here is to have a very smooth decay without any of these sharp drops or flat lines moving across obviously in this case with an untreated room we've got a pretty uneven response here but as we get into more and more treated rooms you want to see that really smooth out and have a nice even decay it will also come way down so my normal view parameters for this graph actually only go up to 35 percent but you'll see here we completely cut that off if i view it that way so in order to view this untreated room you really got to zoom out so we can get a better sense of the overall decay of the room rt60 or reverb time is something you're probably actually familiar with it is the amount of time it takes sound to decay by 60 db now in studios we don't typically use rt60 because it's very hard to have that long of a decay time and we don't have a truly diffuse sound field so what you'll see in here is actually t20 or t30 and a couple of different options here if i'm analyzing a studio i will pretty much always use t20 as the timing reference here and that's just how long it takes to sound decay by 20 db instead of 60. in the rt60 window our view settings or limits will change quite a bit depending on whether or not we're looking at a treated room or an untreated room as you'll see here i have this set to 1.5 seconds but if this room were treated and for a normal control room or a mixed room we want that reverb time to be much closer to 200 milliseconds or between 150 or maybe 250 milliseconds so that's all the way down here but obviously in an untreated room we've got this huge reverb time of over one second so your limits will just kind of change depending on what it is that you're looking at overall what we want to see in this graph is a very nice even decay time we don't want any big changes from one band to another as we get into treated rooms this whole thing will drop way down to here what typically happens in well-treated rooms you have a nice even response from the top of the graph down to 100 hertz or so and then you'll start to see the low frequency decay time to slightly rise and that's completely normal we don't want to have a massive rise there so you don't want to go from 200 milliseconds to 700 or 500 but if it goes up to 300 milliseconds or so 400 if the room doesn't have a lot of bass trapping that's going to be pretty normal so don't be alarmed if you start to see a rise in the decay time of your lower frequencies that brings us to my two favorite measurements the waterfall plot and the spectagram and these both show the same thing with just slightly different views they're going to show us the overall frequency response of the room and you'll see that here on the waterfall plot on the top and they also showed the decay of the room across the frequency spectrum so on the waterfall plot you'll see on the right hand side here we have time mapped out and so as this graph is moving towards us or towards the front of the screen we can actually see the decay of the room if i change our view settings here to just the low frequencies we'll get a better idea what that looks like so we can see on the graph here we have certain frequencies that are taking longer to decay than other these peaks that are coming towards us here at like 214 or over here at like 240. those are the frequencies in this graph that are taking the longest to decay so if we hop on over to the spectrogram graph we have the same information just shown to us in a different way so here on the left side of the graph we have time and then on the bottom right or moving across to the right on the x-axis we have frequency and then the spl level of our measurement is actually shown using the colors here so the red color here is the loudest highest spl level and then this dark blue is going to be the quietest or softest spl level in the measurement and then we can very clearly see here you know which frequencies are taking longer to decay so if i change our view settings here to just the 20 to 300 hertz frequency range we can get a really detailed view of what's happening we can start to see which frequencies are lasting longer and taking longer to decay and then which frequencies are maybe missing some information or where we have a null in our response this allows us to get a really complete picture of what's happening in the room you can see both the frequency response and the decay at each individual frequency so we can put together a plan on how to treat the room or we can see if the treatments that we have in the room are being effective so like i said the waterfall and spectrogram graphs show the same information just in slightly different ways for more detailed analysis of which frequencies are decaying too long in the room i like to use the spectrogram graph because you can really hone in on the detailed information here from one frequency to another for overall analysis and bigger picture views of what's happening in a room the waterfall plot is great you might have noticed there's a few measurements and graphs that we didn't touch on things like group delay and minimum phase some of the more advanced sides of rew then there's also measurements like clarity which we didn't touch on and that's not something that's used a whole lot in studios but is used a lot in venues churches offices if that's something that you want to see let us know down in the comments below and we can make a part 3 to this series here i have two measurements pulled up from my office i have a before and then an after measurement the after measurement was taken with our home studio room kit installed and the before measurement was taken with nothing in this room we're going to go through all of the different measurements and see how things are changing with and without that treatment there's a couple of main points i want to go over one it's super important to use the right treatment for what you're trying to accomplish if you want really really solid tight low end you need big bass traps and you need those bass straps to be installed with air gaps behind them so they can work well the second point is that the spl graph like i mentioned earlier does not tell the whole picture so as you'll see when we're going through these different graphs the spl measurement doesn't change a whole lot we have a pretty consistent frequency response between these two measurements but every other measurement is going to show a very different picture so it's important to use all those when you're analyzing your measurements that you really understand what's going on in your room so i have the frequency response overlay pulled up here and our before measurement is marked out in red and the after measurement is marked out in this teal color and you can see we don't have a whole lot of change happening here between the before and after what we do see is a change up here in the higher frequencies and then in our mid frequencies as well we see a lot more variation in the treated room than we actually do in the untreated room this is a result of the clarity in the room improving and that might seem a little confusing as it clearly looks like the graph isn't as smooth but what's actually happening in that red measurement or the before measurement is all those reflections are smearing out the frequency response of the room we have a ton of reflected sound so there's no real definition or clarity to the sound in the space and that can actually result in a flatter measurement but it doesn't give you any detail or definition and it doesn't really let you hear the sound of your speakers because you're hearing the reflected sound in the room that's not to say that this is what you want your frequency response graph to look like there's definitely more treatment that can be applied to the space to make a big improvement to the way this room sounds this room had our home studio kit installed in it and that's very much so meant to be a starting point when you're treating your room it doesn't have a ton of panels and it doesn't have any big bass traps it doesn't have anything capable of really working below 100 hertz or so and that's why we don't see any real change in the low frequency response of this room as you'll notice if we look at the graph here our low frequency response below 100 hertz has almost no change to it but in order to really affect change at that frequency range you need big bass traps you need them to be at least six inches deep and then to really make them effective in that range they have to have at least six inches of air behind them that really requires a total of a 12 inch deep bass trap and in this room we mostly had high mid and broadband panels that's why using the right treatment for what you're trying to accomplish is so important because there's no way that we can change the low end response of a room if we're not using the right treatment so let's take a look at some of our other graphs and see if the treatment actually is making a difference in the room now with our atc measurement pulled up we can see a huge difference in these two measurements which is a pretty striking comparison to that spl measurement we were just looking at now we can see our red measurement or our before measurement has a ton of reflected sound as you would expect to see so the acoustic treatment in this room actually is doing quite a lot and we can see a big drop in reflected energy which will translate into a much greater level of clarity and detail in the room and better stereo imaging all of these red spikes here are an increase in reflected energy and a much longer decay time into the room so with that in mind let's take a look at our rt60 measurement and see what that's telling us so the first thing i notice is that i only have one measurement visible on this graph it looks like both are checked off so we need to adjust our view limits here so we can actually see the before measurement so let me change this to 1.5 seconds and now we can actually see it on our graph this is a pretty wild change here we've got the treated room down here living around 250 milliseconds or so with a with a sizable rise in the low end as we would expect to see because we haven't actually treated the low end at all and then we have our untreated room all the way up here at around one second so the treatment that we do have in the room is very effective from 70 hertz all the way up to 10 000 hertz it's just not doing a whole lot below that like we talked about while looking at the spl measurement now i have the spectrogram window pulled up so let's see what's going on here so on first glance what i notice is a pretty wide variation in the colors so we've got some hot spots down here in our low and low mids and then a pretty big variation up here in our highs and our mid frequencies and then along with that we've got obviously a very long decay time shown here with all these blue spikes trending upwards of 600 milliseconds or so now let's jump to the after measurement and we get a pretty striking contrast here we have a much more even dispersion of our red color which is indicating a more even frequency response and then on top of that we obviously have the much improved decay time in the room which we saw in our rt60 measurement as well as the etc graphs all of these things are showing us that there was a massive change to this room despite the fact that it's not really shown on the frequency response or the spl graph and that's why it's so important that we use all the different measurements available to us in rew so that we can get a complete picture of what's happening and really understand how to improve your room so let's talk about subs and how you can tell if your speakers and your sub are working well together so i've got a measurement set prepared here i'm going to pull up our overlay so we can start to compare things here's the frequency response of just our speaker and then let me add in just the sub so we can see here our sub is starting to fill in some of this low frequency information that the speaker isn't putting out and we very clearly have a crossover occurring right around 56 hertz here and then pretty similar responses up above that what we want to see if we take a measurement of the sub and the speaker together is that those two sources are working well together so they're adding up to a more even response that has an extended low frequency if i add in our sub and speaker measurement here now we can see we have an extended low frequency response and we haven't lost anything so our crossover point is still having a positive effect here we've gained amplitude the null that we had while we didn't fill it we didn't create any new problems so those two sources are working really well together now i'm going to add in another measurement this again is our speaker and sub but this time i flipped the phase switch on the sub 180 degrees so we've got a pretty striking contrast here now we have a huge null occurring at 56 hertz right where we saw that crossover point was and the low frequency extension that we had gained has been diminished quite a bit higher up we are seeing some differences as well but that sub was low passed at 50 hertz so the main changes that we're really seeing here and the huge problem is this massive null that we created and this is why having your phase and your speaker time aligned and correctly phase aligned is so important because we need them to work together so they're adding to one another instead of subtracting or fighting each other another way that we can analyze this and ensure that our speaker and our sub are working well together is with the phase graph so this is shown with our frequency on the x-axis and then on the y axis on the left here we actually have it shown in degrees so the phase measurement is going to look pretty different from what we're used to let me hide most of these and then we'll look at just the speaker and the sub phase is shown in degrees so if you flip the phase switch on something it's going to flip 180 degrees out of phase so it's completely reversed so if we have something that's at 0 degrees and then we have something that's a 180 degrees those two sound sources will cancel out or fight each other the same thing if you have it at minus 180 or zero if we look at our measurement here we'll see that as we get higher in frequency our graph is moving downwards and that's completely normal what the dotted lines indicate here is that as our measurement is moving downward rew has wrapped it so they just move it straight up 360 degrees so we haven't had any rotation or change to this measurement yet but in order to keep it on the graph so that it doesn't continually trend downward they've wrapped it so that we can still see it and analyze it you can turn that off up here so now you can see that this continues downward and if i scroll over it'll start to take a sharp dip and obviously we can't keep all of this on the screen so we can wrap the phase so that it's easier for us to analyze things and see the complete picture in one window i'm going to pull up our two sub measurements our regular sub and then our sub with the phase flipped so let's take a look and see where these fall on our graph so we've got minus 28 or so here and if i move upwards we're going to be at minus 149 or so so these are basically 180 degrees out of phase with one another so if these two sources played at the same time they would be completely canceling each other out any time you're looking at a phase measurement and we have two sources that are completely out of phase with one another we know we're going to have a problem now let's take a look and see what just the speaker looks like and then we'll see what happens when we add in the speaker and the sub now we can see when we add in our speaker we're not creating any major phase changes to the response which is exactly what we want those two things are summing really nicely together and they're not fighting each other so now i want to add in the measurement of our speaker and the phase flipped sub if we take a look at this we can start to see a huge phase shift occurring this is an indication that those two sources are not aligned well and that we have a problem so the ways that you could go about fixing this would be to either move the sub to a new position in the room or to flip that face switch in this case if they're not perfectly 180 degrees out of phase moving the sub to a new position or moving your speaker to a new position is going to be the best way to get those better aligned let's take a look at a couple different measurements here that really clearly show sbir or speaker boundary interference response these reflections are off of boundaries either like your desk or your wall or your ceiling and they can cause really big dips or peaks in your frequency response i've got a couple of measurements here that i took in our demo room our first measurement had panels on all four of the walls and then the second measurement i took those panels off of the front wall so we could see what would change when we remove those panels our red response here has panels on all four walls and then our green response with this big dip in it doesn't have panels on the front wall so as we can see we got this big change around 240 hertz in our frequency response and then we also had a bit of an increase in the low end at 68 hertz a room mode and another increase in variation here a little bit higher up in the 400 range so right off the bat from the frequency response we can see things are getting worse without those panels on the front wall behind the speaker to get a better sense of what was happening in the room let's take a look at our energy time curve and see if we can find those reflections that are causing the change in our frequency response again we have the red measurement which did have panels on the front wall and our green measurement which did not have panels on the front wall and right off the bat here we can start to see some really big variations between these two measurements our green measurement has more reflected sound in this very early range around three to six milliseconds and then again here at eight milliseconds and then as we move later on in time we can start to see some really big peaks in energy here so we've got these two and then later on as well around 21 22 and 23 milliseconds we have these big spikes and again a little bit later and these are all contributing to those changes that we saw in the frequency response this allows us to figure out exactly where this reflected sound is coming from sound travels just about one foot for every millisecond so we can figure out that if this reflection here occurred 11 milliseconds after our initial sound source that this sound or this energy had to travel an additional 11 feet we can then map out in our room either on a piece of paper or with take a string and figure out you know which surfaces or which boundaries it could have bounced off of that would fit that 11 millisecond range then we can put a panel there to test and see if that's the area of the room that we actually need treatment in with a little testing and use of the energy time curve or your impulse response measurements you can really fine tune your panel placement and make sure that your all of your early reflections are well treated here i've got another example of speaker boundary interference response or reflections occurring in a room so this is that same room but now i reconfigured the treatment and the panels in there a little bit our first measurement the blue one here has two panels right in the middle of the back wall in the room and then our second measurement here has those two panels removed and placed on the floor in between the speaker and the microphone so we can see some pretty interesting things happening here our first measurement very clearly has a spike in energy right around four milliseconds very quick after our initial sound source and then our second measurement the measurement that doesn't have the panels on the back wall anymore has a big reflection or has two big reflections at 15 milliseconds and 16 milliseconds so we can pretty easily take away a couple of things here one our floor reflection is obviously happening at 4.3 milliseconds because as soon as we put two panels on the floor we were able to get rid of that and then in doing so we had to take those two panels that were in the middle of the back wall and put them on the floor and then we created this big reflection at 15 and 16 milliseconds so now we know where in time our reflection off the back wall is occurring and where in time our reflection off the floor is occurring for reference this room's 14 feet deep and our measurement microphone was 5 foot 5 inches away from the front wall so that means our reflected sound would have to travel past that microphone hit the back wall and then bounce back and if our mic was five foot five inches away from the front wall it was just over eight feet away from the back wall which means we would expect to see that reflected sound occur right around 16 milliseconds or a little bit over 16 milliseconds which is exactly what we're seeing here so that's how you can figure out using your energy time curve or your impulse responses which boundary or surface in your room your reflected sound is coming off of so we have another set of measurements for us to analyze here and these were taken in a room that was really well treated so our first measurement shows that room fully treated and then the second measurement that we're going to look at shows the same room but with the cloud removed and i'll flash a picture up on the screen here so you can see what that room actually looked like with all the acoustic treatment in it so i have our waterfall plot pulled up here and this is the room with the cloud as well as the rest of the treatment you can see a really nice even decay across the frequency spectrum and a pretty even overall frequency response with only 1 48 smoothing on this if i switch over to our second measurement without the cloud we're going to start to see a really massive change here starting around 300 hertz or so we can see all of these echoes occurring in a much longer decay across the frequency spectrum so this is just from that sound bouncing back and forth between the floor and the ceiling in that room as that cloud was removed and the rest of the room was really well treated there was a really prominent flutter echo that was created because we had a very well treated room and then two very reflective parallel surfaces that were left and we can clearly see that here in the waterfall plot let me switch back over to the untreated room again so you can see this gets really well cleaned up and then if we flip back over we've got the flutter echo that's very clearly seen here as well as this increased decay time down here and i'll leave the cursor here and switch back over so you can see that again clearly a very large change in both the decay time of the room and cleaning up that flutter echo and that's just the difference that one cloud can make to give you a more complete sense of what these measurements look like with and without that cloud let's take a look at the etc the rt60 and our frequency response so right off the bat we can see a big change in the overall frequency response we've got this big null that was created around 120 hertz and we've got two peaks above that that we also see introduced to the frequency response i'm going to remove the measurement that doesn't have the cloud in it and smooth this measurement to one-third so we can take a look and see what kind of variation we have in the frequency response of this measurement as i mentioned earlier the standard for the best studios in the world or ebu critical listening environments is plus or minus 2 db with 1 3 smoothing and then really great home studios fall typically between plus or minus 5 db and that's all with one third smoothing on let's take a look and see how this room is performing so i'm going to right click on our peak here while hitting control and then scroll down to the lowest point in our measurement and we can see that we've got a variation here that's about six or seven db so plus or minus three plus or minus three and a half db so like i said achieving a really great home studio is pretty attainable there's around four thousand dollars worth of acoustic treatment in this room but it's just a regular bedroom it's 14 by 11 feet with an eight foot ceiling so you can definitely turn that extra room in your house or your bedroom or whatever it may be into a really great sounding room alright so here we've got the energy time curve pulled up for this measurement and the difference between these two is pretty wild and striking like some of the other graphs with and without treatment that we've looked at before this green measurement without the cloud very clearly shows where these reflections are occurring like we saw that reflection off the floor this reflection off the ceiling now is right around four milliseconds and if you have an eight foot ceiling and your measurement mic is at four feet you would expect those to be pretty much at the same point in time so that makes perfect sense and then these later reflections here that we're seeing are going to be what we saw in the waterfall plot as that flutter echo where it's pinging back and forth a lot so if i highlight our red measurement here we can see just how different these two are and really pinpoint where that new reflected energy is occurring over time in the room last thing i want to look at with these measurements is the reverb time so i have our t20 pulled up here for this room with the cloud and then i'm going to add in the same t20 measurement but without the cloud so adding in that t20 without the cloud we can start to see that our our reverb time not only got more inconsistent but also increased quite a bit and like i said earlier our main goal with reverb time is to have it be as even as possible so we don't have any big jumps from one band to another like we see here and then also here down below utilizing all the different measurements within our aw we can really start to get a complete picture of what is happening in the rooms and how we can improve the sound in those spaces either by moving acoustic treatment or adding new treatments that are better suited to the needs of the room well i mentioned that the spl or frequency response measurement was not my favorite it does particularly excel in one area and that is taking a group of measurements and comparing them directly to one another so that we can see how the overall tonal balance of the room is changing so here i have a measurement set pulled up with seven different speaker placements that i tested and we're going to take a look and see which one performed the best and how those vary from one location to another so with all seven of these measurements piled up on top of each other in the overlays it's a little hard to tell what's going on so let's clear them all out and then we'll pull in our first measurement now these were all taken in an untreated room so things are pretty all over the place but is a great way to see the room's overall response and how we can start to even things out just by moving our speaker and listening position locations so here's our first measurement and this turned out to actually be the best measurement in the set it's got a response that's around plus or minus 9 db as we start to add in our other measurements sometimes things were pretty close to this and other times they were quite drastically worse so with b right off the bat we can see a pretty big variation in just these first two measurements and this was just moving the speaker a couple inches the peak from our mode came down here a bit but the nulls that we have up above that dropped way down adding in our c measurement now we can see what that new speaker placement is adding and again we've got basically the same changes from a to b we've got the room mode peak coming down but then we've got that null so it's a little bit better than b but still doesn't quite have the overall balance that we had with a now let's add in that d measurement so here we've got a response that's much closer to what we had with our initial response that a measurement so things are definitely more balanced out than with b or c but doesn't have any real improvements over a so let me go ahead and hide c and b so we're just looking at the two best measurements now and we can see a little variation overall but very similar shapes to these two measurements and nothing really too striking that makes one of these measurements significantly better than the other so continuing on with our comparison let's pull an e here and we can see again this jumps kind of back to that b and c so slight change of the room mode response around 80 db but again we've got this huge null now at 126 hertz or so and if we add in f we can actually see a very similar response but even worse so now this is off of our graph so let me adjust my measurement here so we can get the whole picture and if we go ahead and plot our the variation of this we're up we've got a variation of over 30 db or so that's plus or minus 15 db and if we compare that to a we're at plus or minus 9. so just by improving our speaker placement and listening position locations we evened out the response in this room by 6 db which is pretty incredible so we finally made it i know this is a long video but i truly hope that it helps give you a better understanding of acoustic measurements rew and how you can use acoustic measurements to improve the sound in your studio if you liked the video please don't forget to like and subscribe and we'll see you in the next one
Up Next

How Catalytic Converters Work: Emission Reduction Explained
@Donut
1.9M views•2018-04-11
Ultrasonic Transducers: Resonant Frequency Measurement and Horn Design
@imajeenyus42
229.9K views•2017-02-22

Polymer Environmental Degradation: Mechanisms & Stabilization
@iit
1.8K views•2012-07-10
How a Student's Question Saved a NYC Skyscraper from Collapse
@veritasium
22.8M views•2025-04-26
Related Study Plans & Knowledge Roadmaps
Structured learning paths in Engineering