


















![PHÂN TÍCH XÉT NGHIỆM SINH HÓA GAN 2025 - PGS.TS.BSCKII. TRẦN THỊ KHÁNH TƯỜNG [250218]](https://i.ytimg.com/vi_webp/sW1KWTZQsPI/maxresdefault.webp)








Liver function tests can be interpreted using three patterns: isolated bilirubin elevation (Gilbert syndrome if unconjugated, hemolysis if conjugated with low hemoglobin), cholestatic pattern (R-value <2, caused by drugs, biliary obstruction, PBC, or PSC), and hepatocellular pattern (R-value >5, caused by paracetamol, viral hepatitis, alcohol, or fatty liver disease). The R-value is calculated by dividing the patient's ALT by upper limit of normal ALT, dividing ALP by upper limit of normal ALP, then dividing the first result by the second.
How to Interpret Liver Function Tests (LFTs) Simplified | Clinical Guide
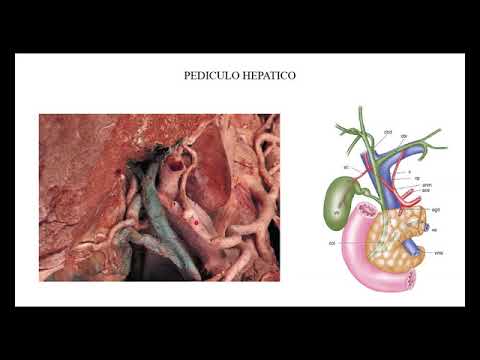
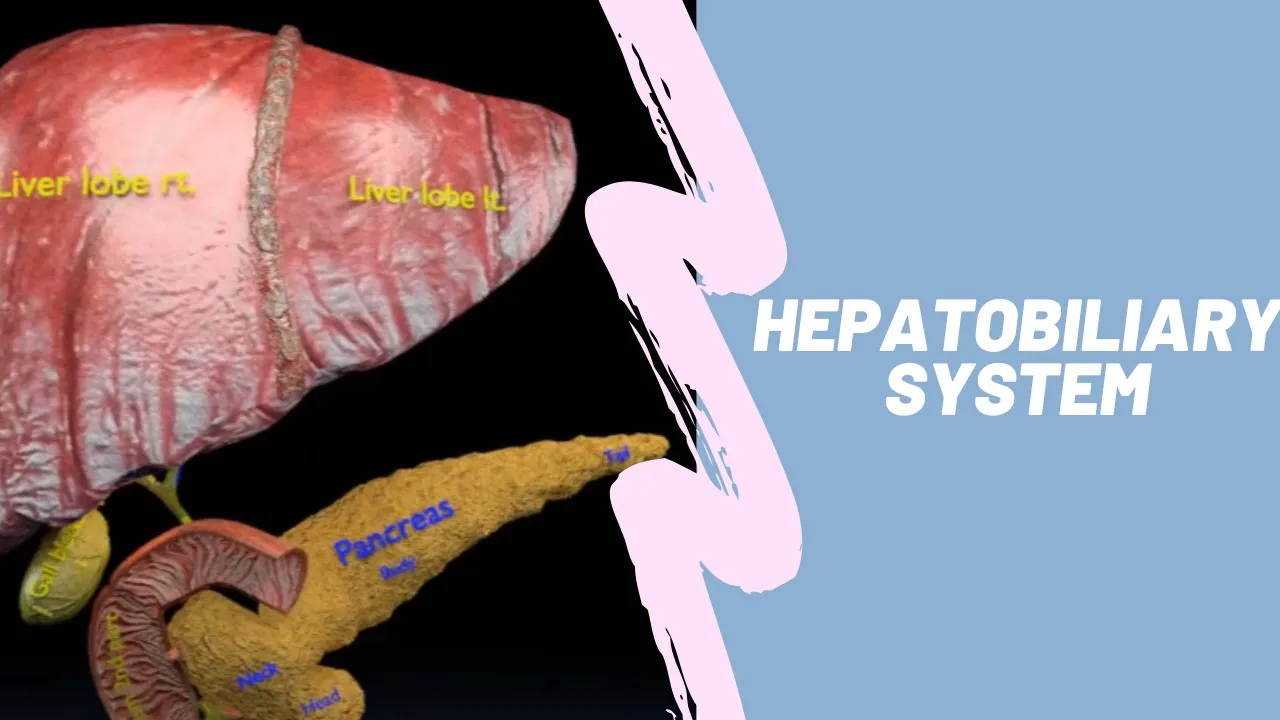
Added:Basic anatomy and physiology of the hepatobiliary system, including the biliary tree and hepatic portal system.
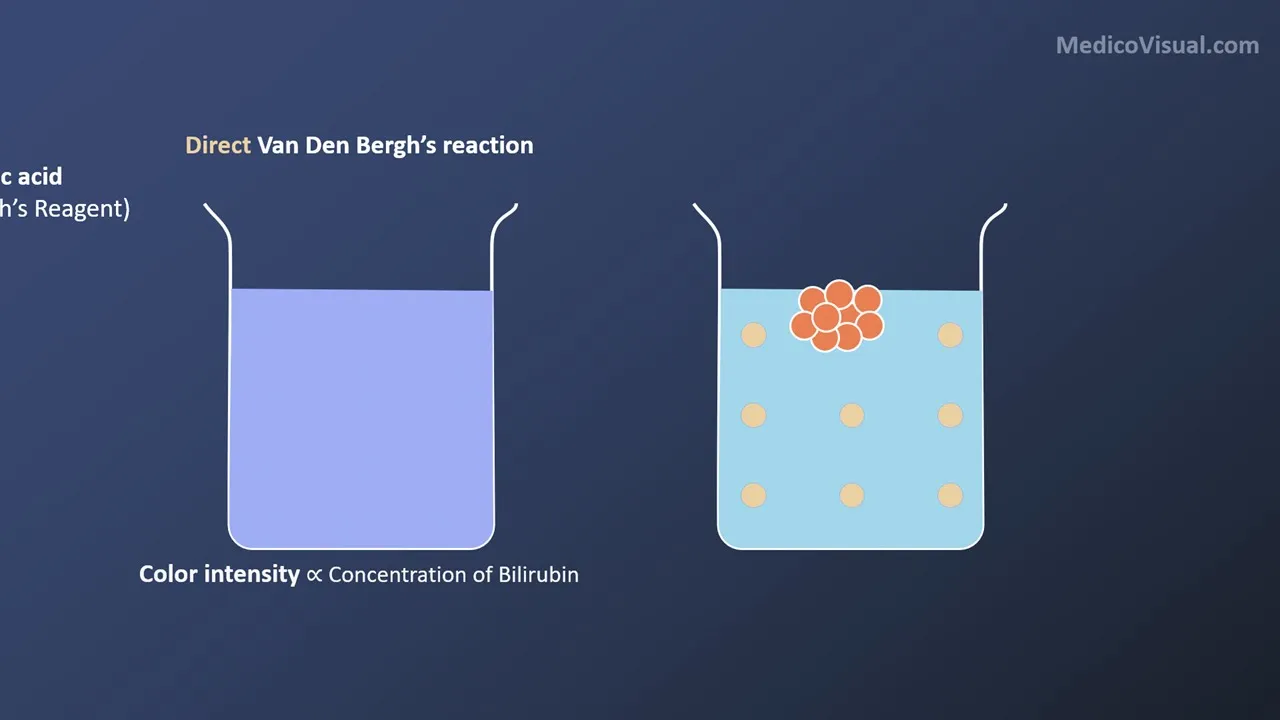
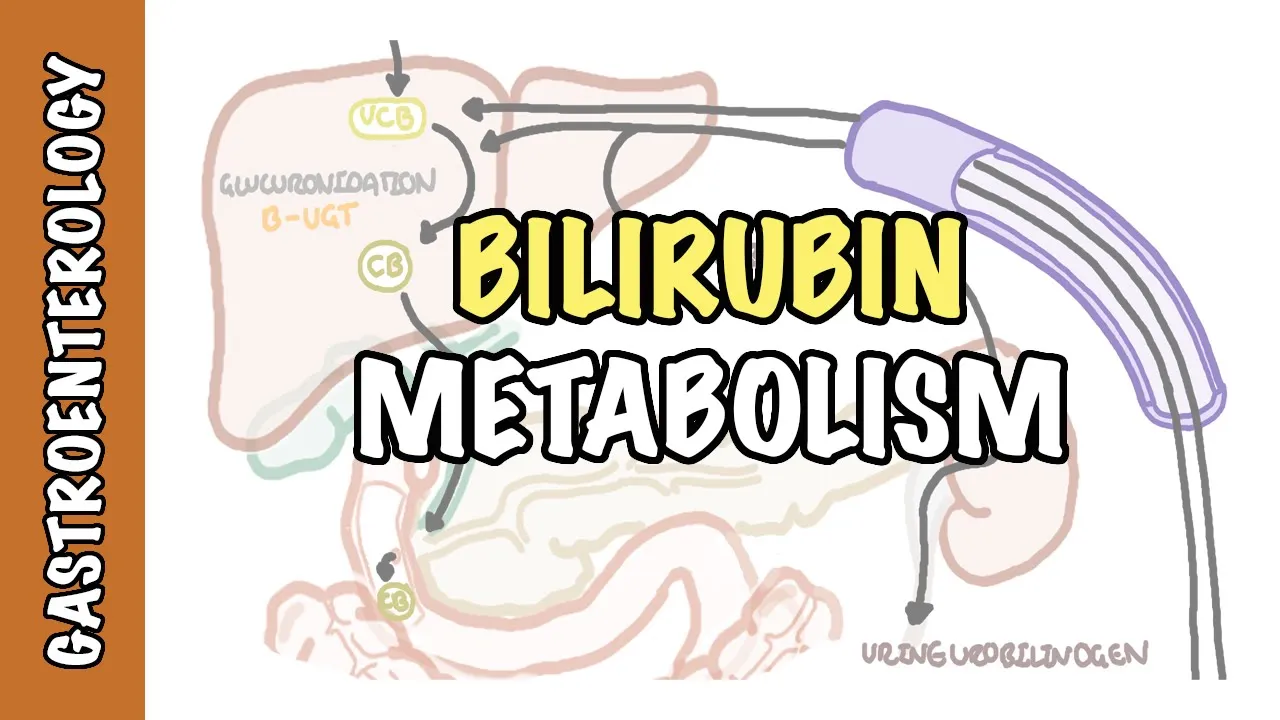
The biochemical pathway of bilirubin metabolism, specifically the difference between conjugated (direct) and unconjugated (indirect) bilirubin.
The physiological roles and cellular origins of primary liver enzymes (ALT, AST, ALP, and GGT).
Fundamental pathological concepts distinguishing cellular injury (hepatocellular) from flow obstruction (cholestasis).
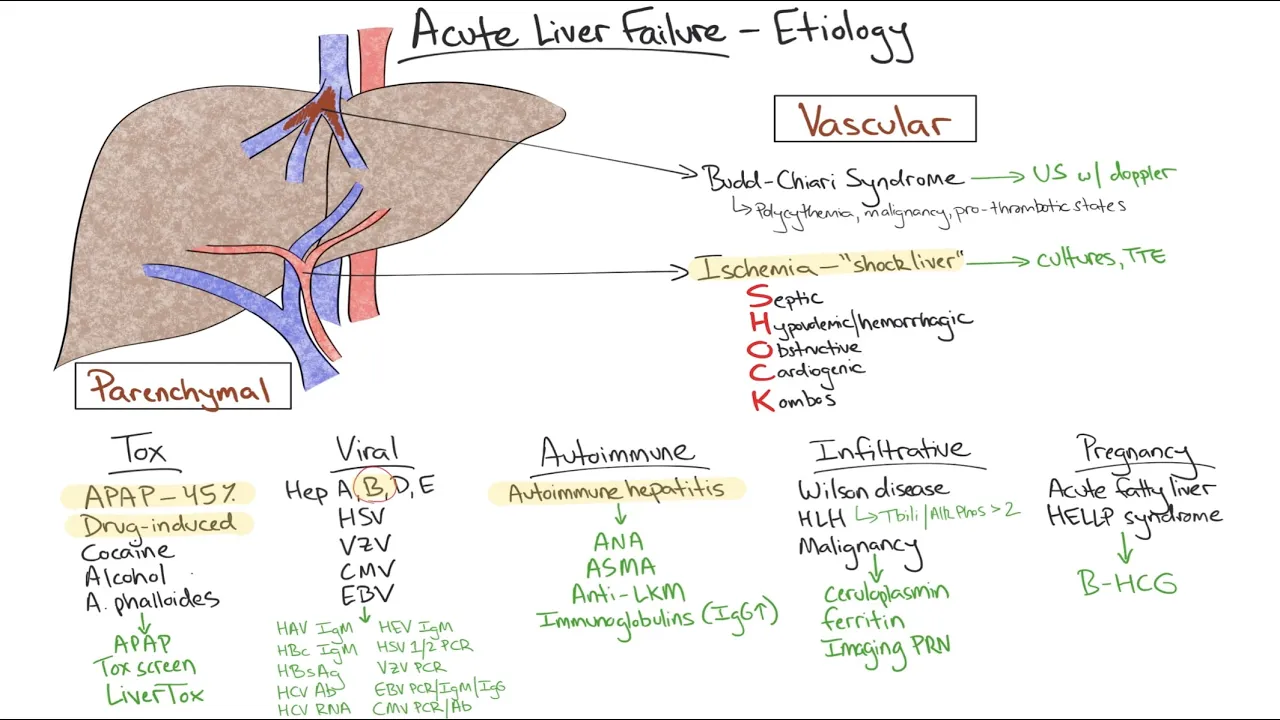
Formulating a targeted secondary diagnostic workup (e.g., viral hepatitis serologies, iron studies, autoimmune markers) based on LFT patterns.
Utilizing diagnostic imaging modalities such as Right Upper Quadrant (RUQ) ultrasound, MRCP, or ERCP to investigate cholestatic patterns.
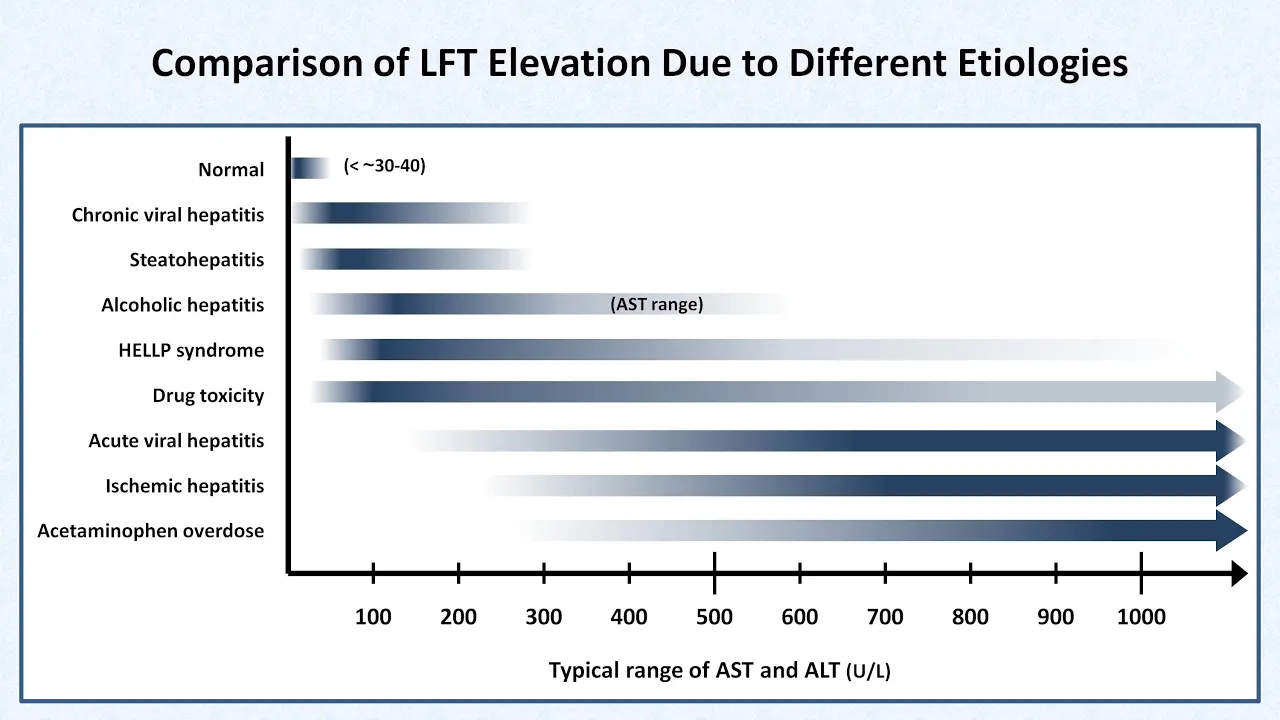
Applying clinical ratios, such as the De Ritis ratio (AST/ALT ratio), to narrow down specific etiologies like alcoholic liver disease.
Assessing chronic liver disease severity and prognosis using scoring systems like the MELD (Model for End-Stage Liver Disease) score and Child-Pugh classification.
383 views26likes8:44Original Release: 2024-08-19
hello everyone welcome to another lecture on medicine with fan in today's lecture I am going to teach you how to interpret liver function test in the most simplistic fashion there are three patterns of LF derangement there can be isolated raise bin there can be catic pattern and finally there can be hepatocellular pattern let's discuss them one by one if only bluubin is raised and all other biochemical profile including alt as Alp is normal then we need to check complete blood count if CBC the complete blood count is normal then think of Gilbert Syndrome incidence of Gilbert Syndrome is like 5 to 8% in general population the patients of Gilbert Syndrome are mostly asymptomatic Jes in such patients appear only during stress dehydration infection starvation if there is low hemoglobin on complete blood count then think of hemolysis if that's the case then MCV on complete blood count will be normal and then you will have to order lactate dehydrogen LDH and reticulo side count and both of them will be high and finally hpog globin will be low all these findings will collectively confirm that the rais Belin is most likely due to hemolysis remember that in the case of isolated ra bin if there is only unconjugated hyper binia then we are most likely dealing with Gilbert Syndrome and if there is conjugated hyper bmia then we are most likely dealing with either dubben Johnson syndrome or rotor syndrome both of these condition are quite rare let's discuss the second pattern that is ktic pattern in ktic pattern alkaline phosphatase that is Alp and Gamma glutamil transfer that is ggt are predominantly raised alt and as can be raised too but there are only minor elevations in them in cholestatic pattern the R value will be less than two to calculate R value we divide the patient's alt by upper limit of normal Al value and we also divide the patient Alp by upper limit of normal Alp then we divide the alt value by the Alp value the result we get is r value for example if the patient's alt is around 140 and the upper limit of normal alt value is around 35 then we divide 140 by 35 and that would be around maybe 4 if the patient's Alp is around 520 and the upper limit of normal Alp is around 130 then we divide 520 by 130 and again the value may be around four now we divide 4 by 4 and the result will be around one this r value that is around one shows quatic pattern so again if r value is less than two it indicates coatic pattern if r value is greater than five it indicates hpat cellular pattern and if it is in between that is more than two and less than five then it indicates mixed pattern now chasis can be due to drug induced liver injury also known as D the drugs causing this pattern can be oral contraceptive pills steroids lyine and cotrimoxazol other causes of chesses include buy obstruction for example G stones or CD stones or in fact pancreatic cancer another cause of chasis includes primary bilary colangitis PBC it is 10 times more common in women and the typical presentation will be of a woman are middle-aged women with lethal and Prius the antibody most commonly associated with PBC is antim mitochondrial antibod also there will be raised IGM antibodies another cause of coltic pattern includes primary secularizing colangitis PSC PSC is commonly associated with ulcerative colius and Approximately 80% of primary cular rizing colangitis patients have concomitant ulcerative colitis bianka might be raised in primary ciz colangitis MRCP or ercp are diagnostic for this condition finally in the third pattern that is a p pattern alt and as are predominantly raised as compared to Alp and ggt which can also be mildly raised but not predominantly r value as we just discussed in hepatocellular pattern is more than five common causes of hepatocellular injury include paraset the most notorious other r that can cause a Pell injury include antituberculous drugs meth exit nitrofen and phenin viral hepatitis can also cause hepatocellular injury and in viral hepatitis the elevation in Al will be more than the elevation in as history and serology will confirm the type of viral hepatitis remember that in liver curosis Al and as can be normal alcohol related liver disease a or LD or just Al can also cause heos injury there will be history of excessive alcohol consumption and the rise in as will be higher than the in alt in fact if as is double the value of alt then it is quite sensitive for alcoholic related liver disease and other condition that causes hepatocellular injury and it is quite common in especially developing countries is non-alcoholic fatty liver disease and afld there will be history of obesity High BMI the patient might be suffering from some sort of metabolic syndrome like diabetes hyper cholesterolemia nld score or for score can be used for further assessment in non-alcoholic fat liver disease and finally autoimmune hepatitis can also cause hepatocellular injury one thing that is most important in autoimmune hepatitis is the history of other autoimmune diseases like if the patient is suffering from autoimmune hepatitus they may also be suffering from other autoimmune diseases like some sort of thyroid disorders like grave diseases and so on in autoimmune hepatitis anti- smooth muscle antibodies are lier kidney microsomal antibodies may be positive to differentiate between different causes of hepatocellular injury on the basis of lfts just remember that the alt and AF in conditions like alcoholic or non-alcoholic fatty liver disease are in the range of maybe 400 or 500 but in paracetamol toxicity or acute liver failure due to viral hypatius or in fact autoimmune hepatitis the alt and as are in the range of thousands like maybe 2,000 or 3,000 in fact also these conditions follow a specific time frame the duration is in fact not diagnosed but it can give you a clue for example if the patient progressed from jice to incopy in less than 7 days then most likely cause may be paracetamol toxicity if the progression took 1 to 4 weeks then viral hepatitis can be the cause and if the condition progressed over months then it can be drug related or due to autoimmune cause or in fact metabolic cause like Wilson's disease lastly I want to talk about raised Alp and cholestatic pattern if Alp is raised then look at bluubin and ggt if both bluubin and ggt are raised too then the elevated Alp is most likely hepatic in origin and the first step to assess the patient would be to do ultrasound of right upper quadrant if bin and ggt are normal and only airp is elevated then most likely it is due to unnown hepatic source for example bone and placenta in that case the causes include healing fractures ostomia hyperism disease and Bone Ms now how to proceed if there is raise Alp due to hepatic Orion on Imaging like ultrasound if there is bil ductal dilation too then most likely it is extra hepatic cholesterosis and the causes include common B duct Stones which are most common cause of extra hepatic chasis other causes can be malignant obstruction for example c a pancreas and primary secularizing colangitis if there is raised Alp of hepatic origin but no Billy ductal dilation then most likely it is intrahepatic cerasis and the causes include viral hepatitis intrahepatic colis of pregnancy which usually appears in the third trimester it can also be due to Total b entral nutrition tpn other causes include primary B colangitis and primary secularizing colangitis as you can see primary secularizing colangitis is also causing extra hepatic stasis so yes primary secularizing colius is well known to cause both both extra hepatic and intra hepatic strictures I hope you enjoyed watching this lecture if you like this simplistic approach to interpret lfs then share it with your colleagues too for more such videos and lectures subscribe to my YouTube channel thank you
Up Next

82:27
Liver Function Tests (LFTs) Explained: Interpretation & Patterns | Clinical Medicine
@NinjaNerdOfficial
245.3K views•2024-03-11

48:47
Graphic Medicine: Comics for Collaborative Healthcare Communication
@nationalpatientadvocate
189 views•2023-12-04

10:28
Neuroanatomy: Central and Peripheral Nervous System Divisions Explained
@AKLECTURES
136.2K views•2014-09-20
3:05
Stages of Labor and Vaginal Birth | Childbirth Animation
@nucleusmedicalmedia
52.1M views•2017-08-18
Related Study Plans & Knowledge Roadmaps
Structured learning paths in Medicine
medicine
Abnormal LFTs: Diagnostic Workup & Pathology
01Liver Anatomy and Basic Physiology
02Introduction to Liver Function Tests (LFTs)
03Hepatocellular vs. Cholestatic Patterns
+ 3 more learning modules
12h6 modules
Explore Roadmap
medicine
Analyzing Blood Smears: RBC, WBC & Platelets
01Introduction to Blood Components & Smear Preparation
02Normal Morphology of Blood Cells
03Erythrocyte Pathologies & Morphological Variants
+ 2 more learning modules
12h5 modules
Explore Roadmap
medicine
Mechanical Ventilation: Waveforms & Alarms
01Anatomy and Physiology of Breathing
02Introduction to Mechanical Ventilation & Core Modes
03Ventilator Settings and Waveform Interpretation
+ 2 more learning modules
12h5 modules
Explore Roadmap
medicine
Neuro Exam: Localization & Stroke Syndromes
01Foundations of Neuroanatomy and Vascular Supply
02The Neurological Examination: Step-by-Step
03Principles of Neurological Localization
+ 3 more learning modules
18h6 modules
Explore Roadmap